TrustRadius: an HG Insights company

Save this comparison

Save this comparison

Add Product

Recommended Comparisons

    Overview
    ProductRatingMost Used ByProduct SummaryStarting Price

    DashboardFox

    N/AN/ADashboardFox is cloud-based business intelligence and dashboard software from 5000fish, built for teams that create and deliver dashboards and reports to clients, departments, or business units. It is priced by monthly active users (MAU) rather than per seat, so organizations pay for a tier instead of for every login, and accounts that do not sign in are not counted. Row-level security, white-label branding, and custom domains are included in every plan, which…

    $99

    per month Monthly Active User (MAU)

    Logi Symphony

    Score8.9 out of 10
    N/ALogi Symphony is a business intelligence and data visualization software that includes customizable dashboards, reporting, and visual data analytics. It can be integrated into users’ existing business applications and its visualization and reporting tools can be customized.N/A
    Pricing
    DashboardFoxLogi Symphony
    Editions & Modules
    Starter
    $99
    per month Monthly Active Users (MAU)
    Growth
    $249
    per month Monthly Active Users (MAU)
    Scale
    $499
    per month Monthly Active Users (MAU)
    Starter
    $4,995
    one-time fee per user
    Growth
    $9,995
    one-time fee per user
    Business
    $14,995
    one-time fee per user
    Premium
    $19,995
    one-time fee per user
    No answers on this topic
    Offerings
    Pricing Offerings
    DashboardFoxLogi Symphony
    Free Trial
    YesYes
    Free/Freemium Version
    NoNo
    Premium Consulting/Integration Services
    YesYes
    Entry-level Setup FeeNo setup feeNo setup fee
    Additional DetailsA primary pricing consideration is the licensing model: DashboardFox is priced by monthly active users (MAU), not per seat. You pay for a tier, and only users who actually log in count toward it — recipients who view shared or scheduled reports without logging in are excluded. For teams with many occasional or read-only users, this is often more cost-effective than per-seat BI tools. Feature inclusion is also notable: row-level security, white-label branding, custom domains, and unlimited reports and dashboards are standard on every plan, including the $99/month Starter tier. Higher tiers scale capacity (more MAU, concurrent load, larger datasets, FastCache, Server Sync) and support levels rather than unlocking core features. Connecting data sources incurs no cost — there are no per-connector fees and no ETL requirement. Additional factors for buyers: annual billing provides a 20% discount; every plan includes a 7-day trial with no credit card required; discounts are available for nonprofits, education, government, and agencies/resellers; and for teams preferring to avoid subscriptions, a self-hosted perpetual license is available from $4,995, with the first year of upgrades and priority support included.—
    More Pricing Information
    Community Pulse
    DashboardFoxLogi Symphony
    Considered Both Products
    5000fish
    No answer on this topic
    insightsoftware
    No answer on this topic
    Key User Insights
    Would buy again
    No answers on this topic
    100%
    Would buy again
    6 Answers
    Delivers good value for the price
    No answers on this topic
    100%
    Delivers good value for the price
    6 Answers
    Happy with the feature set
    No answers on this topic
    100%
    Happy with the feature set
    6 Answers
    Lived up to sales and marketing promises
    No answers on this topic
    100%
    Lived up to sales and marketing promises
    6 Answers
    Implementation went as expected
    No answers on this topic
    100%
    Implementation went as expected
    6 Answers
    Features
    DashboardFoxLogi Symphony
    BI Standard Reporting
    Comparison of BI Standard Reporting features of DashboardFox and Logi Symphony
    Feature
    DashboardFox
    -
    Ratings
    Logi Symphony
    8.4
    51 Ratings
    3% above category average
    Pixel Perfect reports00 Ratings8.443 Ratings
    Customizable dashboards00 Ratings8.651 Ratings
    Report Formatting Templates00 Ratings8.139 Ratings
    Ad-hoc Reporting
    Comparison of Ad-hoc Reporting features of DashboardFox and Logi Symphony
    Feature
    DashboardFox
    -
    Ratings
    Logi Symphony
    8.1
    51 Ratings
    1% above category average
    Drill-down analysis00 Ratings7.951 Ratings
    Formatting capabilities00 Ratings8.250 Ratings
    Integration with R or other statistical packages00 Ratings7.633 Ratings
    Report sharing and collaboration00 Ratings8.645 Ratings
    Report Output and Scheduling
    Comparison of Report Output and Scheduling features of DashboardFox and Logi Symphony
    Feature
    DashboardFox
    -
    Ratings
    Logi Symphony
    7.9
    49 Ratings
    4% below category average
    Publish to Web00 Ratings8.442 Ratings
    Publish to PDF00 Ratings7.845 Ratings
    Report Versioning00 Ratings7.838 Ratings
    Report Delivery Scheduling00 Ratings8.337 Ratings
    Delivery to Remote Servers00 Ratings7.23 Ratings
    Data Discovery and Visualization
    Comparison of Data Discovery and Visualization features of DashboardFox and Logi Symphony
    Feature
    DashboardFox
    -
    Ratings
    Logi Symphony
    7.8
    49 Ratings
    3% below category average
    Pre-built visualization formats (heatmaps, scatter plots etc.)00 Ratings8.148 Ratings
    Location Analytics / Geographic Visualization00 Ratings7.941 Ratings
    Predictive Analytics00 Ratings7.432 Ratings
    Access Control and Security
    Comparison of Access Control and Security features of DashboardFox and Logi Symphony
    Feature
    DashboardFox
    -
    Ratings
    Logi Symphony
    8.2
    49 Ratings
    4% below category average
    Multi-User Support (named login)00 Ratings8.648 Ratings
    Role-Based Security Model00 Ratings8.045 Ratings
    Multiple Access Permission Levels (Create, Read, Delete)00 Ratings8.246 Ratings
    Single Sign-On (SSO)00 Ratings8.25 Ratings
    Mobile Capabilities
    Comparison of Mobile Capabilities features of DashboardFox and Logi Symphony
    Feature
    DashboardFox
    -
    Ratings
    Logi Symphony
    8.2
    45 Ratings
    6% above category average
    Responsive Design for Web Access00 Ratings8.344 Ratings
    Dashboard / Report / Visualization Interactivity on Mobile00 Ratings8.140 Ratings
    Application Program Interfaces (APIs) / Embedding
    Comparison of Application Program Interfaces (APIs) / Embedding features of DashboardFox and Logi Symphony
    Feature
    DashboardFox
    -
    Ratings
    Logi Symphony
    7.8
    7 Ratings
    1% above category average
    REST API00 Ratings8.25 Ratings
    Javascript API00 Ratings8.66 Ratings
    iFrames00 Ratings7.05 Ratings
    Themeable User Interface (UI)00 Ratings7.76 Ratings
    Customizable Platform (Open Source)00 Ratings7.52 Ratings
    Best Alternatives
    DashboardFoxLogi Symphony
    Small Businesses
    Cyfe
    Score4 out of 10
    Cyfe
    Score4 out of 10
    Medium-sized Companies
    Zendesk Explore
    Score8.1 out of 10
    Zendesk Explore
    Score8.1 out of 10
    Enterprises
    Sisense
    Score6.7 out of 10
    Sisense
    Score6.7 out of 10
    All AlternativesView all alternativesView all alternatives
    User Ratings
    DashboardFoxLogi Symphony
    Likelihood to Recommend
    -
    (0 ratings)
    8.3
    (52 ratings)
    Likelihood to Renew
    -
    (0 ratings)
    7.0
    (1 ratings)
    Usability
    -
    (0 ratings)
    8.0
    (6 ratings)
    Support Rating
    -
    (0 ratings)
    8.8
    (11 ratings)
    Implementation Rating
    -
    (0 ratings)
    7.3
    (1 ratings)
    Data Sharing and Collaboration
    -
    (0 ratings)
    8.2
    (45 ratings)
    Data Sources
    -
    (0 ratings)
    8.2
    (46 ratings)
    User Testimonials
    DashboardFoxLogi Symphony
    Likelihood to Recommend
    5000fish
    No answers on this topic
    insightsoftware
    For all the scenarios I have so far worked on or I am currently working on, Dundas BI has proved to be more than adequate and apt to handle all of those. It is a very easy-to-use tool with quick shortcuts enabling you to prepare ad-hoc reports or dashboards in a matter of minutes.
    Incentivized
    Read full review
    Pros
    5000fish
    No answers on this topic
    insightsoftware
    • Project organization from Development to Production, you get a production and development license but I think the best way to do it is with DEV and Prod project in the Production box. Use the development box for testing updates and really crazy things. With the Dev and Prod projects on the same box, you just publish from Dev to Prod and you are done. Users only have access to the Prod projects so no one can mess up what you are working on.
    • Security - If you have a hierarchy (subsidiaries, divisions, department, teams) and you want each group to see only their data, then Security hierarchies are for you!
    • Dependent filters! What's this you ask? Here is an example of how it can be used, in your company you have departments and who works for what department is in your database. You make a dashboard that has a department filter (only show these departments), a managers filter, and employee filter. Not every manager or employee is in multiple departments usually only one. With dependent filters you can say that the manager and employee filter are dependent on what is selected in the departments filter so when you go to filter them they only show the managers or employees that are part of that department, and you can even it do so employees are not only dependent on department but on manager as well. Then it gets even better as it can be done in reverse as well so when you select a manager then go to the department it only shows the departments he works for (there are better situations where this is more useful).
    • It is scriptable! From calculate columns, null replacements, button actions, load actions, hover over events there a way to do what you want.
    • They are constantly improving and listens to your suggestions.
    Incentivized
    Read full review
    Cons
    5000fish
    No answers on this topic
    insightsoftware
    • Not too many cons for how we use the application. It really is easy and powerful. Very powerful.
    • Licensing is one thing that could be looked into. It is simple, but a little confusing. For example, if I get a license today, but a new release comes out tomorrow, it seems that the license doesn't work with the new release. Maybe that is by design, but it would be nice to clearly understand.
    Read full review
    Usability
    5000fish
    No answers on this topic
    insightsoftware
    We are still in the implementation phase, but so far we are finding it to be easy to use and learn. The eLearning courses that they have made available for free, as well as User Forums and other training videos have made even difficult concepts easier to understand.
    Read full review
    Support Rating
    5000fish
    No answers on this topic
    insightsoftware
    We have bi-weekly calls with our Success Manager, as well as access to support as needed. Any question that I have had, multiple people have been willing and able to jump on a call to talk me through it, or send an email with the solution
    Read full review
    Implementation Rating
    5000fish
    No answers on this topic
    insightsoftware
    Providing that you have the client's needs well known, creating BI content using Dundas BI is a walk in the park!
    Read full review
    Alternatives Considered
    5000fish
    No answers on this topic
    insightsoftware
    Per dollar spent, it offers the widest range of features of the tools that we evaluated. It offers lots of options for how to configure your environment, though they are not always intuitive to figure out. Having an ETL layer was a must have for us, as well as the ability to host to secure HIPAA compliance. It is not a replacement for ad hoc reporting, but does a great job of creating parameterized reports and dashboards that look great.
    Incentivized
    Read full review
    Return on Investment
    5000fish
    No answers on this topic
    insightsoftware
    • Coming from an SQL based standard delivery model, Dundas BI has provided a fantastic rate of ROI.
    • The preparation and delivery time has reduced from weeks to just a few hours.
    Incentivized
    Read full review
    ScreenShots

    DashboardFox Screenshots

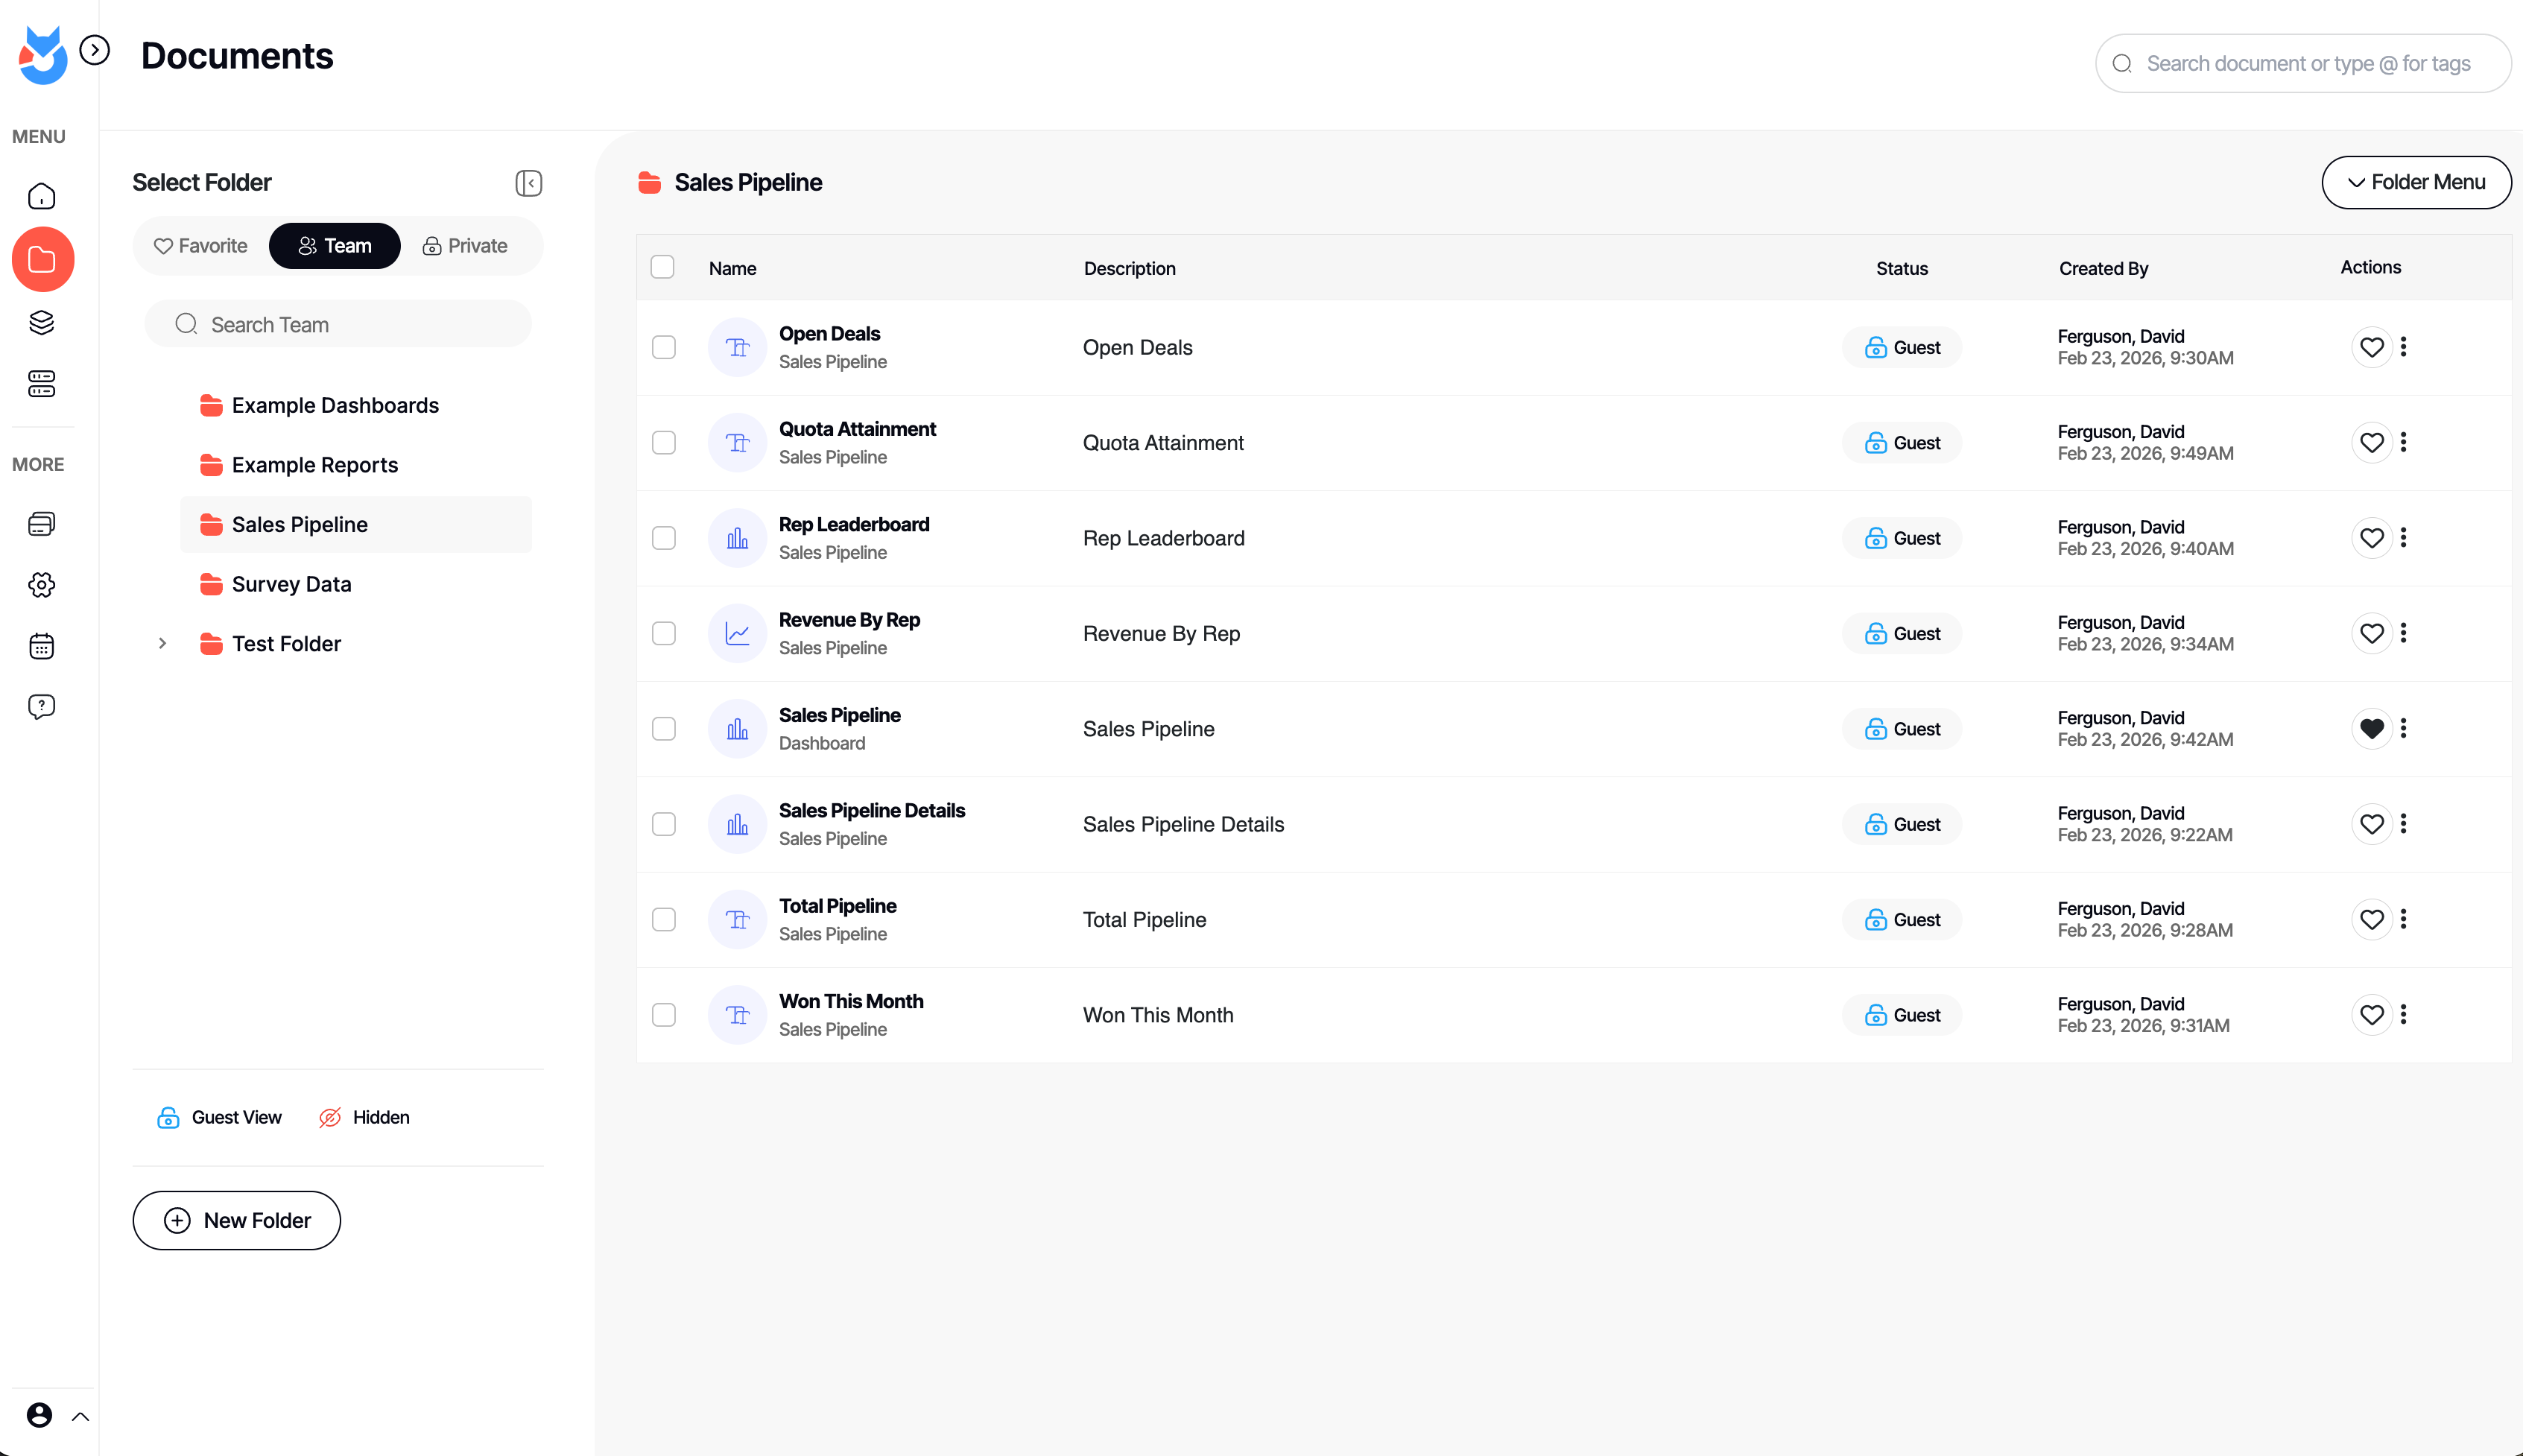
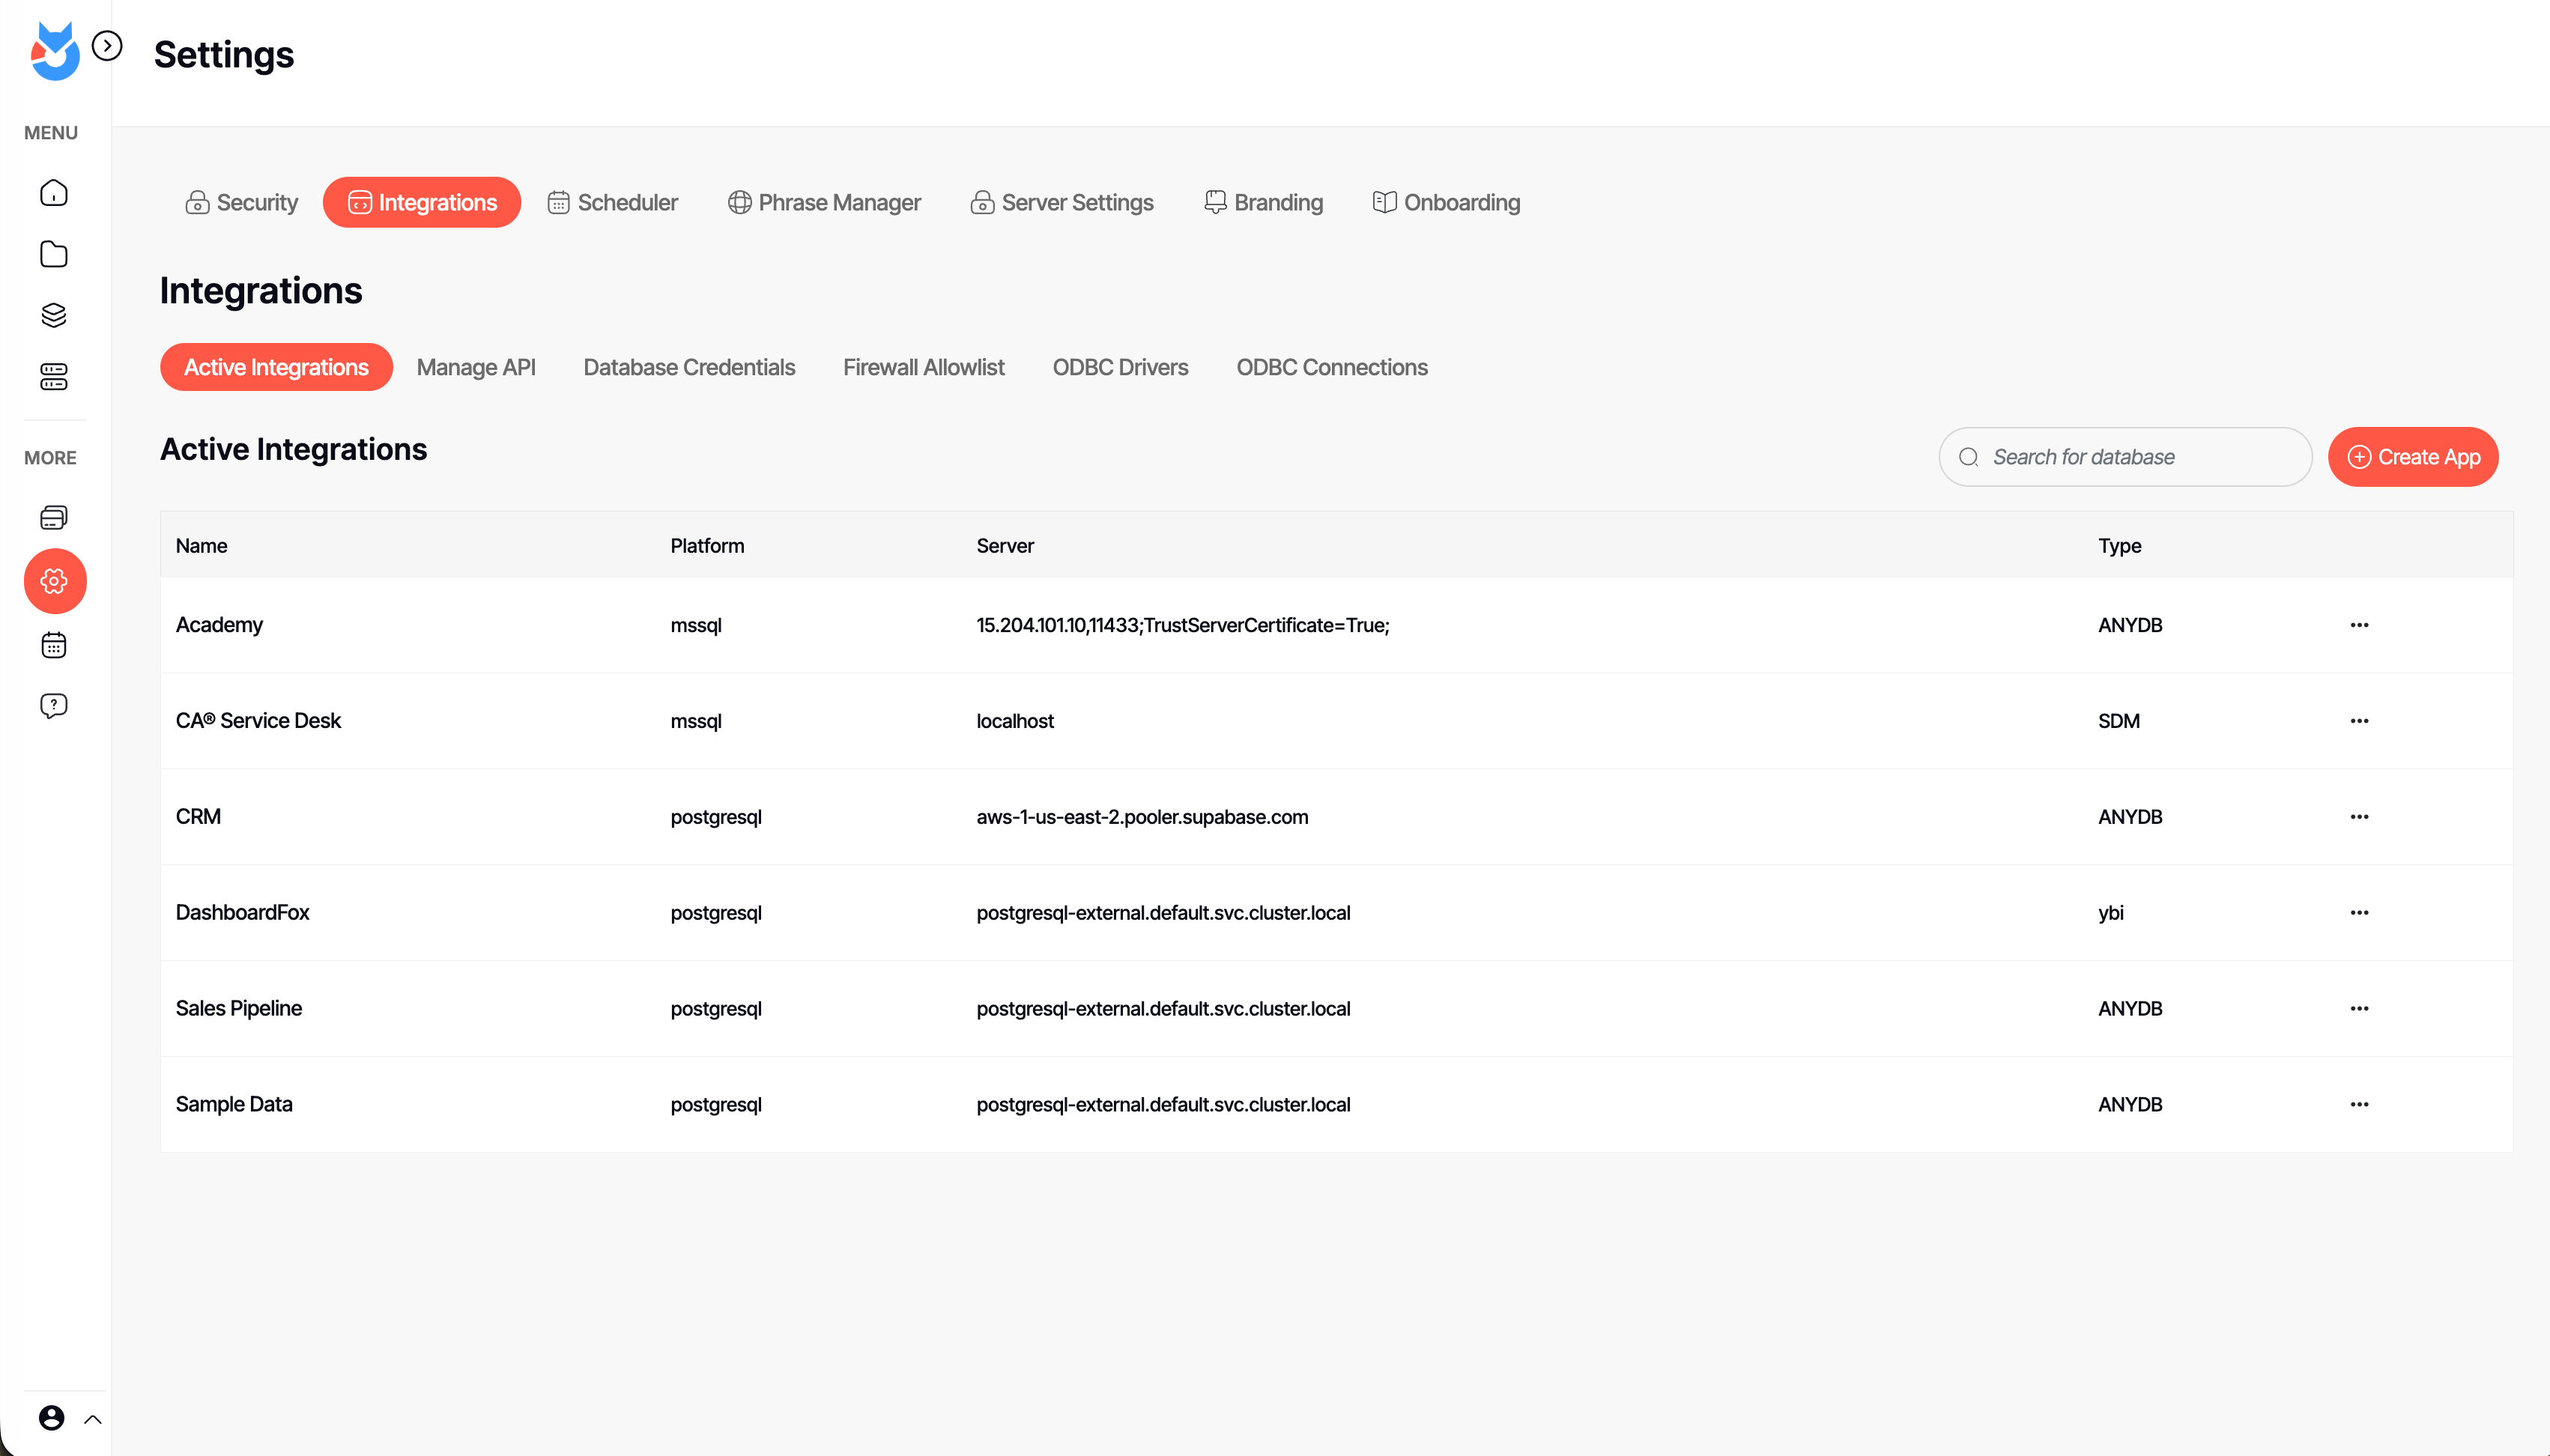
    Screenshot of an interactive DashboardFox sales pipeline dashboard with KPI tiles, a revenue-by-rep chart, and a rep leaderboard. Business users filter by region, industry, or fiscal year and save their own views — self-service analytics with no SQL required.Screenshot of the Documents library in DashboardFox, where teams organize dashboards and reports into Team, Private, and Favorite folders. Share them with colleagues or clients, control guest access per item, and find any report fast with search and tags.Screenshot of DashboardFox's report Composer: pick fields, apply formulas and sorting, and preview the result live as a chart. Build dashboards and reports across 20+ visualizations without writing code, then save and share them with your team or clients.Screenshot of the App Builder in DashboardFox, where admins connect a data source and choose the exact tables and fields users can report on. Set up governed self-service reporting once, so business users only ever see the data they're allowed to.Screenshot of DashboardFox admin settings: manage data-source integrations, ODBC drivers, API access, scheduling, branding, and security in one place. Connect SQL Server, PostgreSQL, and more with no ETL, and white-label the experience for your clients.Screenshot of a single DashboardFox report shown as a color-coded calendar heatmap, flagging good, watch, and bad days at a glance. Open any report from the library, refresh or schedule it, and deliver it branded to your team or clients.

    Logi Symphony Screenshots

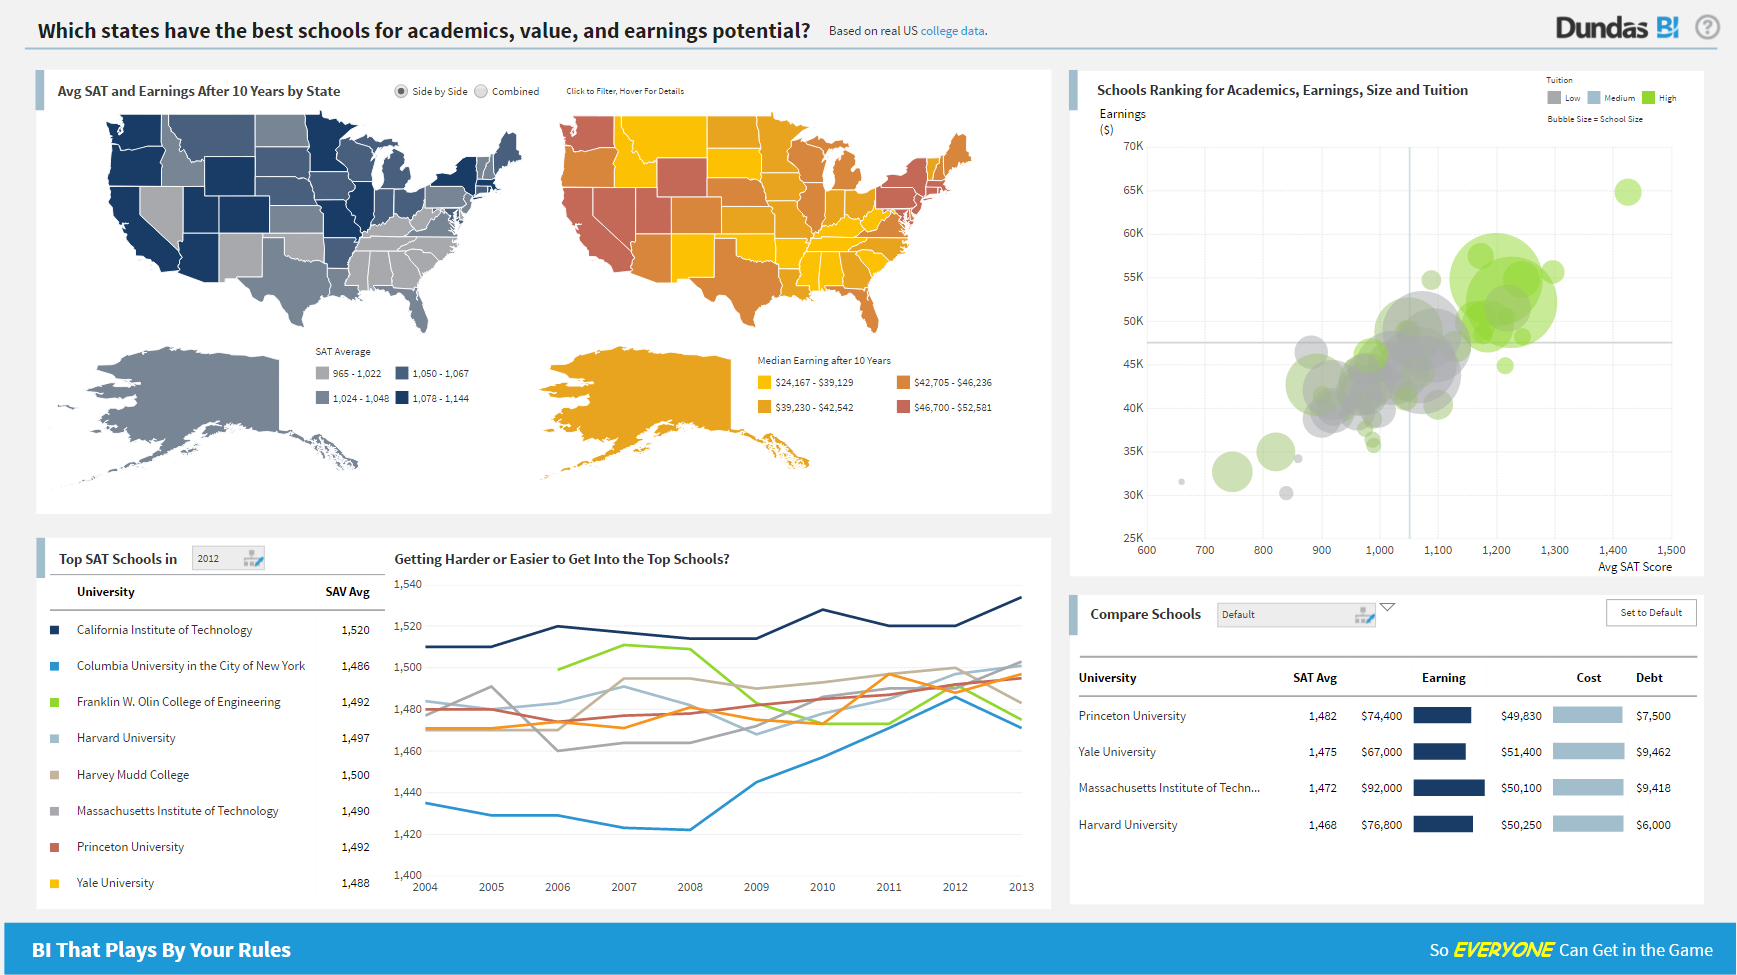
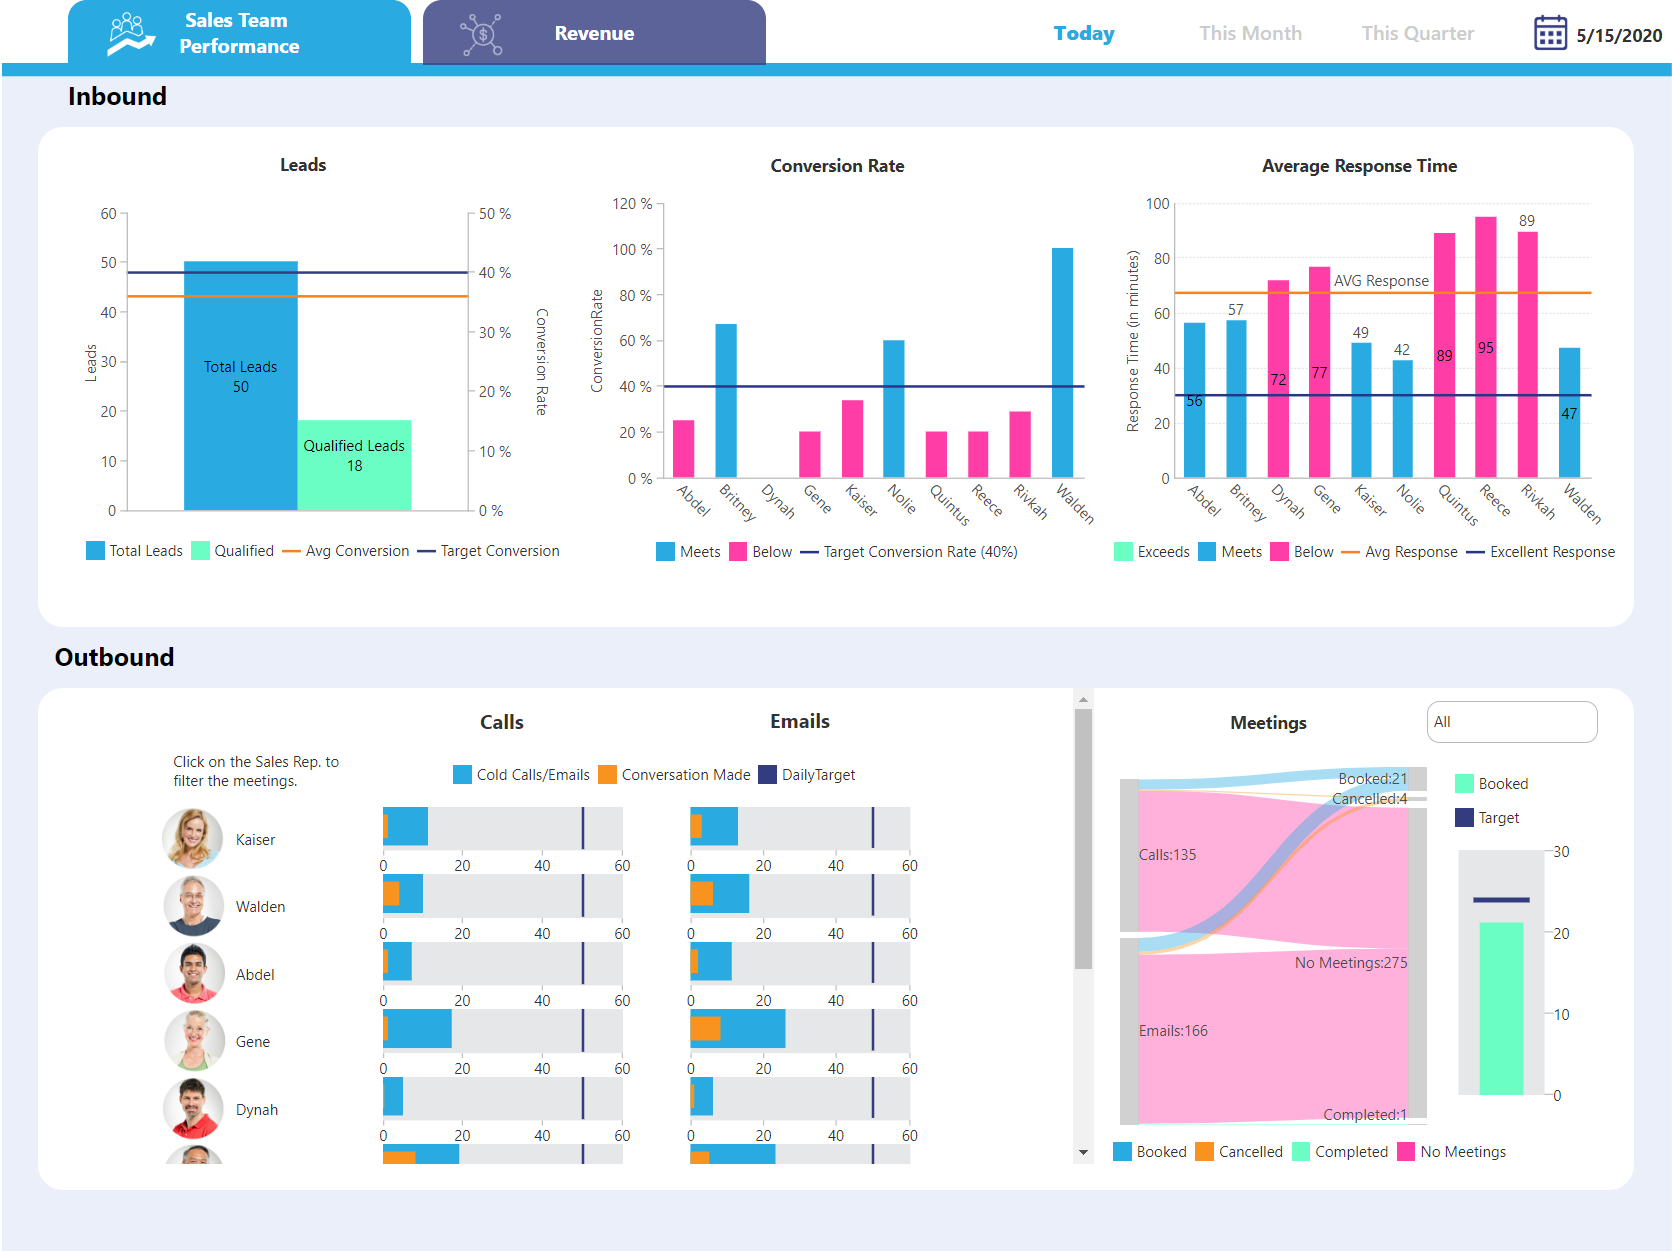
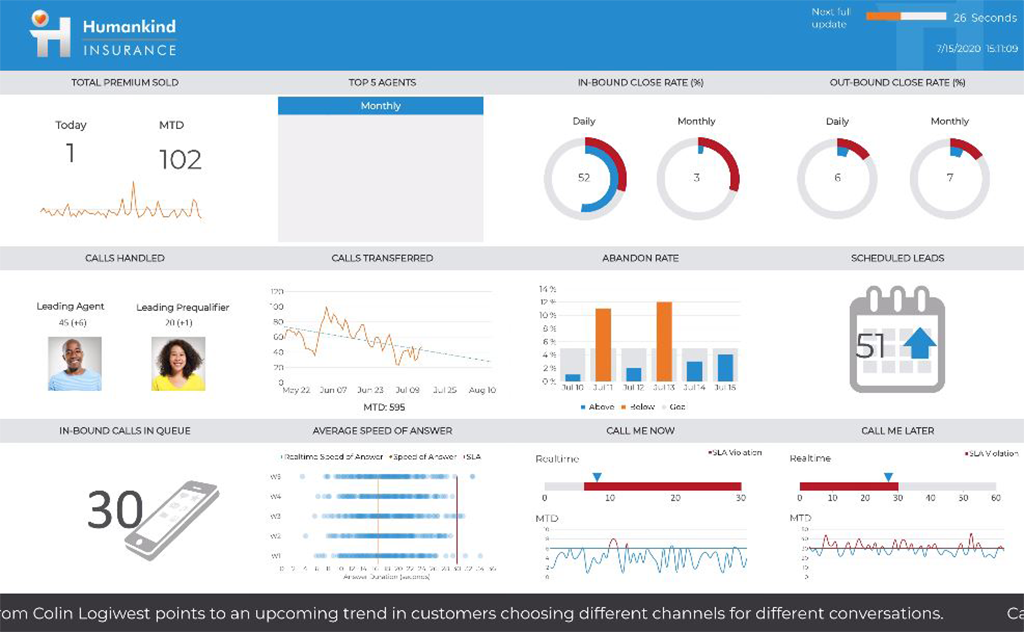
    Screenshot of Dundas BI Dashboard Sample - EducationScreenshot of Dundas BI Dashboard Sample - Sales Team PerformanceScreenshot of Dundas BI Dahsboard Sample - Sales PerformanceScreenshot of Dundas BI Dashboard Sample - InsuranceScreenshot of Dundas BI Dashboard Sample - EmbeddedScreenshot of Dundas BI Dashboard Sample - Sales and Marketing