Chose Datadog
Its the Enterprise level decision, definitely usability and features perspective Datadog is much more advanced.
| Product | Rating | Most Used By | Product Summary | Starting Price |
|---|---|---|---|---|
 Datadog | N/A | Datadog is a monitoring service for IT, Dev and Ops teams who write and run applications at scale, and want to turn the massive amounts of data produced by their apps, tools and services into actionable insight. | $1.27 per month (billed annually) per host | |
 ManageEngine NetFlow Analyzer | N/A | NetFlow Analyzer is a complete bandwidth monitoring tool that utilizes flow technology to monitor and analyze network bandwidth usage. It helps users identify and avoid bandwidth delays and bottlenecks with customized reports, and set threshold-based email and SMS alerts to help understand the severity of an issue. This analytics tool detects, diagnoses, and troubleshoots network anomalies and zero-day intrusions, and plans future bandwidth needs based on application growth to… | N/A |
| Datadog | ManageEngine NetFlow Analyzer | |||||||||||||||
|---|---|---|---|---|---|---|---|---|---|---|---|---|---|---|---|---|
| Editions & Modules |
| No answers on this topic | ||||||||||||||
| Offerings |
| |||||||||||||||
| Entry-level Setup Fee | Optional | $595 per installation | ||||||||||||||
| Additional Details | Discount available for annual pricing. Multi-Year/Volume discounts available (500+ hosts/mo). | — | ||||||||||||||
| More Pricing Information | ||||||||||||||||
| Datadog | ManageEngine NetFlow Analyzer | |
|---|---|---|
| Considered Both Products |  Datadog  Jeffrey van Santen Sr SWE Chose Datadog Datadog is a more complex but complete solution than any of the other Log Aggregation, monitoring, or general observabilty tools that we have trialed. I found it easier to setup following useful and up-to-date documentation provided directly by Datadog instead of scattered …  Vinit Parakh Sr. DevOps Engineer Chose Datadog First think first - it's easy to use, and very easy to implement in any infrastructure. It provides a custom dashboard and monitors. I’ve used or evaluated Grafana, Prometheus, Amazon CloudWatch, and Dynatrace, and each tool has strong capabilities. Prometheus + Grafana provide …  Joe Cardali Head of Engineering Chose Datadog Much more modern and advanced  Fernando Battistella DevOps Engineer Chose Datadog ease of use and implementation, other than new relic (which I think is terrible in every possible way), the other two support opentelemetry better, have more manageable costs and comparable basic services, but they do not have the breadt of services dd does. |  ManageEngine NetFlow Analyzer |
| Datadog | ManageEngine NetFlow Analyzer | |
|---|---|---|
| Small Businesses |  Amazon CloudWatch Score 7.7 out of 10 |  Auvik Score 8.7 out of 10 |
| Medium-sized Companies |  ManageEngine Site24x7 Score 10.0 out of 10 |  SolarWinds NetFlow Traffic Analyzer (NTA) Score 9.3 out of 10 |
| Enterprises | ManageEngine Site24x7 Score 10.0 out of 10 | SolarWinds NetFlow Traffic Analyzer (NTA) Score 9.3 out of 10 |
| All Alternatives | View all alternatives | View all alternatives |
| Datadog | ManageEngine NetFlow Analyzer | |
|---|---|---|
| Likelihood to Recommend | 8.9 (0 ratings) | 9.8 (0 ratings) |
| Likelihood to Renew | 1.0 (0 ratings) | - (0 ratings) |
| Usability | 8.7 (0 ratings) | 9.6 (0 ratings) |
| Support Rating | 5.0 (0 ratings) | 10.0 (0 ratings) |
| Implementation Rating | 1.0 (0 ratings) | - (0 ratings) |
| Datadog | ManageEngine NetFlow Analyzer | |
|---|---|---|
| Likelihood to Recommend |
|
|
| Pros |
 Aman Makwana DevOps Engineer |
|
| Cons |
|
|
| Likelihood to Renew |
| No answers on this topic |
| Usability |
|
|
| Support Rating |
|
|
| Implementation Rating |
| No answers on this topic |
| Alternatives Considered |
Jeffrey van Santen Sr SWE |
|
| Return on Investment |
|
|
| ScreenShots | Datadog Screenshots      | ManageEngine NetFlow Analyzer Screenshots  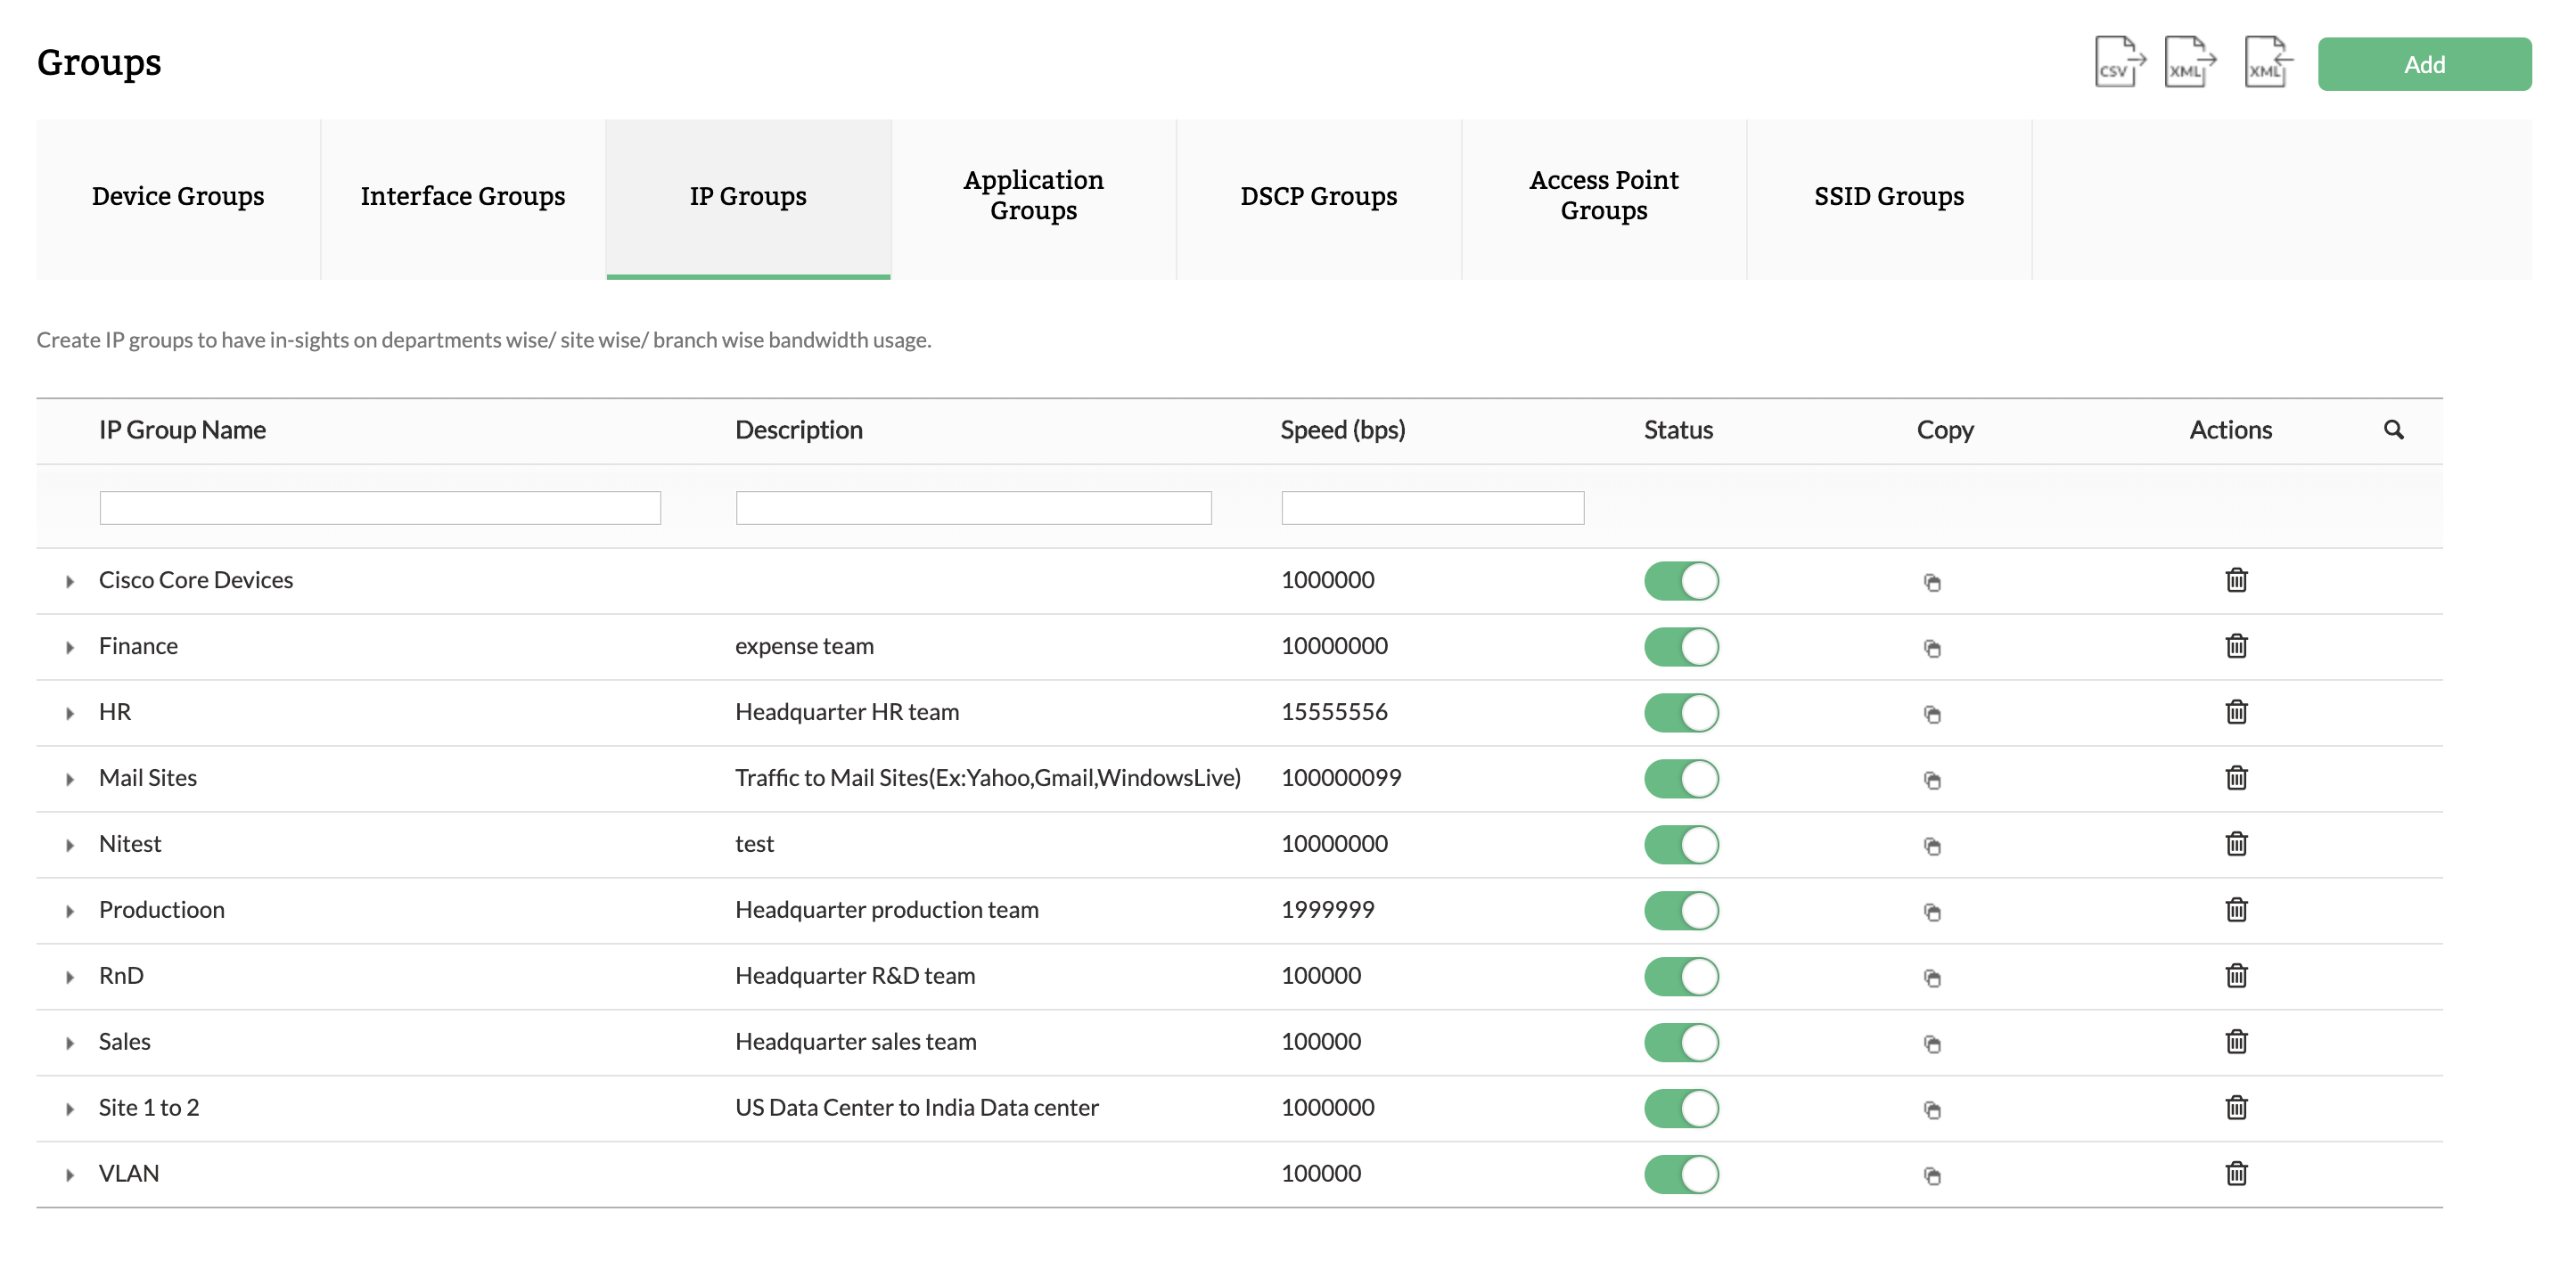  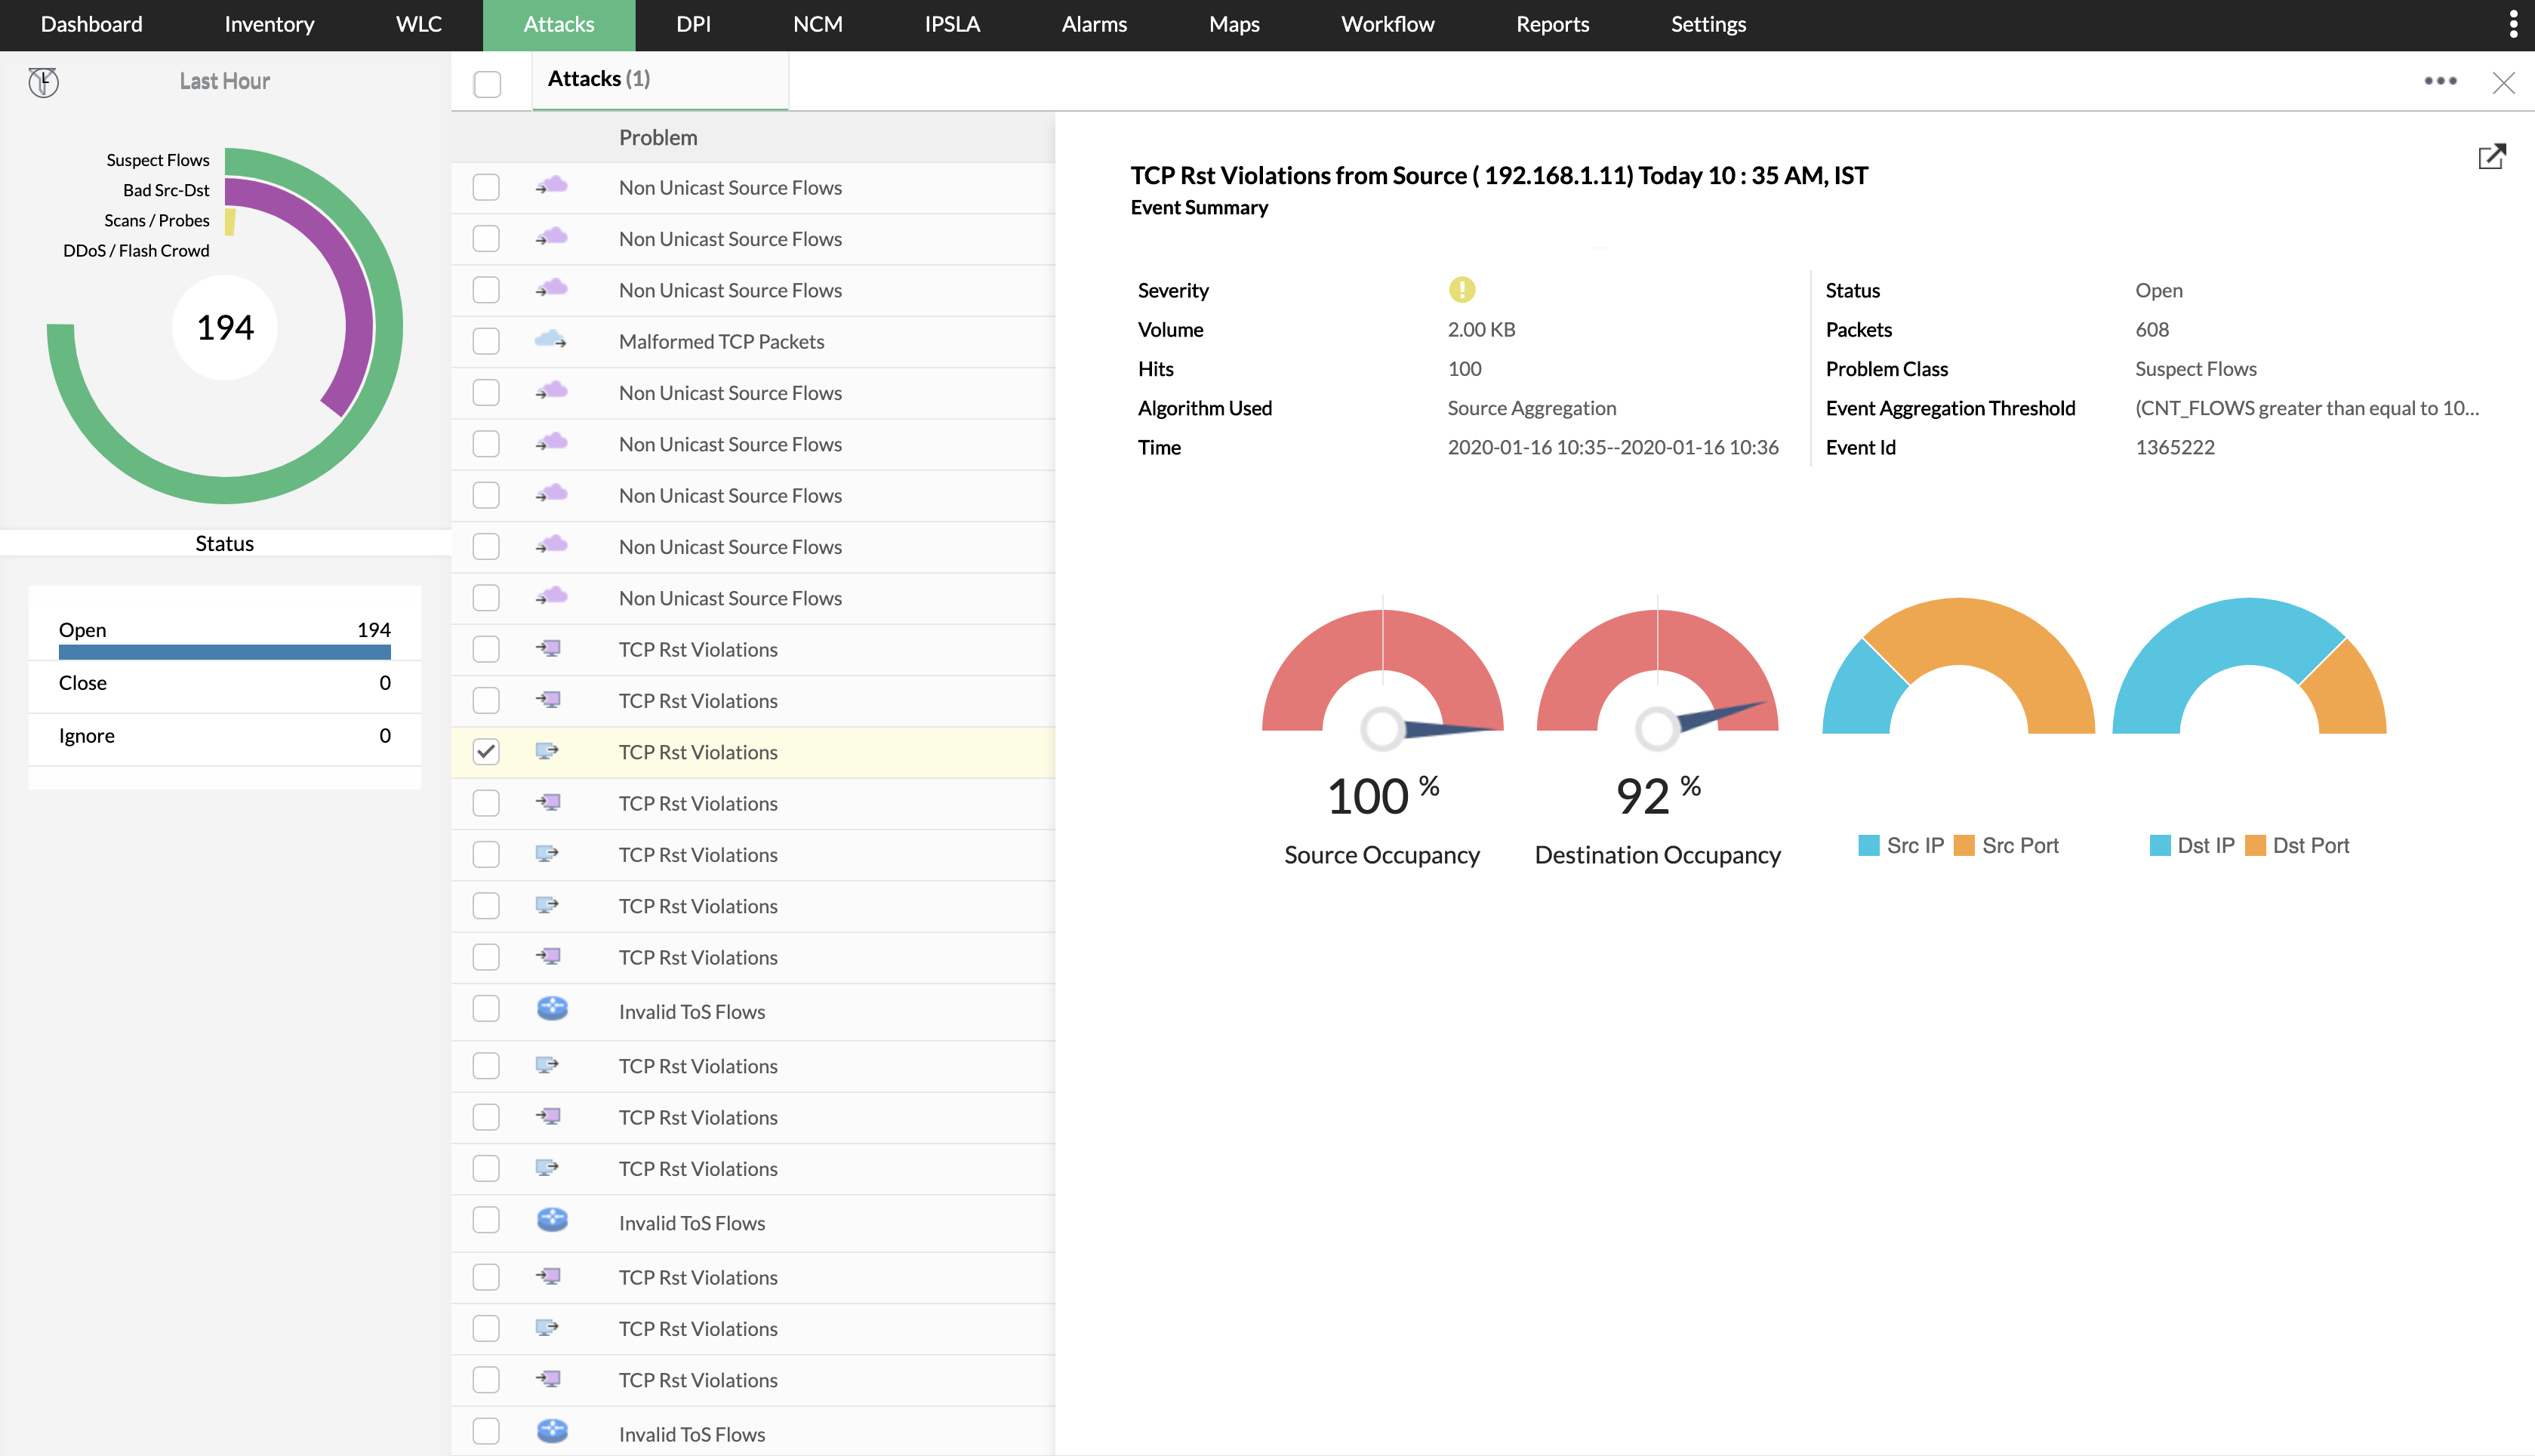  |