The DataRobot AI Platform is presented as a solution that accelerates and democratizes data science by automating the end-to-end journey from data to value and allows users to deploy AI applications at scale. DataRobot provides a centrally governed platform that gives users AI to drive business outcomes, that is available on the user's cloud platform-of-choice, on-premise, or as a fully-managed service. The solutions include tools providing data preparation enabling users to explore and…
$0
Microsoft BI (MSBI)
Score 8.7 out of 10
N/A
Microsoft BI is a business intelligence product used for data analysis and generating reports on server-based data. It features unlimited data analysis capacity with its reporting engine, SQL Server Reporting Services alongside ETL, master data management, and data cleansing.
$14
per month per user
QlikView
Score 8.2 out of 10
N/A
QlikView® is Qlik®’s original BI offering designed primarily for shared business intelligence reports and data visualizations. It offers guided exploration and discovery, collaborative analytics for sharing insight, and agile development and deployment.
N/A
Pricing
DataRobot
Microsoft BI (MSBI)
QlikView
Editions & Modules
No answers on this topic
Power BI Pro
$14
per month per user
Power BI Premium
$24
per month per user
QlikView
Custom
per user
Offerings
Pricing Offerings
DataRobot
Microsoft BI (MSBI)
QlikView
Free Trial
Yes
No
Yes
Free/Freemium Version
Yes
Yes
No
Premium Consulting/Integration Services
Yes
No
Yes
Entry-level Setup Fee
No setup fee
No setup fee
Optional
Additional Details
—
—
On an perpetual license basis, based on server plus number of users.
Contact vendor for pricing.
Specific data displays are some of the strongest aspects of Microsoft BI when compared to alternate programs. It also does a superior job in compatibility with many programs, especially those from Microsoft. Since my company primarily uses Office 365 and other Microsoft …
The software stacks [well] because it has more graphics resolution and the colors are fresh and actualized. On the other hand, there is the Microsoft family software and this is an advantage. Microsoft has a lot of users around the world and it's like everyone knows how to do …
One of the main reasons Microsoft BI was chosen by our company is because it is a reliable program. We tried different programs in the past (and currently also use other ones for certain reporting and analysis needs) but Microsoft BI was the least buggy out of our top choices.
I was forced into QV by QuickBooks -- I did not have the opportunity to evaluate it specifically against other packages. I have, however, seen Microsoft BI and BIRST --- both of which seem much more expensive (and perhaps complex) than QlikView. But I'm conjecturing a bit here.
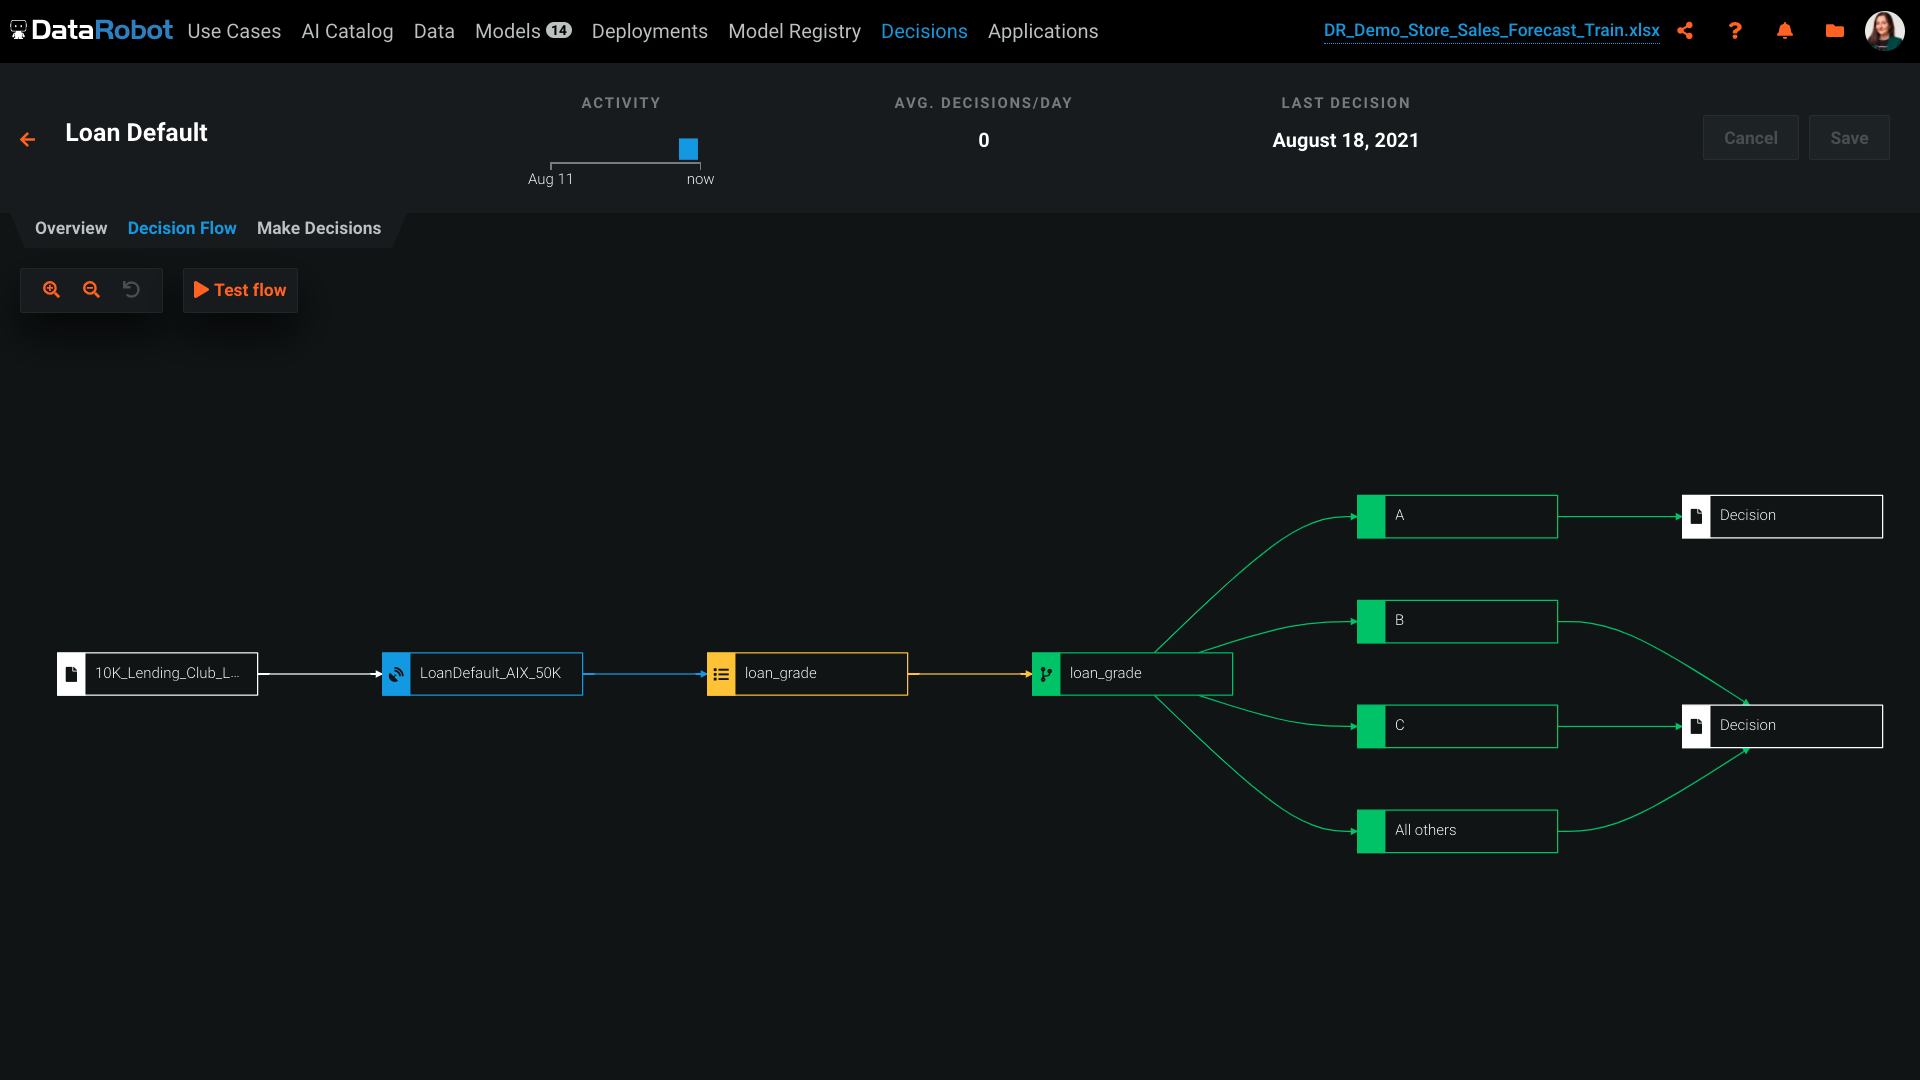
DataRobot can be used for risk assessment, such as predicting the likelihood of loan default. It can handle both classification and regression tasks effectively. It relies on historical data for model training. If you have limited historical data or the data quality is poor, it may not be the best choice as it requires a sufficient amount of high-quality data for accurate model building.
Microsoft BI has a lot of features and is a very powerful tool, especially if you have folks on your team that know how to utilize all of its capabilities. To truly unlock all that it can do, it does require people to have a deep understanding of its capabilities. That's where the software really shines. If you are looking for a simpler, more basic reporting tool, there are other programs available that do not require such a steep learning curve.
Sales data validations have helped manage our justifications in the past, especially with regard to new product development and new business introduction. It has also been helpful in identifying trends with business impact and direction specific to quarter and monthly sales from ERP data as well as decisions to purchase equipment of staffing based on run rates and product demand.
One thing that can get out of hand is data output - if you aren't careful in your query, you may be overloaded with data dumps and drown in the amount of info you have to filter through. This is a user caution, not a comment on the software itself.
DataRobot helps, with algorithms, to analyze and decipher numerous machine-learning techniques in order to provide models to assist in company-wide decision making.
Our DataRobot program puts on an "even playing field" the strength of auto-machine learning and allows us to make decisions in an extremely timely manner. The speed is consistent without being offset by errors or false-negatives.
It encompasses many desired techniques that help companies in general, to reconfigure in to artificial intelligence driven firms, with little to no inconvenience.
The platform itself is very complicated. It probably can't function well without being complicated, but there is a big training curve to get over before you can effectively use it. Even I'm not sure if I'm effectively using it now.
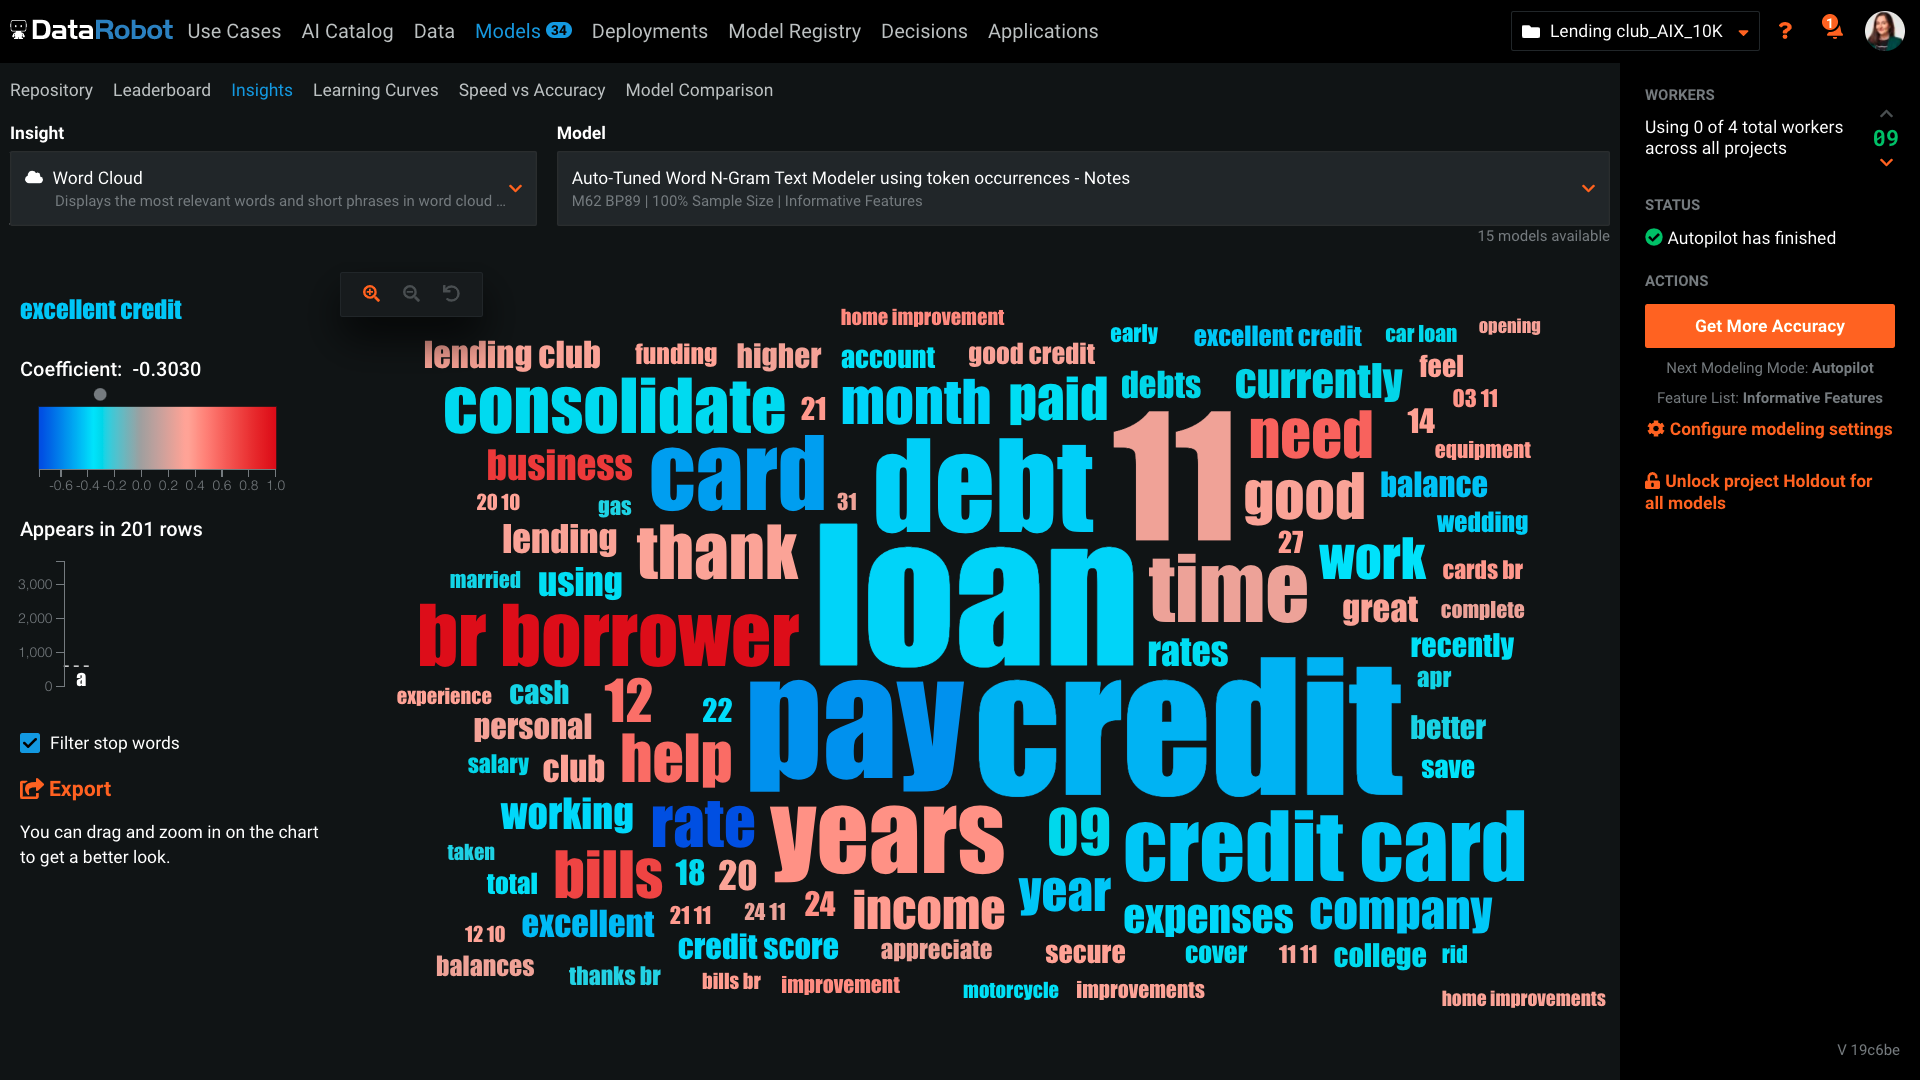
The suggested model DataRobot deploys often not the best model for our purposes. We've had to do a lot of testing to make sure what model is the best. For regressive models, DataRobot does give you a MASE score but, for some reason, often doesn't suggest the best MASE score model.
The software will give you errors if output files are not entered correctly but will not exactly tell you how to fix them. Perhaps that is complicated, but being able to download a template with your data for an output file in the correct format would be nice.
We found that QlikView can be a bit slow in supporting some forms of encryption. It is web-based and we needed to upgrade all of our server to not support the older SSL and TLS 1 protocols, only support TLS 1.2 and TLS 1.3. However, QlikView could not run with TLS 1.2 and TLS 1.3. We had to wait over six months to get a version that would handle the newer TLS versions.
There are so many options with QlikView that you can get lost when developing a visualization. There are still items I have not yet figured out, such as labeling a graph with the name of a selected detail item.
QlikView works by pulling the data it is going to use for visualization into its database. I am a security reviewer and I need to make certain that PII and PHI is not pulled by QlikView for a visualization, otherwise this could become a reportable indecent.
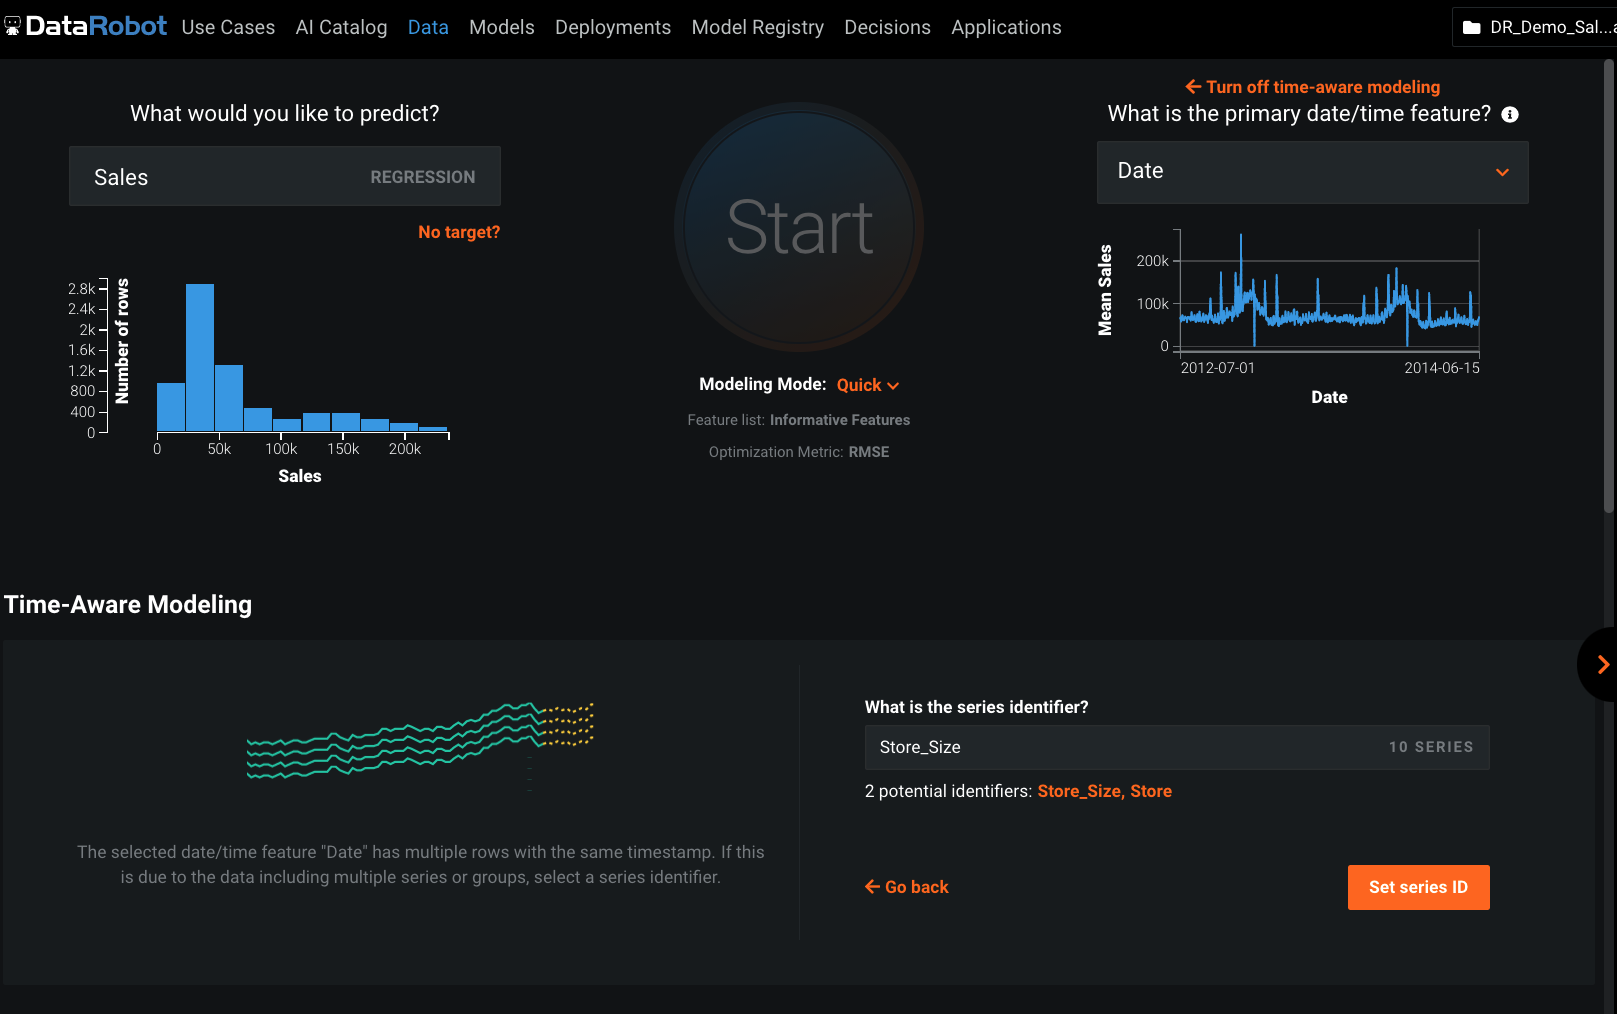
DataRobot presents a machine-learning platform designed by data scientists from an array of backgrounds, to construct and develop precise predictive modeling in a fraction of the time previously taken. The tech invloved addresses the critical shortage of data scientists by changing the speed and economics of predictive analytics. DataRobot utilizes parallel processing to evaluate models in R, Python, Spark MLlib, H2O and other open source databases. It searches for possible permutations and algorithms, features, transformation, processes, steps and tuning to yield the best models for the dataset and predictive goal.
Microsoft BI is fundamental to our suite of BI applications. That being said, Northcraft Analytics is focused on delighting our customers, so if the underlying factors of our decision change, we would choose to re-write our BI applications on a different stack. Luckily, mathematics are the fundamental IP of our technology... and is portable across all BI platforms for the foreseeable future.
Ease of use, ability to load from pretty much any data source. today I created an application that loaded time sheets from excel that are not in a table format. With Qlik's "enable transformation steps" I was able to automate loads of multiple spreadsheets and multiple tabs easily. Could not do that with any other tool.
The Microsoft BI tools have great usability for both developers and end users alike. For developers familiar with Visual Studio, there is little learning curve. For those not, the single Visual Studio IDE means not having to learn separate tools for each component. For end-users, the web interface for SSRS is simple to navigate with intuitive controls. For ad-hoc analysis, Excel can connect directly to SSAS and provide a pivot table like experience which is familiar to many users. For database development, there is beginning to be some confusion, as there are now three tool choices (VS, SSMS, Azure Data Studio) for developers. I would like to see Azure Data Studio become the superset of SSMS and eventually supplant it.
QlikView is very easy to implement. The installation is very straight forward. QlikView has several different data connectors that can connect to different data sources very smoothly. The user interface to build the reports is very easy to understand. This helps to have a smaller learning curve. Something very helpful is that QlikView is a browser application for the end users. So, you don't need to install any applications on the user's computer.
SQL Server Reporting Services (SSRS) can drag at times. We created two report servers and placed them under an F5 load balancer. This configuration has worked well. We have seen sluggish performance at times due to the Windows Firewall.
As I am writing this report I am participating with Datarobot Engineers in an complex environment and we have their whole support. We are in Mexico and is not common to have this commitment from companies without expensive contract services. Installing is on premise and the client does not want us to take control and they, the client, is also limited because of internal IT regulations ,,, soo we are just doing magic and everybody is committed.
MSBI natively has a site that allows you to vote on user enhancements and bug fixes. This allows the largest nagging issues to float to the top and the development team can prioritize accordingly. As mentioned earlier, the large community base of MSBI developers assist technical resources in handling technical questions.
My experience with the Qlik support team has been somewhat limited, but every interaction I have had with them has been very professional and I received a response quickly. Typically if there is a technical issue, our IT team will follow up. My inquiries are specific to product functionality, and Qlik has been very helpful in clarifying any questions I might have.
My team attended, but I cannot myself rate, but I think it was good as they've successfully launched a training program at our company themselves for users. It was 3-4 day training.
I have used on-line training from Microsoft and from Pragmatic Works. I would recommend Pragmatic Works as the best way to get up to speed quickly, and then use the Microsoft on-line training to deep dive into specific features that you need to get depth with.
Training was as expected. The demo environments tend to be more fully featured that our own environment, but the training was clear and well delivered.
We are a consulting firm and as such our best resources are always billing on client projects. Our internal implementation has weaknesses, but that's true for any company like ours. My rating is based on the product's ease of implementation.
"Implementation" can mean a few things... so I'm not sure that this is the answer you want.... but here it goes: To me, implementation means: "Is the user interface intuitive and can I produce meaningful reports with ease?" On that score, I'd say YES. The amount of training required was minimal and the results were powerful. The desktop implementation is a simple, "blank" interface just waiting for your creativity. The pre-populated templates give you a reasonable start to any project -- and a good set of objects to "play around with" if you're just getting started. Finally, note that the "implementation" I used was baked into QuickBooks 2016 Enterprise -- called "Advanced Reporting"..... That integration makes it ultra useful and simple.
I've done machine learning through python before, however having to code and test each model individually was very time consuming and required a lot of expertise. The data Robot approach, is an excellent way of getting to a well placed starting point. You can then pick up the model from there and fine tune further if you need.
We have used the built in ConnectWise Manager reports and custom reports. The reports provide static data. PowerBI shows us live data we can drill down into and easily adjust parameters. It's much more useful than a static PDF report.
The only other vendor product that I have worked with that provides a similar experience to Qlikview is Tableau. I would recommend Tableau if your use case is to build a fixed dashboard. You can share reports for free without needing to buy additional licenses. I would recommend Qlikview if your users are looking for a more interactive experience. They can create new objects to represent the data which can't be accomplished as easily in Tableau
As a SaaS provider we see being able to provide self-service BI to our client users as a competitive advantage. In fact the MSSQL enabled BI is a contributing factor to many winning RFPs we have done for prospective client organisations.
However MSSQL BI requires extensive knowledge and skills to design and develop data warehouses & data models as a foundation to support business analysts and users to interrogate data effectively and efficiently. Often times we find having strong in-house MSSQL expertise is a bless.
You can use the free desktop version to do a lot of reporting and analysis work more quickly so the ROI is huge
QlikView is great at finding outliers such as data entry errors
QlikView is great at helping you quickly discover new insights about your business that can prompt you to take action that can immediately affect your cash flow.