Entrinsik Informer vs. Lightning Tools Data Viewer

Overview
ProductRatingMost Used ByProduct SummaryStarting Price
Entrinsik Informer
Score 10.0 out of 10
N/A
Entrinsik Informer is a web-based reporting and business intelligence application popular in the higher education vertical market. It helps organizations transform real-time data into actionable information by delivering ad-hoc reporting, data analysis, and interactive dashboards.N/A
Lightning Tools Data Viewer
Score 9.1 out of 10
Mid-Size Companies (51-1,000 employees)
The Data Viewer provides data visualization in the form of reports or charts that can be created and customized to suit a business's needs. Silos of data exist in most organizations and yet contain valuable insights into how well the organization is performing and where action is needed. Those silos often include Microsoft Excel workbooks, Microsoft SQL Azure databases, On-Premises data sources accessible through OData or Business Connectivity Services and even SharePoint Lists. These data…
$2,200
per year per installation
Pricing
Entrinsik InformerLightning Tools Data Viewer
Editions & Modules
No answers on this topic
Data Viewer OnPrem
$1,000
per year Per installation, 1 x WFE
Data Viewer Online
$2,200
per year per installation
Data Viewer OnPrem Enterprise Edition
POA
per year Per installation, 4+ WFE
Data Viewer Online Enterprise Edition
POA
per year per installation
Offerings
Pricing Offerings
Entrinsik InformerLightning Tools Data Viewer
Free Trial
YesYes
Free/Freemium Version
NoNo
Premium Consulting/Integration Services
YesYes
Entry-level Setup FeeNo setup feeNo setup fee
Additional DetailsPrices stated are minimum per installation for "stock" products. $2.20 per user / year on top of base price. Enterprise editions can be amended to suit business needs if deemed necessary, additional costs incurred and TBD. All packages include free technical support. Free upgrades available to latest versions of tool as they are released. (online version)
More Pricing Information
Community Pulse
Entrinsik InformerLightning Tools Data Viewer
Features
Entrinsik InformerLightning Tools Data Viewer
BI Standard Reporting
Comparison of BI Standard Reporting features of Product A and Product B
Entrinsik Informer
7.3
8 Ratings
11% below category average
Lightning Tools Data Viewer
9.1
1 Ratings
12% above category average
Pixel Perfect reports5.51 Ratings00 Ratings
Customizable dashboards9.17 Ratings9.11 Ratings
Report Formatting Templates7.57 Ratings9.11 Ratings
Ad-hoc Reporting
Comparison of Ad-hoc Reporting features of Product A and Product B
Entrinsik Informer
8.6
11 Ratings
7% above category average
Lightning Tools Data Viewer
8.2
1 Ratings
5% above category average
Drill-down analysis9.19 Ratings6.41 Ratings
Formatting capabilities8.210 Ratings9.11 Ratings
Integration with R or other statistical packages8.21 Ratings00 Ratings
Report sharing and collaboration9.110 Ratings9.11 Ratings
Report Output and Scheduling
Comparison of Report Output and Scheduling features of Product A and Product B
Entrinsik Informer
9.1
11 Ratings
10% above category average
Lightning Tools Data Viewer
-
Ratings
Publish to Web9.14 Ratings00 Ratings
Publish to PDF9.19 Ratings00 Ratings
Report Versioning9.13 Ratings00 Ratings
Report Delivery Scheduling9.17 Ratings00 Ratings
Delivery to Remote Servers9.11 Ratings00 Ratings
Data Discovery and Visualization
Comparison of Data Discovery and Visualization features of Product A and Product B
Entrinsik Informer
7.3
1 Ratings
9% below category average
Lightning Tools Data Viewer
3.6
1 Ratings
73% below category average
Pre-built visualization formats (heatmaps, scatter plots etc.)7.31 Ratings3.61 Ratings
Location Analytics / Geographic Visualization7.31 Ratings00 Ratings
Access Control and Security
Comparison of Access Control and Security features of Product A and Product B
Entrinsik Informer
9.1
11 Ratings
7% above category average
Lightning Tools Data Viewer
-
Ratings
Multi-User Support (named login)9.111 Ratings00 Ratings
Role-Based Security Model9.19 Ratings00 Ratings
Multiple Access Permission Levels (Create, Read, Delete)9.18 Ratings00 Ratings
Report-Level Access Control9.11 Ratings00 Ratings
Mobile Capabilities
Comparison of Mobile Capabilities features of Product A and Product B
Entrinsik Informer
9.1
1 Ratings
16% above category average
Lightning Tools Data Viewer
-
Ratings
Responsive Design for Web Access9.11 Ratings00 Ratings
Dashboard / Report / Visualization Interactivity on Mobile9.11 Ratings00 Ratings
Application Program Interfaces (APIs) / Embedding
Comparison of Application Program Interfaces (APIs) / Embedding features of Product A and Product B
Entrinsik Informer
8.2
1 Ratings
6% above category average
Lightning Tools Data Viewer
-
Ratings
REST API8.21 Ratings00 Ratings
Best Alternatives
Entrinsik InformerLightning Tools Data Viewer
Small Businesses
Yellowfin
Yellowfin
Score 8.8 out of 10
Supermetrics
Supermetrics
Score 9.9 out of 10
Medium-sized Companies
Reveal
Reveal
Score 10.0 out of 10
Supermetrics
Supermetrics
Score 9.9 out of 10
Enterprises
Kyvos Semantic Layer
Score 9.5 out of 10
IBM Analytics Engine
Score 8.5 out of 10
All AlternativesView all alternativesView all alternatives
User Ratings
Entrinsik InformerLightning Tools Data Viewer
Likelihood to Recommend
10.0
(77 ratings)
9.1
(1 ratings)
Likelihood to Renew
8.7
(67 ratings)
-
(0 ratings)
Usability
9.1
(14 ratings)
-
(0 ratings)
Availability
9.1
(3 ratings)
-
(0 ratings)
Performance
8.3
(2 ratings)
-
(0 ratings)
Support Rating
10.0
(11 ratings)
-
(0 ratings)
Online Training
7.3
(2 ratings)
-
(0 ratings)
Implementation Rating
9.0
(5 ratings)
-
(0 ratings)
Product Scalability
7.1
(2 ratings)
-
(0 ratings)
User Testimonials
Entrinsik InformerLightning Tools Data Viewer
Likelihood to Recommend
Entrinsik
It makes creating queries very easy for end users so not only research or technicians can do it. The availability for creating Live reports that are accessible via Excel on the network has given many of our users the ability to get the information they need in a format they can use without needing someone to translate the raw data
Read full review
Lightning Tools
Lightning Tools Data Viewer is well suited for re-surfacing data and customizing its look and feel.
Read full review
Pros
Entrinsik
  • Simple user-interface: Informer is relatively easy to learn and end users can begin running reports and creating new reports quickly.
  • Email "burst" functionality: This feature allows emails to be sent out based on data in the report. So for example, a report could be scheduled that would email all student employment managers listing out the specific employees that report to them that haven't submitted their time sheets. Each manager would only see the rows that correspond to their email address.
  • Analytics and grouping: Users can quickly drag columns to group and sub-total, and can use the analytics tab to get deeper insights into the data.
Read full review
Lightning Tools
  • Shows Lists created on different sites to be seen and controlled on another site in a Tenant
  • Allows selection of layouts and coloring way beyond what other programs do.
  • Easy to learn and very functional.
Read full review
Cons
Entrinsik
  • There are a lot of reports that we have in Informer that say they have never been run, even though I know they have been run. So that makes it really difficult to determine which reports can be deleted to keep a tidy report list.
  • The only other complaint I have about Informer is that there doesn't seem to be a properly detailed error code/message when the student information system can't be accessed. For example, I am currently trying to move Informer to its own standalone server and I get an error message saying that our license isn't valid. Informer Support sent a new license, which prompted the same message, and the only explanation they have given me is that Informer can't reach the student information system. I would think that if that were the case, the error message would say that instead of an invalid license.
Read full review
Lightning Tools
  • Data Viewer has a graph feature that is old school flat design. We loved the In House real 3D graph Lightning Tools program.
Read full review
Likelihood to Renew
Entrinsik
Informer has been handily meeting most of our reporting needs, and we've created a library of hundreds of reports that are used every day. They have a terrific support service to help when you have questions, and I've found them to be great at listening to what customers would like and adding new features. They are a small company that really listens and really cares, and I've been very pleased over the past few years getting to know them.
Read full review
Lightning Tools
No answers on this topic
Usability
Entrinsik
From the perspective of the new user and a seasoned user I would say eight would represent both parties. It presents a 'familiar' interface and easy to navigate display. Tagging is quite nice and allows for organization of reports based on those tags. These have to be monitored like anything else to keep them consistent but provides a better than average means of organizing reports.
Read full review
Lightning Tools
No answers on this topic
Reliability and Availability
Entrinsik
We have 10 concurrent licenses and we average between 6-8 at any given time during the day; and we host the application.
Read full review
Lightning Tools
No answers on this topic
Support Rating
Entrinsik
I would have given 10 but no one and no system is perfect. The only issue with support is not the staff nor the response but the support Wiki and support pages in general run very slow at times. I believe this has been addressed by the company but the technical speed of the pages have been an issue.
Read full review
Lightning Tools
No answers on this topic
Implementation Rating
Entrinsik
We bought the product on a Thursday morning, and we were writing reports on Friday afternoon. We did take about a month to manage the Mapping, Linking and Security to allow us to open it up across campus. We are now mapping from as many third-party vendors as we can to enable the creation of more ad-hoc reporting.
Read full review
Lightning Tools
No answers on this topic
Alternatives Considered
Entrinsik
I have experience with Advizor AnalystX, and it was just awful. It is advertised as an interactive reporting tool, in which you can use your mouse to select and segment constituents by where they live (by clicking on a map), how much they've given to your institution, when they last gave, etc. In practice, their map feature was unusable; it's a static map image (imagine a paper map hung on your wall), rather than draggable and zoomable Google Maps, and it required hours of work to configure one map region. As far as computing constituents' giving statistics, it required way too much back-end work to build simple giving totals.
Read full review
Lightning Tools
Lightning Tools Data Viewer is much easier and more powerful than Infowise similar viewer in their lineup. In this case, we use Data Viewer over the one offered by Infowise.
Read full review
Return on Investment
Entrinsik
  • We have definitely improved customer service due to better reporting using Informer. All departments are better empowered to help our students in a more timely and accurate manner.
  • Using Informer has given us the ability to eliminate functionality within our ERP system and offload reporting to a data store instead of the transactional system. This has resulted in successfully upgrading our core systems and improved response times.
Read full review
Lightning Tools
  • It allows us to do things that would take a great deal more time to duplicate in SharePoint
  • It cuts down on ugly looking built in SP list layouts
  • Users find it easy to access, thus this product is more productive
Read full review
ScreenShots

Entrinsik Informer Screenshots

Screenshot of Screenshot of Screenshot of

Lightning Tools Data Viewer Screenshots
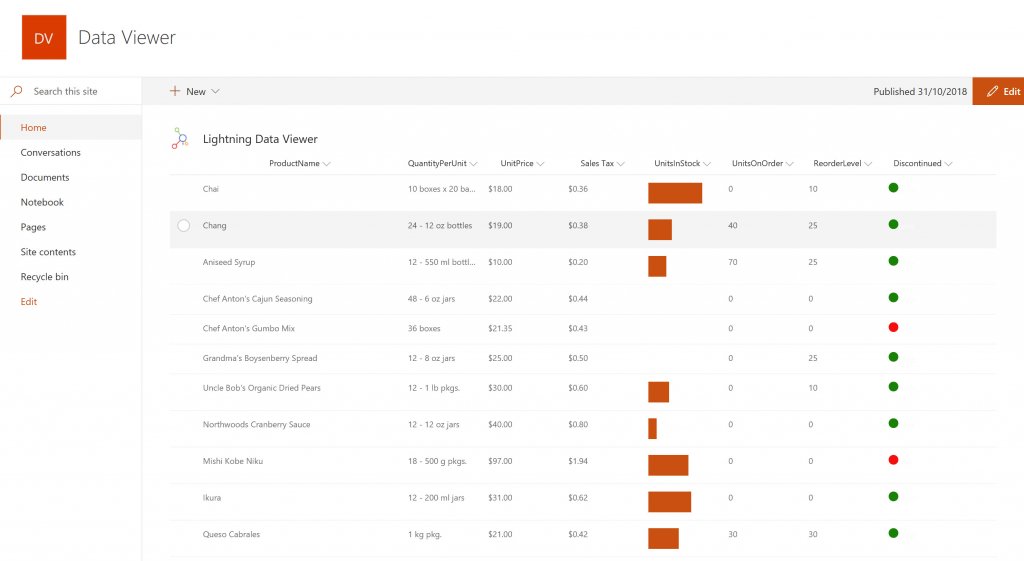
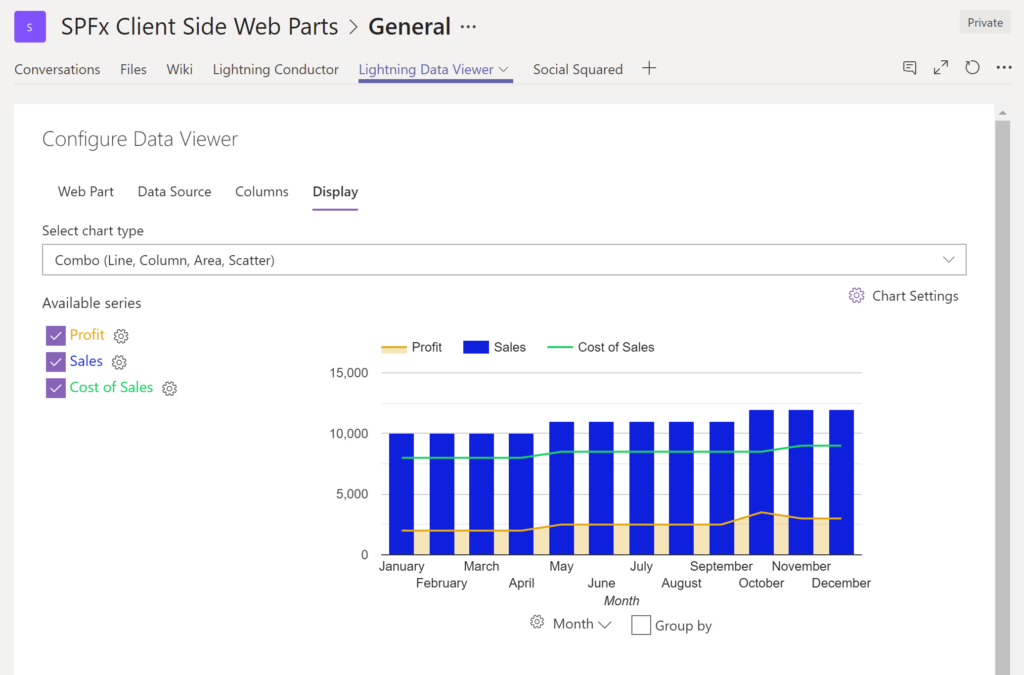
Screenshot of DISPLAYING EXTERNAL DATA WITHIN SHAREPOINT OR MICROSOFT TEAMS
The Data Viewer Client Side Web Part can be configured by Business Users within a few minutes to display Line of Business Data from Data Sources such as Excel,  SQL Azure, Business Connectivity Services, OData and SharePoint Lists.  Connections to an organizations data such as Customer Relationship Management Systems, Accounting Systems, or Custom Databases can be connected, giving business users a live up-to-date view of business information within the context of their SharePoint Team Sites or Microsoft Teams Tabs.Screenshot of HIGHLIGHTING KEY BUSINESS DATA (NO CODE)
Conditional formatting can be used to highlight key business data. Overdue Tasks, Low Stock, Currency Exchange Rates, Sales Revenue are examples of data to highlight visually allowing for a quick reaction time. Key Financial Indicators and Key Performance Indicators can be configured with a simple dialog and no need to write any code. Choose colours, icons or data bars to highlight key data.Screenshot of SELECTING AND STYLING ICONS
Icons can be chosen as part of the conditional formatting to make data stand out. The Office 365 Fabric icons can be selected and styled and applied to cell values. Pepper pots, Smileys, Envelopes and more icons are available. There are hundreds of options to choose from to highlight data that needs to be acted upon.Screenshot of DATA VIEWER CAN BE A GRID OF DATA OR A CHART IN SHAREPOINT OR MICROSOFT TEAMS
The Data Viewer can be used within Microsoft SharePoint Modern Sites or Microsoft Teams Tabs as a Grid of Data with styling or as a Chart which can be configured. The Charting Feature allows for Pie, Donut, Column, Line, Area, and Scatter Charts which can all be configured and displayed in 2D or 3D.Screenshot of TREEMAPS
summary information can be displayed within a TreeMap next to the detail. Users will be able to see trends, and how the business is performing  using the TreeMap view of data.Screenshot of CHARTS AND GAUGES
The Data Viewer is used to represent data in multiple ways using Gauges, TreeMaps, Multiple Series Charts, and Pie Charts.