GoodData vs. Grafana

Overview
ProductRatingMost Used ByProduct SummaryStarting Price
GoodData
Score 8.4 out of 10
N/A
GoodData is a cloud-based data and analytics platform, bringing AI-fueled data-driven decision-making to organisations across the globe. With a platform that leverages the potential of automation and AI, GoodData empowers its customers to make data analytics available to end users via real-time, self-service data insights right at the point of work. The vendor states that over 140,000 businesses and 3.2 million users rely on GoodData to drive meaningful change and achieve more through…
$30
per month per user
Grafana
Score 8.6 out of 10
N/A
Grafana is a data visualization tool developed by Grafana Labs in New York. It is available open source, managed (Grafana Cloud), or via an enterprise edition with enhanced features. Grafana has pluggable data source model and comes bundled with support for popular time series databases like Graphite. It also has built-in support for cloud monitoring vendors like Amazon Cloudwatch, Microsoft Azure and SQL databases like MySQL. Grafana can combine data from many places into a single dashboard.
$0
Pricing
GoodDataGrafana
Editions & Modules
Internal Analytics Startup
$30
per month per user
Grafana Cloud - Pro
$8
per month up to 1 active user
Grafana Cloud - Free
Free
10k metrics + 50GB logs + 50GB traces up to 3 active users
Grafana Cloud - Advanced
Volume Discounts
custom data usage custom active users
Grafana - Enterprise Stack
Custom Pricing
Offerings
Pricing Offerings
GoodDataGrafana
Free Trial
YesYes
Free/Freemium Version
NoYes
Premium Consulting/Integration Services
YesNo
Entry-level Setup FeeOptionalNo setup fee
Additional Details
More Pricing Information
Features
GoodDataGrafana
BI Standard Reporting
Comparison of BI Standard Reporting features of Product A and Product B
GoodData
7.6
53 Ratings
9% above category average
Grafana
8.0
4 Ratings
5% below category average
Pixel Perfect reports7.637 Ratings7.04 Ratings
Customizable dashboards7.853 Ratings10.04 Ratings
Report Formatting Templates7.442 Ratings7.04 Ratings
Ad-hoc Reporting
Comparison of Ad-hoc Reporting features of Product A and Product B
GoodData
7.8
52 Ratings
1% above category average
Grafana
8.2
3 Ratings
2% above category average
Drill-down analysis7.751 Ratings8.03 Ratings
Formatting capabilities6.852 Ratings8.03 Ratings
Report sharing and collaboration7.748 Ratings9.03 Ratings
Integration with R or other statistical packages00 Ratings8.03 Ratings
Data Discovery and Visualization
Comparison of Data Discovery and Visualization features of Product A and Product B
GoodData
7.1
51 Ratings
6% below category average
Grafana
7.5
3 Ratings
9% below category average
Pre-built visualization formats (heatmaps, scatter plots etc.)7.349 Ratings7.03 Ratings
Location Analytics / Geographic Visualization7.040 Ratings8.03 Ratings
Predictive Analytics6.829 Ratings7.03 Ratings
Pattern Recognition and Data Mining7.59 Ratings8.01 Ratings
Access Control and Security
Comparison of Access Control and Security features of Product A and Product B
GoodData
7.4
53 Ratings
0% below category average
Grafana
-
Ratings
Multi-User Support (named login)7.553 Ratings00 Ratings
Role-Based Security Model7.146 Ratings00 Ratings
Multiple Access Permission Levels (Create, Read, Delete)7.452 Ratings00 Ratings
Single Sign-On (SSO)7.731 Ratings00 Ratings
Application Program Interfaces (APIs) / Embedding
Comparison of Application Program Interfaces (APIs) / Embedding features of Product A and Product B
GoodData
8.0
31 Ratings
7% above category average
Grafana
-
Ratings
REST API7.926 Ratings00 Ratings
Javascript API7.924 Ratings00 Ratings
iFrames8.125 Ratings00 Ratings
Report Output and Scheduling
Comparison of Report Output and Scheduling features of Product A and Product B
GoodData
-
Ratings
Grafana
9.2
3 Ratings
10% above category average
Publish to Web00 Ratings9.03 Ratings
Publish to PDF00 Ratings9.03 Ratings
Report Versioning00 Ratings9.03 Ratings
Report Delivery Scheduling00 Ratings9.03 Ratings
Delivery to Remote Servers00 Ratings10.03 Ratings
Best Alternatives
GoodDataGrafana
Small Businesses
BrightGauge
BrightGauge
Score 8.9 out of 10
IBM SPSS Modeler
IBM SPSS Modeler
Score 7.8 out of 10
Medium-sized Companies
Reveal
Reveal
Score 9.9 out of 10
Mathematica
Mathematica
Score 8.2 out of 10
Enterprises
Sigma
Sigma
Score 9.0 out of 10
IBM SPSS Modeler
IBM SPSS Modeler
Score 7.8 out of 10
All AlternativesView all alternativesView all alternatives
User Ratings
GoodDataGrafana
Likelihood to Recommend
7.8
(81 ratings)
10.0
(4 ratings)
Likelihood to Renew
8.1
(14 ratings)
-
(0 ratings)
Usability
7.5
(60 ratings)
-
(0 ratings)
Availability
7.0
(1 ratings)
-
(0 ratings)
Performance
8.0
(1 ratings)
-
(0 ratings)
Support Rating
8.2
(6 ratings)
-
(0 ratings)
In-Person Training
9.0
(1 ratings)
-
(0 ratings)
Online Training
8.0
(1 ratings)
-
(0 ratings)
Implementation Rating
9.0
(2 ratings)
-
(0 ratings)
Ease of integration
8.0
(1 ratings)
-
(0 ratings)
User Testimonials
GoodDataGrafana
Likelihood to Recommend
GoodData
GoodData excels for my sales team in scenarios such as real-time performance tracking and sales metrics. The customizable dashboards help me to monitor lead conversion, revenue and individual performance. Along with huge data we also have insights. We can get most of our decisions based on it's analysis and optimize our strategies, and enhance overall sales.
Read full review
Grafana Labs
Grafana is a one stop solution for all application monitoring needs. In our organisation, we use nodeJs. We run it using pm2. Since we didn't use Grafana it was hard for us to know if an app has stopped working unless we find it ourselves because our other app components were failing, or someone called us up and told about the situation. We were already using Grafana for monitoring our Ubuntu servers, but we hadn't had set it up for our app monitoring. Somehow we decided to monitor our nodeJs app with Grafana. It's a really good decision we made. We used Grafana nodeJs module "prom-client" for our node app which brought us relief from app failing situations. Since we have implemented Grafana for our Node app, it has helped us to monitor every health aspect of our node app. Now we have set up alerts based on heap-memory, so when heap memory goes beyond a set threshold we get notified and take the right steps ultimately saving our app from crashing and of course from losing business and reputation.
Read full review
Pros
GoodData
  • GoodData helps in simplifying complex data into easy-to-understand visuals. We can create personalized dashboards & tailor them as per requirements. This data can be used from an executive level employee to a team lead employee in the business
  • GoodData is a very user friendly platform. The collaborative features simplify sharing and discussing reports among team members which promotes a culture of data-driven decision-making.
  • GoodData connects with various data sources and consolidate information from multiple platforms. This flexibility proves invaluable for businesses dealing with data spread across different systems as they can access large amount of data on a single platform.
Read full review
Grafana Labs
  • It visualizes metrics very well coming from any well known data source.
  • It sends alerts to collaboration channels when a threshold is breeched.
  • Graphs and dashboards are portable (Graph-as-a-Code).
Read full review
Cons
GoodData
  • Firstly I would like to mention about it's setup which took us more than a month to integrate and get things started.
  • Not that easy for beginner to start using the platform.
  • Some features are hard to find at setup due to it's complexity but later it went well.
Read full review
Grafana Labs
  • Functions to customize values
  • Improved user experience
Read full review
Likelihood to Renew
GoodData
Each client I have worked with and spoken too has renewed their GoodData subscription. I know of not one to date that has cancelled. The GoodData platform has a very high rate of renewal from the discussions I have had with their internal teams as well
Read full review
Grafana Labs
No answers on this topic
Usability
GoodData
GoodData provided us with strong overall usability and provided us a platform for various business analytics. Its user-friendly and insightful reports and also the dashboards. Me and my team really appreciate the platform's ability to streamline decision-making processes. However, there is a learning curve during initial setup as I mentioned before. Continuous improvements in the onboarding could further enhance GoodData's usability as well.
Read full review
Grafana Labs
No answers on this topic
Reliability and Availability
GoodData
We are approximately one month since go-live. There has been one short outage.
Read full review
Grafana Labs
No answers on this topic
Performance
GoodData
Performance on refreshing metrics works well.
Read full review
Grafana Labs
No answers on this topic
Support Rating
GoodData
Support team has been highly responsive and helpful from our first initial deployment to present day. They engage and work with us. know when to escalate for more challenging problems. They also follow up. Overall have had a very good experience with support
Read full review
Grafana Labs
No answers on this topic
In-Person Training
GoodData
Petr was a rock star - patient, knowledgeable, clear and easy to work with.
Read full review
Grafana Labs
No answers on this topic
Online Training
GoodData
GoodData implementation team was professional and courteous
Read full review
Grafana Labs
No answers on this topic
Implementation Rating
GoodData
Thorough, professional and on time.
Read full review
Grafana Labs
No answers on this topic
Alternatives Considered
GoodData
GoodData was more cost effective and did not necessitate additional spend on internal resources. The end user interface was easy to use and did not require additional set up or customization. The clients required little support from the Prometric staff to use the product
Read full review
Grafana Labs
Grafana has a direct plugin to Icinga monitoring solution and allowed for easy configuration for us. At the time of implementation, other services did not have such an integration. As we already had a very customized and heavily introduced monitoring solution in place, we needed settings that could plug into the system quickly and efficiently. This was the case with Grafana and allowed us to have all the integrations we needed with services such as Icinga
Read full review
Return on Investment
GoodData
  • We have been able to quickly go to market with a feature-rich version of our application.
  • The licensing costs are manageable but make our offering more expensive than alternatives.
  • The possibility to horizontal scaling with Kubernetes is a bright outlook for our business.
Read full review
Grafana Labs
  • Helps us to keep our application and server up all time
  • Dashboards are easy to share with others
Read full review
ScreenShots

GoodData Screenshots

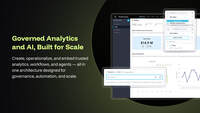
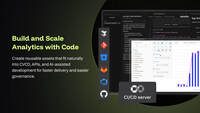
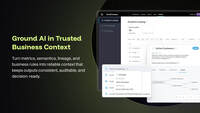
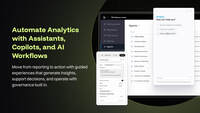
Screenshot of GoodData's array of tools and AI features to dig into data for needed insights.Screenshot of GoodData’s AI-powered features (like NLQ) and drag-and-drop UI, used to build and interact with charts and dashboards.Screenshot of GoodData's pro-code, low-code, and no-code interfaces, available so users with all skill levels can collaborate to share insights and findings.Screenshot of forecasting tools that let users predict trends for key business metrics for the next month, quarter, and year.Screenshot of NLQ, used to ask questions of data, automatically create new visualizations, and discover new insights using natural language via an AI chatbot.Screenshot of an AI-powered explanation of what is driving the values, in dashboards and visualizations.