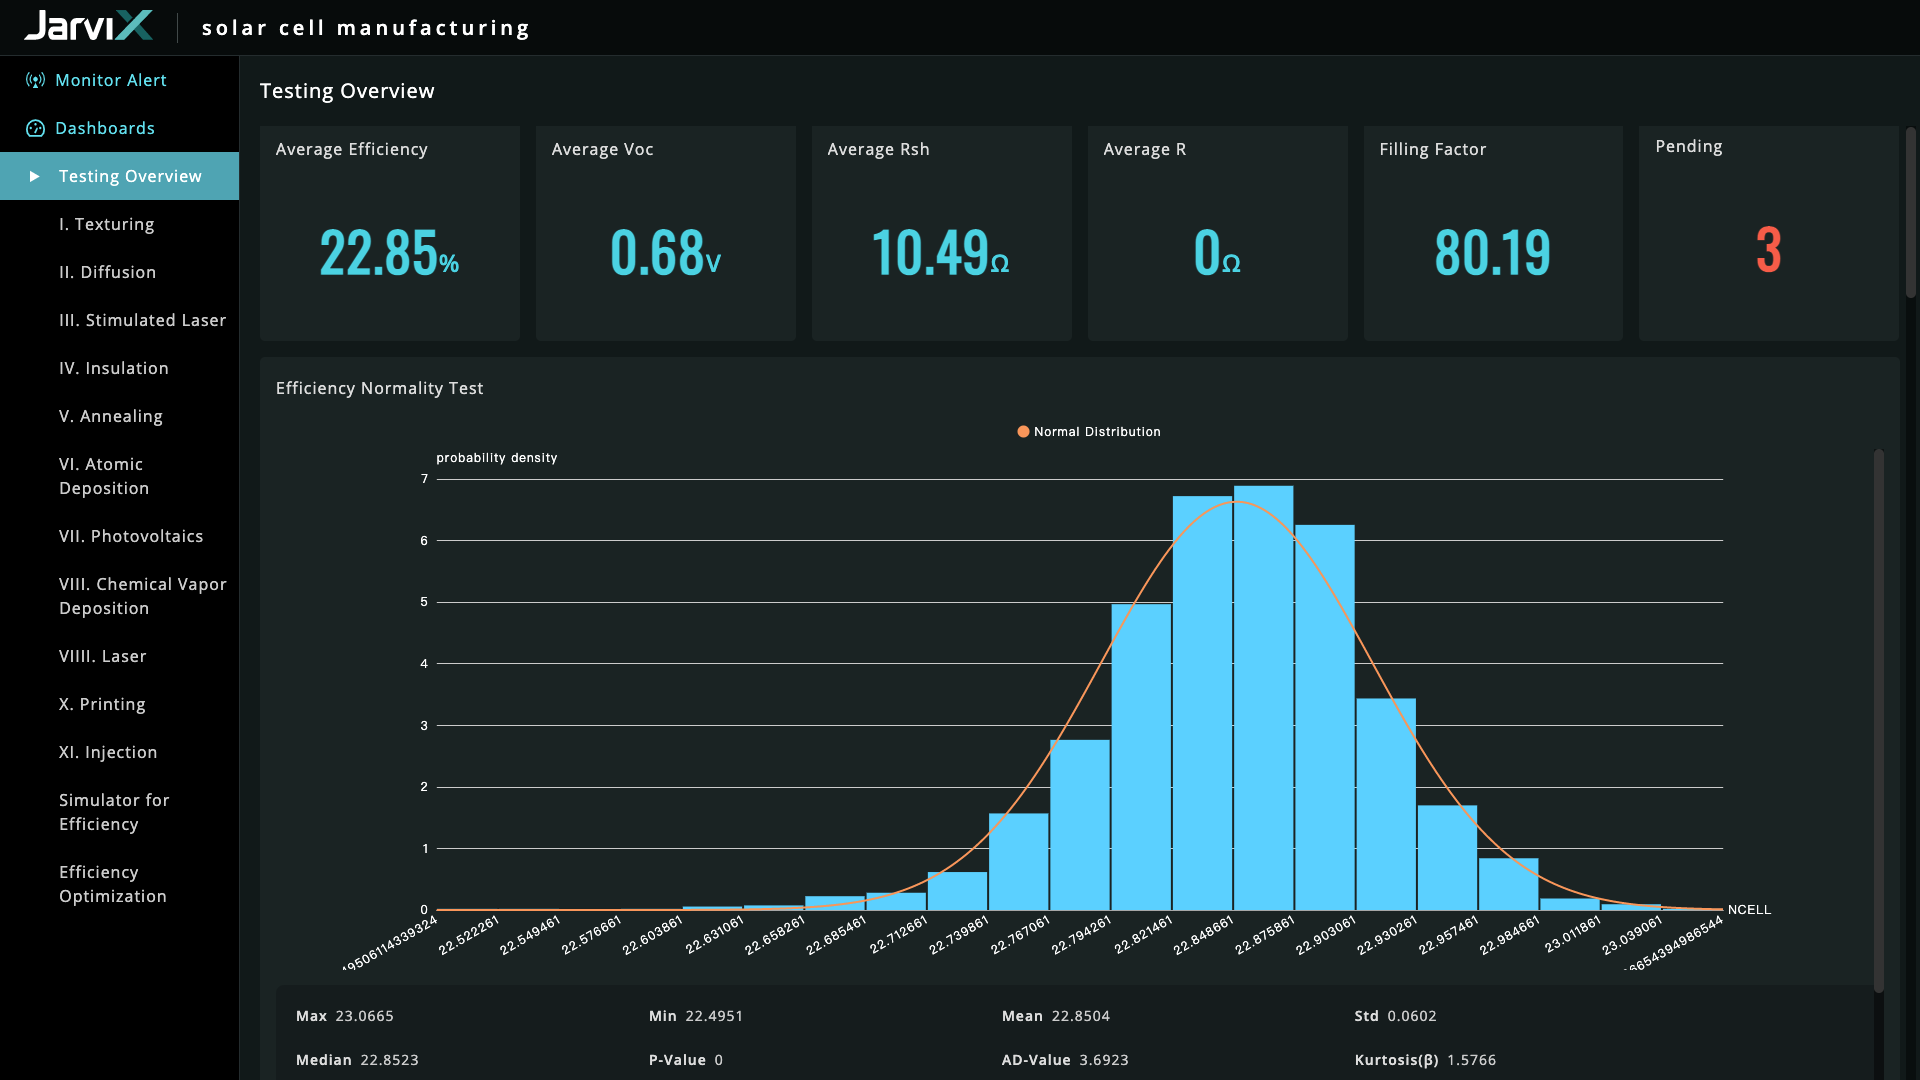
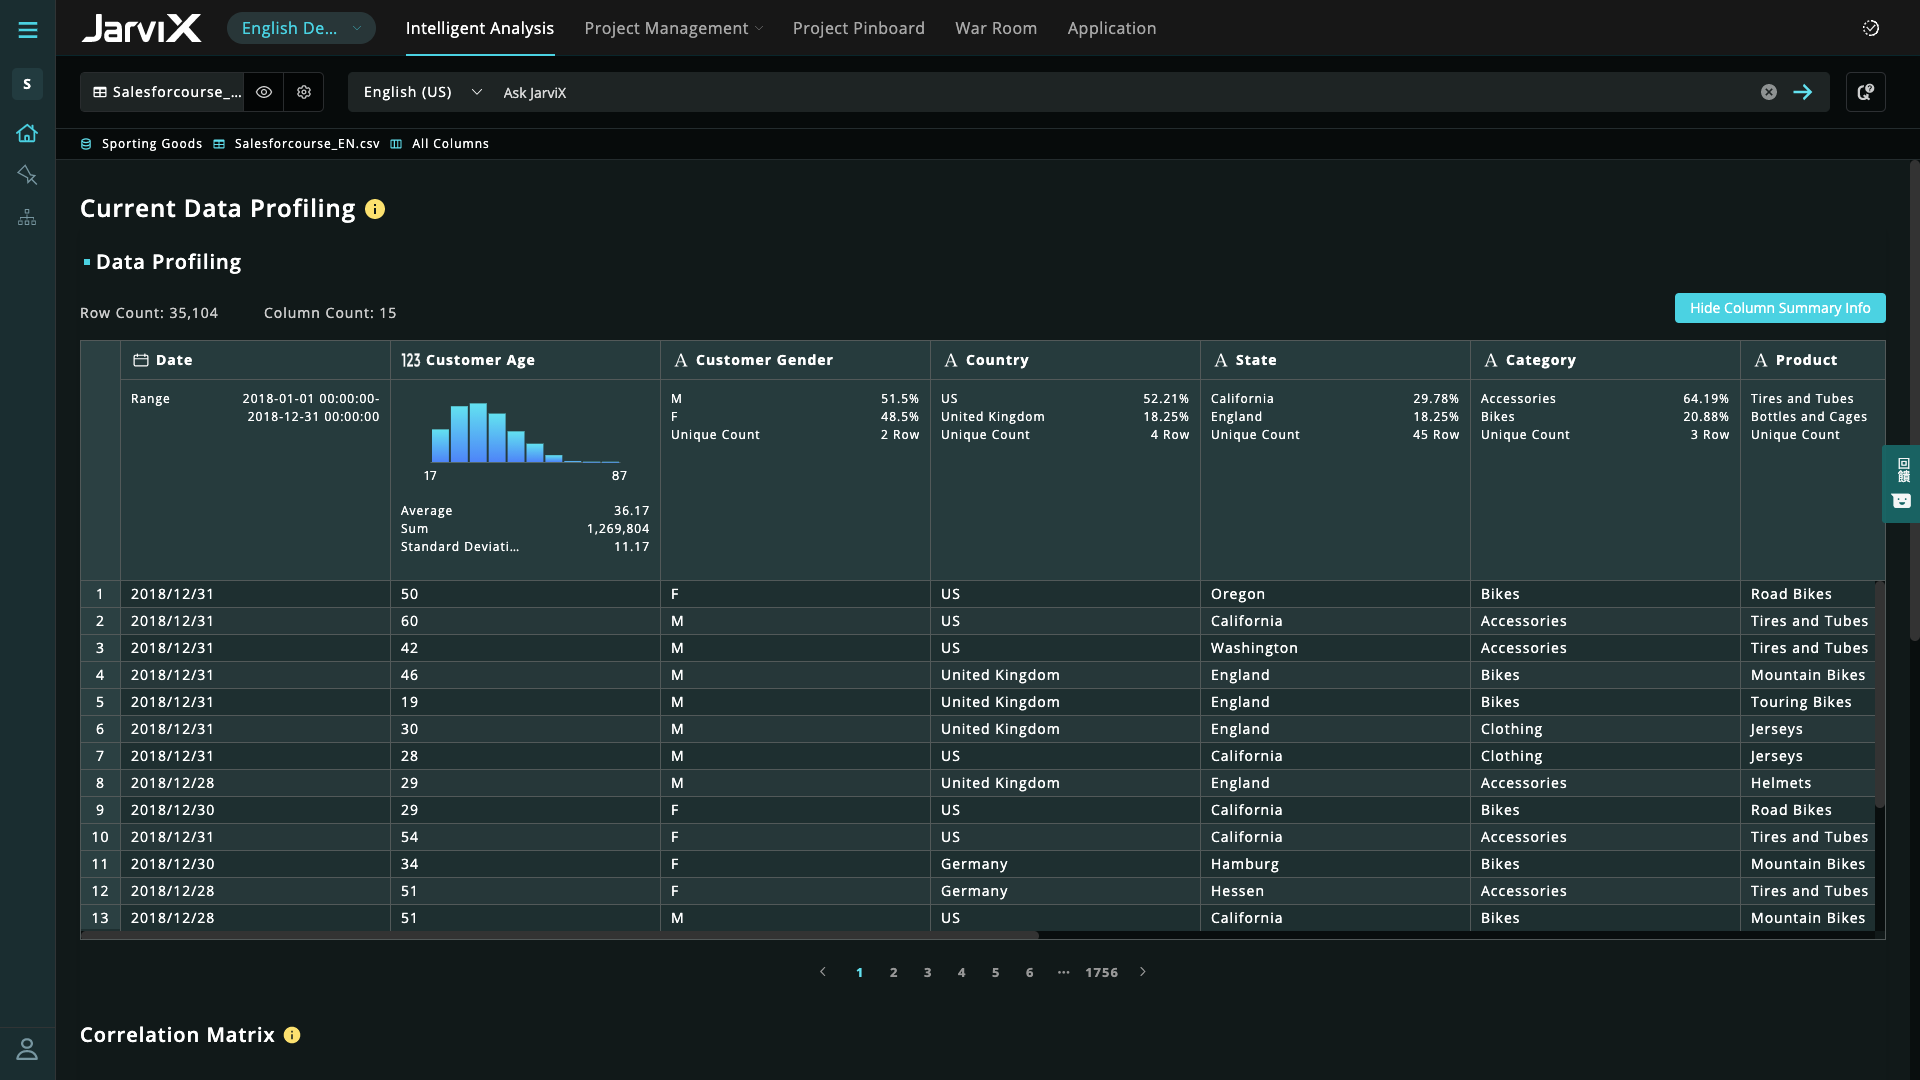
Synergies is a cognitive application service provider that combines business knowledge, artificial intelligence technology, and software development. Their mission is to help businesses through their digital transformation journey, become leaders and innovators in their industries by unlocking the power of data in the hands of business users and decision makers. Their product, JarviX, is an AnalyticOps Platform . JarviX uses NLP…
N/A
Sisense for Cloud Data Teams
Score5 out of 10
N/A
Sisense for Cloud Data Teams (formerly Periscope Data) is a data visualization tool that allows users to connect to their SQL databases to create sharable, interactive dashboards. In addition to SQL, its analytics integrate with R and Python, allowing users to prep datasets, perform analysis, and create their own visualizations. Sisense acquired Periscope Data in mid-2019.
N/A
Pricing
JarviX
Sisense for Cloud Data Teams
Editions & Modules
No answers on this topic
No answers on this topic
Offerings
Pricing Offerings
JarviX
Sisense for Cloud Data Teams
Free Trial
No
No
Free/Freemium Version
No
No
Premium Consulting/Integration Services
No
No
Entry-level Setup Fee
No setup fee
No setup fee
Additional Details
—
—
More Pricing Information
Features
JarviX
Sisense for Cloud Data Teams
BI Standard Reporting
Comparison of BI Standard Reporting features of JarviX and Sisense for Cloud Data Teams
Feature
JarviX
7.6
2 Ratings
7% below category average
Sisense for Cloud Data Teams
7.0
19 Ratings
14% below category average
Pixel Perfect reports
8.21 Ratings
6.010 Ratings
Customizable dashboards
7.32 Ratings
7.019 Ratings
Report Formatting Templates
7.31 Ratings
8.017 Ratings
Ad-hoc Reporting
Comparison of Ad-hoc Reporting features of JarviX and Sisense for Cloud Data Teams
Feature
JarviX
7.8
2 Ratings
3% below category average
Sisense for Cloud Data Teams
4.8
19 Ratings
48% below category average
Drill-down analysis
7.12 Ratings
6.015 Ratings
Formatting capabilities
7.31 Ratings
7.018 Ratings
Integration with R or other statistical packages
9.11 Ratings
3.010 Ratings
Report sharing and collaboration
7.72 Ratings
3.019 Ratings
Report Output and Scheduling
Comparison of Report Output and Scheduling features of JarviX and Sisense for Cloud Data Teams
Feature
JarviX
7.8
1 Ratings
5% below category average
Sisense for Cloud Data Teams
7.6
18 Ratings
7% below category average
Publish to Web
9.11 Ratings
5.012 Ratings
Publish to PDF
7.31 Ratings
10.012 Ratings
Report Versioning
6.41 Ratings
8.012 Ratings
Report Delivery Scheduling
8.21 Ratings
5.015 Ratings
Delivery to Remote Servers
8.21 Ratings
10.06 Ratings
Data Discovery and Visualization
Comparison of Data Discovery and Visualization features of JarviX and Sisense for Cloud Data Teams
JarviX is very good at data integration, creating charts and reports for data visualization. It is really impressive that Jarvix can let our marketing team know the number of members living in a specific area in seconds. In addition, the product manager from Synergies is willing to help us with all problems we encounter. I accidentally changed one of the settings in a data table which threw the existing dashboard into chaos. However, after assistance from the product manager, we were able to successfully bring the data back to normal.
Sisense for Cloud Data Teams is suited so well for our project that works with lots of data and needs some ways to share data internally or externally with our clients. It's very easy to pull out the data from the sense in best and in a suitable format and moreover a huge number of options are available there to represent the data. All features of this Sisense for cloud data teams software can be taken advantage of if you have a team who are well versed in data analytics, data management, and programming.
A de minimis incentive was given to thank the reviewer for their time. The incentive was not used to bias or drive a particular response, nor was the incentive contingent on a positive endorsement. More Info
Rapid deployment of polished T-SQL-based data visualization charts and dashboards. Periscope supports a variety of database technologies, and allows users to write custom queries to display data.
Included caching to reduce server load.
Outstanding customer service/support, with expert advice as needed.
Constant updates and new features.
Built-in SQL formatters take the pain out of manipulating date/time objects.
There should be more flexibility in changing the data tables uploaded into JarviX. For example, it should enable users to edit the syntax of the table or change the data format of the columns without affecting the existing dashboard and charts already created using that data table.
Include more appropriate updates in their monthly newsletter as opposed to the general overview that doesn't always have the most pertinent information at the forefront.
There are bugs at times when certain dashboards are down, though not in an overwhelming way.
If you do not tag something it shows up in multiple views and may be accessible to people that it should not be, though that is a user error it may make sense to prompt for a tag and security setting.
A de minimis incentive was given to thank the reviewer for their time. The incentive was not used to bias or drive a particular response, nor was the incentive contingent on a positive endorsement. More Info
A de minimis incentive was given to thank the reviewer for their time. The incentive was not used to bias or drive a particular response, nor was the incentive contingent on a positive endorsement. More Info
If you know SQL or are somewhat data-savvy, you'll feel right at home with Sisense for Cloud Data Teams. However, like most other BI tools, it is a little challenging to use for users that are non-technical. The graphs and charts are very visually appealing, and there's lots of customization and export options.
A de minimis incentive was given to thank the reviewer for their time. The incentive was not used to bias or drive a particular response, nor was the incentive contingent on a positive endorsement. More Info
A de minimis incentive was given to thank the reviewer for their time. The incentive was not used to bias or drive a particular response, nor was the incentive contingent on a positive endorsement. More Info
A de minimis incentive was given to thank the reviewer for their time. The incentive was not used to bias or drive a particular response, nor was the incentive contingent on a positive endorsement. More Info
Tableau and Power BI. Obviously, they are not in the same category. Tableau and Power BI only provide data visualizations plus a little bit of analytics. JarviX not only provides data exploration, so you can find out what the problem is, as well as model management and App builder. If you only look for a dashboard, yes BI is probably enough, but if you constantly feel lacking actionable insights for actual implementations of improvements, JarviX is the choice for you.
A de minimis incentive was given to thank the reviewer for their time. The incentive was not used to bias or drive a particular response, nor was the incentive contingent on a positive endorsement. More Info
Google Analytics works well but it does not have all of the bells and whistles that Periscope Data offers. Google Analytics is best used in a Google environment but if you are using other tools and programs outside of the Google universe, then Periscope Data is a much better option.
A de minimis incentive was given to thank the reviewer for their time. The incentive was not used to bias or drive a particular response, nor was the incentive contingent on a positive endorsement. More Info
I think the best part of JarviX is that we can get the analysis results in several minutes. We spent lots of time making reports and managing our data in the past. All in all, it helps us save the time, cost, and labor of managing data.
A de minimis incentive was given to thank the reviewer for their time. The incentive was not used to bias or drive a particular response, nor was the incentive contingent on a positive endorsement. More Info