Overview
ProductRatingMost Used ByProduct SummaryStarting Price
Lightning Tools Data Viewer
Score 9.1 out of 10
Mid-Size Companies (51-1,000 employees)
The Data Viewer provides data visualization in the form of reports or charts that can be created and customized to suit a business's needs. Silos of data exist in most organizations and yet contain valuable insights into how well the organization is performing and where action is needed. Those silos often include Microsoft Excel workbooks, Microsoft SQL Azure databases, On-Premises data sources accessible through OData or Business Connectivity Services and even SharePoint Lists. These data…
$2,200
per year per installation
MATLAB
Score 8.8 out of 10
N/A
MatLab is a predictive analytics and computing platform based on a proprietary programming language. MatLab is used across industry and academia.
$49
per student license
Mathematica
Score 7.0 out of 10
N/A
Wolfram's flagship product Mathematica is a modern technical computing application featuring a flexible symbolic coding language and a wide array of graphing and data visualization capabilities.
$1,520
per year
Pricing
Lightning Tools Data ViewerMATLABWolfram Mathematica
Editions & Modules
Data Viewer OnPrem
$1,000
per year Per installation, 1 x WFE
Data Viewer Online
$2,200
per year per installation
Data Viewer OnPrem Enterprise Edition
POA
per year Per installation, 4+ WFE
Data Viewer Online Enterprise Edition
POA
per year per installation
Student
$49
per student license
Home
$149
perpetual license
Education
$250
per year
Education
$500
perpetual license
Standard
$860
per year
Standard
2,150
perpetual license
Standard Cloud
$1,520
per year
Standard Desktop
$3,040
one-time fee
Standard Desktop & Cloud
$3,344
one-time fee
Mathematica Enterprise Edition
$8,150.00
one-time fee
Offerings
Pricing Offerings
Lightning Tools Data ViewerMATLABMathematica
Free Trial
YesNoNo
Free/Freemium Version
NoNoNo
Premium Consulting/Integration Services
YesNoNo
Entry-level Setup FeeNo setup feeNo setup feeNo setup fee
Additional DetailsPrices stated are minimum per installation for "stock" products. $2.20 per user / year on top of base price. Enterprise editions can be amended to suit business needs if deemed necessary, additional costs incurred and TBD. All packages include free technical support. Free upgrades available to latest versions of tool as they are released. (online version)Discounts available for students and educational institutions. The Network Edition reduce per-user license costs through shared deployment across any number of machines on a local-area network.
More Pricing Information
Community Pulse
Lightning Tools Data ViewerMATLABWolfram Mathematica
Considered Multiple Products
Lightning Tools Data Viewer

No answer on this topic

MATLAB
Chose MATLAB
Apart from Matlab, I used Matematica for some of my integral evaluations. Mathematica is also a "clean" and easy-to-use software that solves symbolic math problems (even better than Matlab for symbolic math). I also used Anaconda and Spyder for my career so far.
Chose MATLAB
Those are expensive than MATLAB and their GUI is not great along with editor. However, they have more libraries set as compared to Matlab. However, the place where MATLAB adds value is its user community as well as its support and we can find solutions to any problem with …
Chose MATLAB
How MATLAB compares to its competition or similar open access tools like R (programming language) or SciLab is that it's simply more powerful and capable. It embraces a wider spectrum of possibilities for far more fields than any other environment. R, for example, is intended …
Mathematica
Chose Wolfram Mathematica
We selected Wolfram Mathematica as it offers lot of functionality that other products like MATLAB or sageMath do not have. And it also has advantages on the feature that it does share in common with other tools like sageMath, MATLAB etc. It is more powerful than MATLAB. It …
Chose Wolfram Mathematica
MATLAB is an excellent tool, but it can't handle analytic manipulations in algebra, calculus and differential equations. MATLAB is superior when it comes to a less steep learning curve. In terms of using only one tool for analytic and numerical calculations, Mathematica wins. …
Chose Wolfram Mathematica
The ability to manipulate algebraic expressions, nested lists, and data structures in Mathematica was unequalled when I first did the comparison. Since then, I've stuck with Mathematica mostly because it's "the tool I know."
Features
Lightning Tools Data ViewerMATLABWolfram Mathematica
BI Standard Reporting
Comparison of BI Standard Reporting features of Product A and Product B
Lightning Tools Data Viewer
9.1
1 Ratings
12% above category average
MATLAB
-
Ratings
Wolfram Mathematica
9.9
6 Ratings
20% above category average
Customizable dashboards9.11 Ratings00 Ratings9.94 Ratings
Report Formatting Templates9.11 Ratings00 Ratings9.96 Ratings
Pixel Perfect reports00 Ratings00 Ratings9.84 Ratings
Ad-hoc Reporting
Comparison of Ad-hoc Reporting features of Product A and Product B
Lightning Tools Data Viewer
8.2
1 Ratings
5% above category average
MATLAB
-
Ratings
Wolfram Mathematica
9.9
9 Ratings
24% above category average
Drill-down analysis6.41 Ratings00 Ratings9.98 Ratings
Formatting capabilities9.11 Ratings00 Ratings9.98 Ratings
Report sharing and collaboration9.11 Ratings00 Ratings9.99 Ratings
Integration with R or other statistical packages00 Ratings00 Ratings9.97 Ratings
Data Discovery and Visualization
Comparison of Data Discovery and Visualization features of Product A and Product B
Lightning Tools Data Viewer
3.6
1 Ratings
73% below category average
MATLAB
-
Ratings
Wolfram Mathematica
9.9
9 Ratings
24% above category average
Pre-built visualization formats (heatmaps, scatter plots etc.)3.61 Ratings00 Ratings9.99 Ratings
Location Analytics / Geographic Visualization00 Ratings00 Ratings9.98 Ratings
Predictive Analytics00 Ratings00 Ratings9.98 Ratings
Report Output and Scheduling
Comparison of Report Output and Scheduling features of Product A and Product B
Lightning Tools Data Viewer
-
Ratings
MATLAB
-
Ratings
Wolfram Mathematica
9.3
8 Ratings
13% above category average
Publish to Web00 Ratings00 Ratings9.97 Ratings
Publish to PDF00 Ratings00 Ratings9.08 Ratings
Report Versioning00 Ratings00 Ratings9.97 Ratings
Report Delivery Scheduling00 Ratings00 Ratings8.95 Ratings
Delivery to Remote Servers00 Ratings00 Ratings8.95 Ratings
Best Alternatives
Lightning Tools Data ViewerMATLABWolfram Mathematica
Small Businesses
Supermetrics
Supermetrics
Score 9.7 out of 10
IBM SPSS Statistics
IBM SPSS Statistics
Score 8.2 out of 10
Supermetrics
Supermetrics
Score 9.7 out of 10
Medium-sized Companies
Supermetrics
Supermetrics
Score 9.7 out of 10
Alteryx Platform
Alteryx Platform
Score 9.1 out of 10
Supermetrics
Supermetrics
Score 9.7 out of 10
Enterprises
IBM Analytics Engine
Score 7.2 out of 10
Alteryx Platform
Alteryx Platform
Score 9.1 out of 10
IBM Analytics Engine
Score 7.2 out of 10
All AlternativesView all alternativesView all alternativesView all alternatives
User Ratings
Lightning Tools Data ViewerMATLABWolfram Mathematica
Likelihood to Recommend
9.1
(1 ratings)
8.1
(53 ratings)
9.9
(9 ratings)
Usability
-
(0 ratings)
9.9
(4 ratings)
-
(0 ratings)
Support Rating
-
(0 ratings)
9.5
(7 ratings)
9.5
(2 ratings)
User Testimonials
Lightning Tools Data ViewerMATLABWolfram Mathematica
Likelihood to Recommend
Lightning Tools
Lightning Tools Data Viewer is well suited for re-surfacing data and customizing its look and feel.
Read full review
MathWorks
MATLAB really does best for solving computational problems in math and engineering. Especially when you have to use a lot of functions in your solving process, or if you have a nonlinear equation that must be iteratively solved. [MATLAB] can also perform things like integration and derivation on your equations that you put into it.
Read full review
Wolfram
We are the judgement that Wolfram Mathematica is despite many critics based on the paradigms selected a mark in the fields of the markets for computations of all kind. Wolfram Mathematica is even a choice in fields where other bolide systems reign most of the market. Wolfram Mathematica offers rich flexibility and internally standardizes the right methodologies for his user community. Wolfram Mathematica is not cheap and in need of a hard an long learner journey. That makes it weak in comparison with of-the-shelf-solution packages or even other programming languages. But for systematization of methods Wolfram Mathematica is far in front of almost all the other. Scientist and interested people are able to develop themself further and Wolfram Matheamatica users are a human variant for themself. The reach out for modern mathematics based science is deep and a unique unified framework makes the whole field of mathematics accessable comparable to the brain of Albert Einstein. The paradigms incorporated are the most efficients and consist in assembly on the market. The mathematics is covering and fullfills not just education requirements but the demands and needs of experts.
Mathematica is incompatible with other systems for mCAx and therefore the borders between the systems are hard to overcome. Wolfram Mathematica should be consider one of the more open systems because other code can be imported and run but on the export side it is rathe incompatible by design purposes. A better standard for all that might solve the crisis but there is none in sight. Selection of knowledge of what works will be in the future even more focussed and general system might be one the lossy side. Knowledge of esthetics of what will be in the highest demand in necessary and Wolfram is not a leader in this field of science. Mathematics leves from gathering problems from application fields and less from the glory of itself and the formalization of this.
Read full review
Pros
Lightning Tools
  • Shows Lists created on different sites to be seen and controlled on another site in a Tenant
  • Allows selection of layouts and coloring way beyond what other programs do.
  • Easy to learn and very functional.
Read full review
MathWorks
  • It has a very user friendly library which helps users learn this software fairly quickly in a short span of time.
  • The graphical user interface provided by the software is really good.
  • The code that a person writes allows options for debugging.
  • One can visualize the flow of control of their code inside MATLAB.
Read full review
Wolfram
  • It allows straightforward integration of analytic analysis of algebraic expressions and their numerical implemented.
  • Supports varying programmatic paradigms, so one can choose what best fits the problem or task: pure functions, procedural programming, list processing, and even (with a bit of setup) object-oriented programming.
  • The extensive and rich tools for graphical rendering make it very easy to not just get 2D and 3D renderings of final output, but also to do quick-and-dirty 2D and 3D rendering of intermediate results and/or debugging results.
Read full review
Cons
Lightning Tools
  • Data Viewer has a graph feature that is old school flat design. We loved the In House real 3D graph Lightning Tools program.
Read full review
MathWorks
  • MatLab is pricier than most of its competitors and because of this reason, many organizations are moving towards cheaper alternatives - mostly Python.
  • MatLab is inefficient when it comes to performing a large number of iterations. It gets laggy and often crashes. Python is better in this regard.
  • There is a limited number of hardware options (mostly NI) that can be connected directly to the data acquisition toolbox.
Read full review
Wolfram
  • Should include more libraries and functions.
  • Should include more functions that can be used in Machine Learning.
  • Should include more functions that can be used in Data Science.
Read full review
Usability
Lightning Tools
No answers on this topic
MathWorks
MATLAB is pretty easy to use. You can extend its capabilities using the programming interface. Very flexible capabilities when it comes to graphical presentation of your data (so many different kinds of options for your plotting needs). Anytime you are working with large data sets, or with matrices, MATLAB is likely to be very helpful.
Read full review
Wolfram
No answers on this topic
Support Rating
Lightning Tools
No answers on this topic
MathWorks
The built-in search engine is not as performing as I wish it would be. However, the YouTube channel has a vast library of informative video that can help understanding the software. Also, many other software have a nice bridge into MATLAB, which makes it very versatile. Overall, the support for MATLAB is good.
Read full review
Wolfram
Wolfram Mathematica is a nice software package. It has very nice features and easy to install and use in your machine. Besides this, there is a nice support from Wolfram. They come to the university frequently to give seminars in Mathematica. I think this is the best thing they are doing. That is very helpful for graduate and undergraduate students who are using Mathematica in their research.
Read full review
Alternatives Considered
Lightning Tools
Lightning Tools Data Viewer is much easier and more powerful than Infowise similar viewer in their lineup. In this case, we use Data Viewer over the one offered by Infowise.
Read full review
MathWorks
How MATLAB compares to its competition or similar open access tools like R (programming language) or SciLab is that it's simply more powerful and capable. It embraces a wider spectrum of possibilities for far more fields than any other environment. R, for example, is intended primarily for the area of statistical computing. SciLab, on the other hand, is a similar open access tool that falls very short in its computing capabilities. It's much slower when running larger scripts and isn't documented or supported nearly as well as MATLAB.
Read full review
Wolfram
We have evaluated and are using in some cases the Python language in concert with the Jupyter notebook interface. For UI, we using libraries like React to create visually stunning visualizations of such models. Mathematica compares favorably to this alternative in terms of speed of development. Mathematica compares unfavorably to this alternative in terms of license costs.
Read full review
Return on Investment
Lightning Tools
  • It allows us to do things that would take a great deal more time to duplicate in SharePoint
  • It cuts down on ugly looking built in SP list layouts
  • Users find it easy to access, thus this product is more productive
Read full review
MathWorks
  • MATLAB helps us quickly sort through large sets of data because we keep the same script each time we run an analyzation, making it very efficient to run this whole process.
  • The software makes it super easy for us to create plots that we can then show to investors or clients to display our data.
  • We are also looking to create an app for our product, and we will not be able to do that on MATLAB, therefore creating a limiting issue and a new learning curve for a programming language.
Read full review
Wolfram
  • Easy to solve huge mathematical equations, so it saved time there
  • Doing analysis and plotting graphs is also another plus point
  • Learning is very slow, and it took lot of time to learn its scripting language
Read full review
ScreenShots

Lightning Tools Data Viewer Screenshots
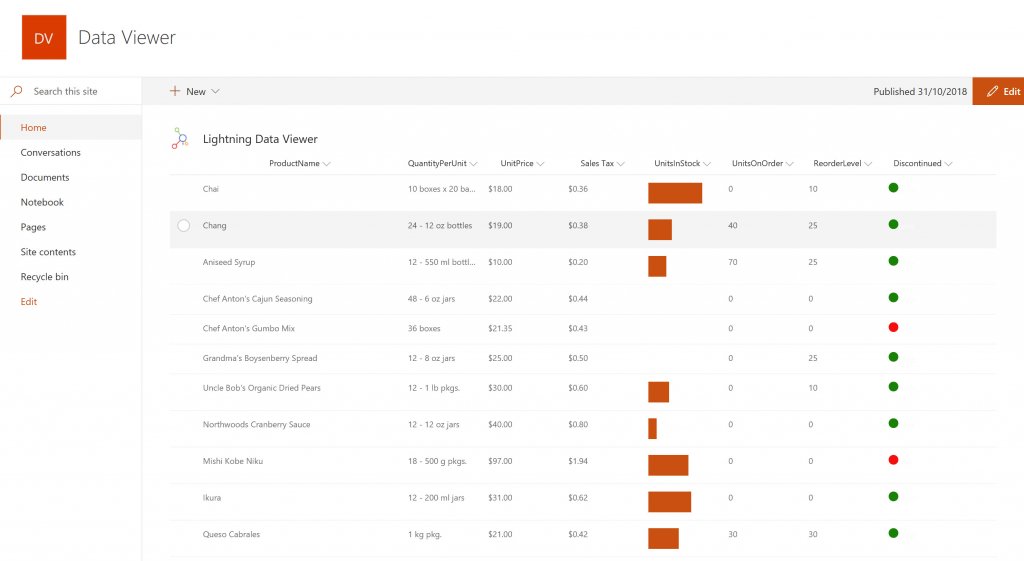
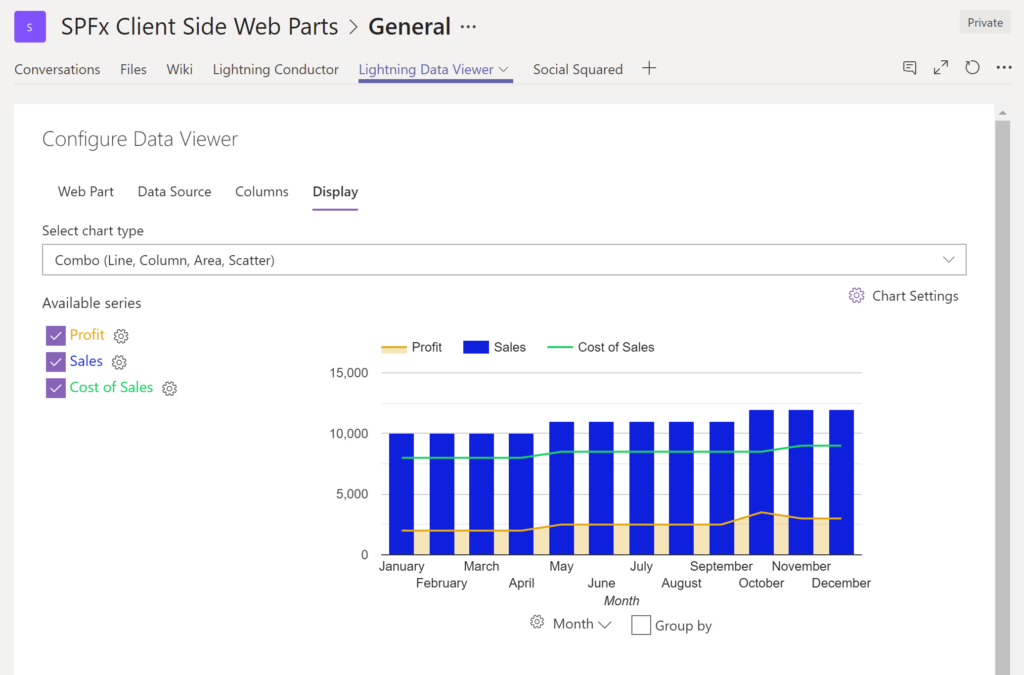
Screenshot of DISPLAYING EXTERNAL DATA WITHIN SHAREPOINT OR MICROSOFT TEAMS
The Data Viewer Client Side Web Part can be configured by Business Users within a few minutes to display Line of Business Data from Data Sources such as Excel,  SQL Azure, Business Connectivity Services, OData and SharePoint Lists.  Connections to an organizations data such as Customer Relationship Management Systems, Accounting Systems, or Custom Databases can be connected, giving business users a live up-to-date view of business information within the context of their SharePoint Team Sites or Microsoft Teams Tabs.Screenshot of HIGHLIGHTING KEY BUSINESS DATA (NO CODE)
Conditional formatting can be used to highlight key business data. Overdue Tasks, Low Stock, Currency Exchange Rates, Sales Revenue are examples of data to highlight visually allowing for a quick reaction time. Key Financial Indicators and Key Performance Indicators can be configured with a simple dialog and no need to write any code. Choose colours, icons or data bars to highlight key data.Screenshot of SELECTING AND STYLING ICONS
Icons can be chosen as part of the conditional formatting to make data stand out. The Office 365 Fabric icons can be selected and styled and applied to cell values. Pepper pots, Smileys, Envelopes and more icons are available. There are hundreds of options to choose from to highlight data that needs to be acted upon.Screenshot of DATA VIEWER CAN BE A GRID OF DATA OR A CHART IN SHAREPOINT OR MICROSOFT TEAMS
The Data Viewer can be used within Microsoft SharePoint Modern Sites or Microsoft Teams Tabs as a Grid of Data with styling or as a Chart which can be configured. The Charting Feature allows for Pie, Donut, Column, Line, Area, and Scatter Charts which can all be configured and displayed in 2D or 3D.Screenshot of TREEMAPS
summary information can be displayed within a TreeMap next to the detail. Users will be able to see trends, and how the business is performing  using the TreeMap view of data.Screenshot of CHARTS AND GAUGES
The Data Viewer is used to represent data in multiple ways using Gauges, TreeMaps, Multiple Series Charts, and Pie Charts.