
Microsoft Power BI vs. Vortini
| Product | Rating | Most Used By | Product Summary | Starting Price |
|---|---|---|---|---|
 Microsoft Power BI | Score8.5 out of 10 | N/A | Microsoft Power BI is a visualization and data discovery tool from Microsoft. It allows users to convert data into visuals and graphics, visually explore and analyze data, collaborate on interactive dashboards and reports, and scale across their organization with built-in governance and security. | $168 per year per user |
 Vortini | N/A | N/A | Vortini is an analytics solution for sales forecasting and business insight. Vortini offers real-time CRM and ERP integration, customizable dashboards, alerts and warnings, built-in forecasting processes, multi-currency support and more. The vendor’s value proposition is that Vortini adds a layer of forecasting intelligence to Salesforce® in a way that is natural for reps and execs alike. Vortini features include: Multi-currency and multi-period sales analysis… | N/A |
| Microsoft Power BI | Vortini | |||||||||||||||
|---|---|---|---|---|---|---|---|---|---|---|---|---|---|---|---|---|
| Editions & Modules |
| No answers on this topic | ||||||||||||||
| Offerings |
| |||||||||||||||
| Entry-level Setup Fee | No setup fee | Required | ||||||||||||||
| Additional Details | Power BI Desktop is the data exploration and report authoring experience for Power BI, and is available as a free download. | — | ||||||||||||||
| More Pricing Information | ||||||||||||||||
| Microsoft Power BI | Vortini | |
|---|---|---|
| Considered Both Products | No answer on this topic | No answer on this topic |
| Key User Insights | ||
| Would buy again | ||
96% Would buy again 110 Answers | No answers on this topic | |
| Delivers good value for the price | ||
97% Delivers good value for the price 103 Answers | No answers on this topic | |
| Happy with the feature set | ||
97% Happy with the feature set 112 Answers | No answers on this topic | |
| Lived up to sales and marketing promises | ||
99% Lived up to sales and marketing promises 69 Answers | No answers on this topic | |
| Implementation went as expected | ||
95% Implementation went as expected 73 Answers | No answers on this topic | |
| Microsoft Power BI | Vortini | ||||||||||||||||||||||
|---|---|---|---|---|---|---|---|---|---|---|---|---|---|---|---|---|---|---|---|---|---|---|---|
| BI Standard Reporting |
| ||||||||||||||||||||||
| Ad-hoc Reporting |
| ||||||||||||||||||||||
| Report Output and Scheduling |
| ||||||||||||||||||||||
| Data Discovery and Visualization |
| ||||||||||||||||||||||
| Access Control and Security |
| ||||||||||||||||||||||
| Mobile Capabilities |
| ||||||||||||||||||||||
| Application Program Interfaces (APIs) / Embedding |
| ||||||||||||||||||||||
| Microsoft Power BI | Vortini | |
|---|---|---|
| Small Businesses |  Cyfe Score4 out of 10 | No answers on this topic |
| Medium-sized Companies |  Qlik Cloud Analytics (Qlik Sense) Score8.2 out of 10 | No answers on this topic |
| Enterprises |  Jaspersoft Community Edition Score7 out of 10 | No answers on this topic |
| All Alternatives | View all alternatives | View all alternatives |
| Microsoft Power BI | Vortini | |
|---|---|---|
| Likelihood to Recommend | 8.6 | - |
| Likelihood to Renew | 9.6 | - |
| Usability | 8.3 | - |
| Support Rating | 10.0 | - |
| Implementation Rating | 9.0 | - |
| Data Sharing and Collaboration | 8.5 | - |
| Data Sources | 9.0 | - |
| Microsoft Power BI | Vortini | |
|---|---|---|
| Likelihood to Recommend |
| No answers on this topic |
| Pros |
| No answers on this topic |
| Cons |
| No answers on this topic |
| Likelihood to Renew |
| No answers on this topic |
| Usability |
| No answers on this topic |
| Support Rating |
| No answers on this topic |
| Implementation Rating |
| No answers on this topic |
| Alternatives Considered |
| No answers on this topic |
| Return on Investment |
| No answers on this topic |
| ScreenShots | Microsoft Power BI Screenshots      | Vortini Screenshots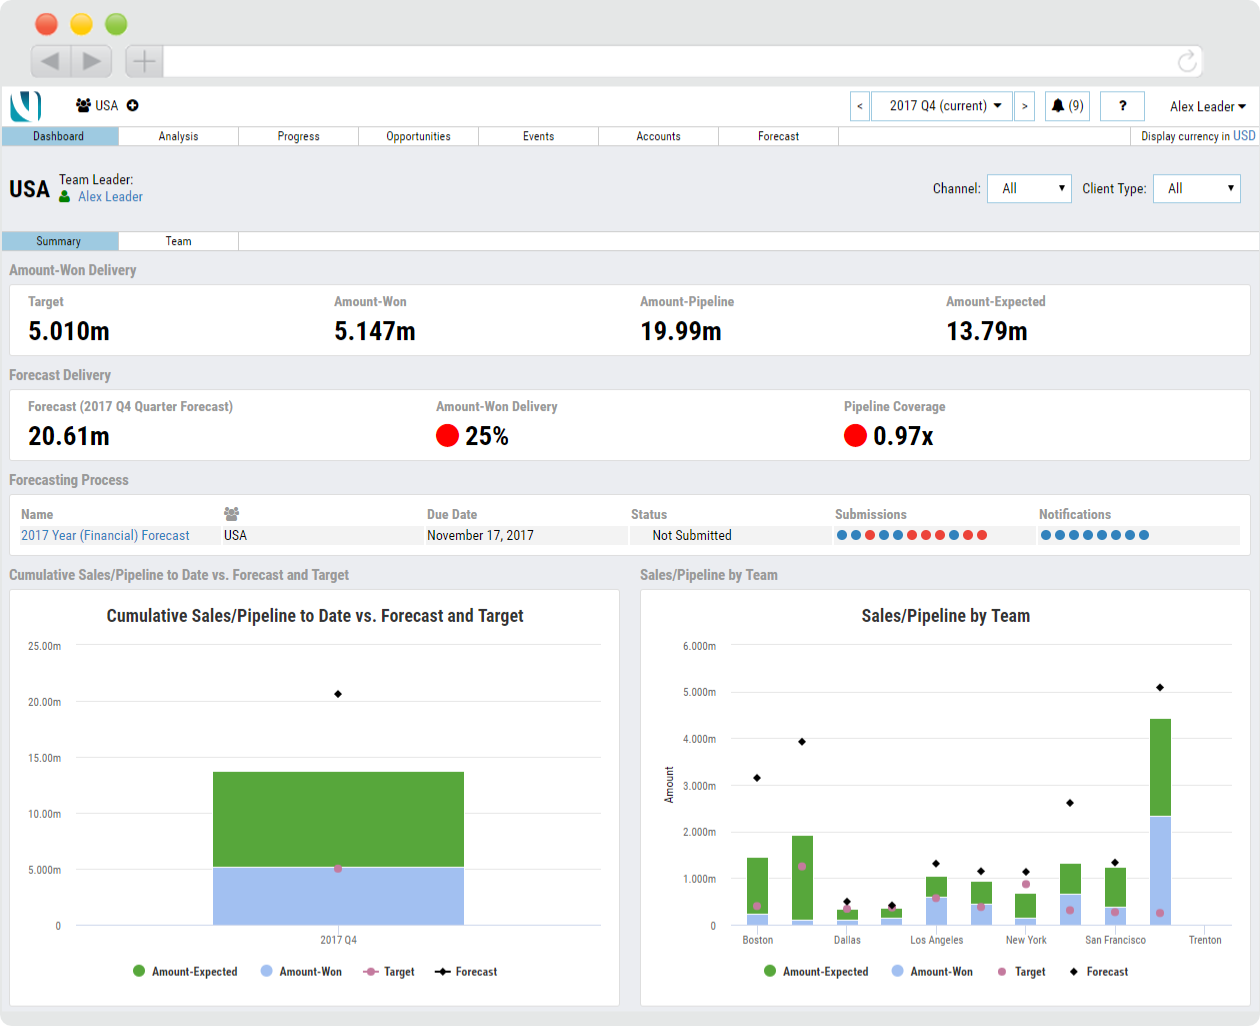   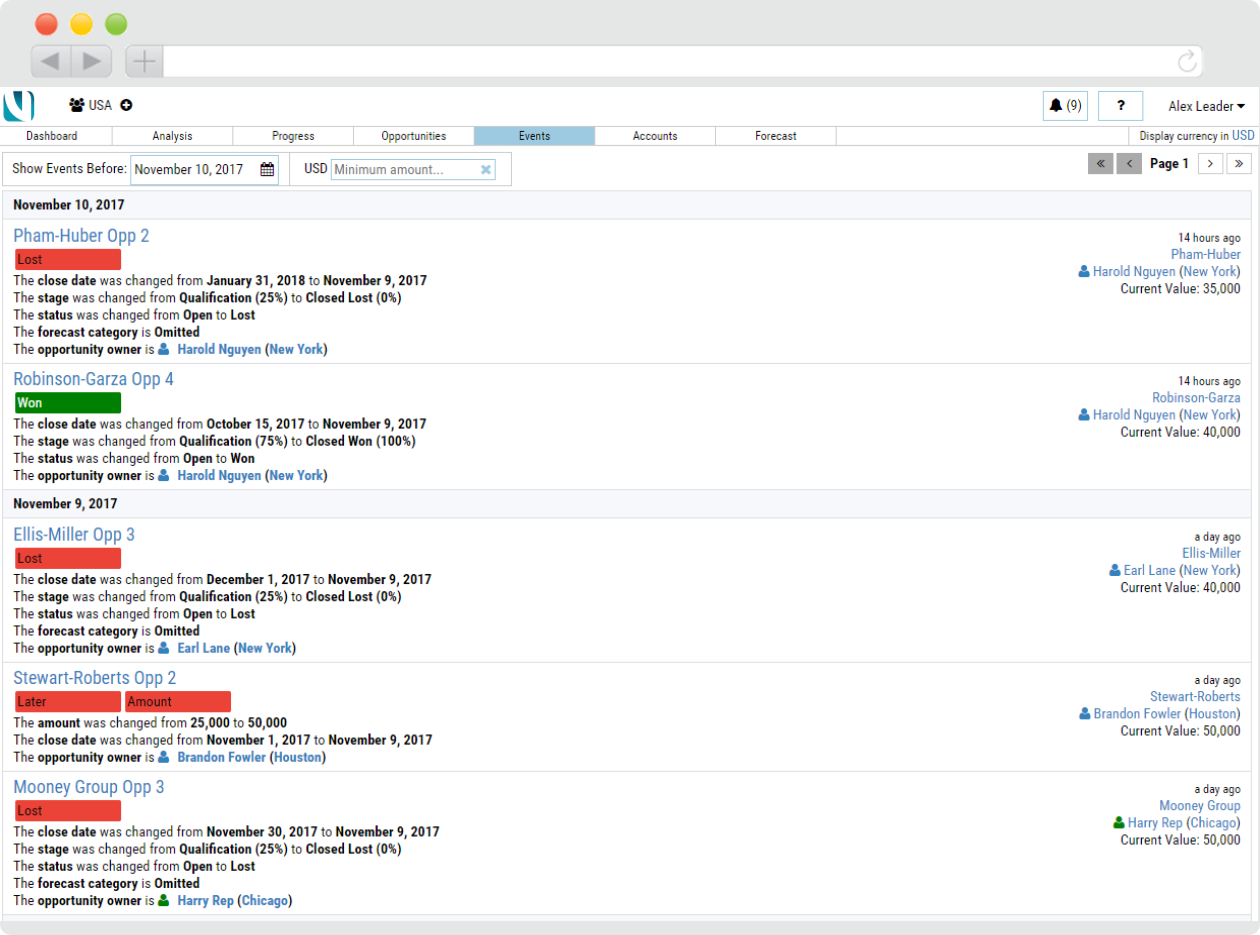  |


