Nagios provides monitoring of all mission-critical infrastructure components. Multiple APIs and community-build add-ons enable integration and monitoring with in-house and third-party applications for optimized scaling.
N/A
Opsview Monitor
Score 6.0 out of 10
N/A
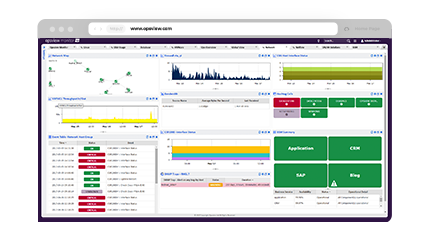
Opsview Monitor is an IT infrastructure and application monitoring solution. It monitors the infrastructure, applications, and endpoints of a network, and supports add-ons for automation and data exporting. Opsview also offers a free version of Monitor.
N/A
Pricing
Nagios Core
Opsview Monitor
Editions & Modules
Single License
Free
Single License
Free
No answers on this topic
Offerings
Pricing Offerings
Nagios Core
Opsview Monitor
Free Trial
Yes
Yes
Free/Freemium Version
Yes
Yes
Premium Consulting/Integration Services
Yes
Yes
Entry-level Setup Fee
No setup fee
Optional
Additional Details
—
—
More Pricing Information
Community Pulse
Nagios Core
Opsview Monitor
Considered Both Products
Nagios Core
Verified User
Professional
Chose Nagios Core
Nagios may not have as much metrics reporting or as many visualizations as the other products, but outdoes the others in ease of configuration and the ability to deliver multi-faceted alerting across a variety of applications, with the help of plugins or with the user …
OpsView is easier to manage and configure than Nagios. Thanks to clear, intuitive and powerfull UI you can add thousands of check in a manner of minutes not hours. It adds user and permission management and ability to create dashboards. It has strong community support and …
Nagios monitoring is well suited for any mission critical application that requires per/second (or minute) monitoring. This would probably include even a shuttle launch. As Nagios was built around Linux, most (85%) plugins are Linux based, therefore its more suitable for a Linux environment.
As Nagios (and dependent components) requires complex configurations & compilations, an experienced Linux engineer would be needed to install all relevant components.
Any company that has hundreds (or thousands) of servers & services to monitor would require a stable monitoring solution like Nagios. I have seen Nagios used in extremely mediocre ways, but the core power lies when its fully configured with all remaining open-source components (i.e. MySQL, Grafana, NRDP etc). Nagios in the hands of an experienced Linux engineer can transform the organizations monitoring by taking preventative measures before a disaster strikes.
If you know Nagios or Nagios-like monitoring systems, OpsView will be really easy for you to learn and manage. Migrations process will be relatively easy. You're getting great U/I that will speed up adding new objects to the system and present data in a clear, organized way. In addition it's easy to create dedicated dashboards for your clients.
Nagios could use core improvements in HA, though, Nagios itself recommends monitoring itself with just another Nagios installation, which has worked fine for us. Given its stability, and this work-around, a minor need.
Nagios could also use improvements, feature wise, to the web gui. There is a lot in Nagios XI which I felt were almost excluded intentionally from the core project. Given the core functionality, a minor need. We have moved admin facing alerts to appear as though they originate from a different service to make interacting with alerts more practical.
We're currently looking to combine a bunch of our network montioring solutions into a single platform. Running multiple unique solutions for monitoring, data collection, compliance reporting etc has become a lot to manage.
The Nagios UI is in need of a complete overhaul. Nice graphics and trendy fonts are easy on the eyes, but the menu system is dated, the lack of built in graphing support is confusing, and the learning curve for a new user is too steep.
I haven't had to use support very often, but when I have, it has been effective in helping to accomplish our goals. Since Nagios has been very popular for a long time, there is also a very large user base from which to learn from and help you get your questions answered.
Because we get all we required in Nagios [Core] and for npm, we have to do lots of configuration as it is not as easy as Comair to Nagios [Core]. On npm UI, there is lots of data, so we are not able to track exact data for analysis, which is why we use Nagios [Core].
With it being a free tool, there is no cost associated with it, so it's very valuable to an organization to get something that is so great and widely used for free.
You can set up as many alerts as you want without incurring any fees.