Nagios XI is an Enterprise Server and Network Monitoring Software, built on Nagios Core and designed to comprehensive application, service, and network monitoring in a central solution. Nagios XI is available in two different editions: Standard Edition and an Enterprise Edition. The Enterprise Edition provides users with additional functionality and includes features that are designed to aid in…
$1,995
Per Instance
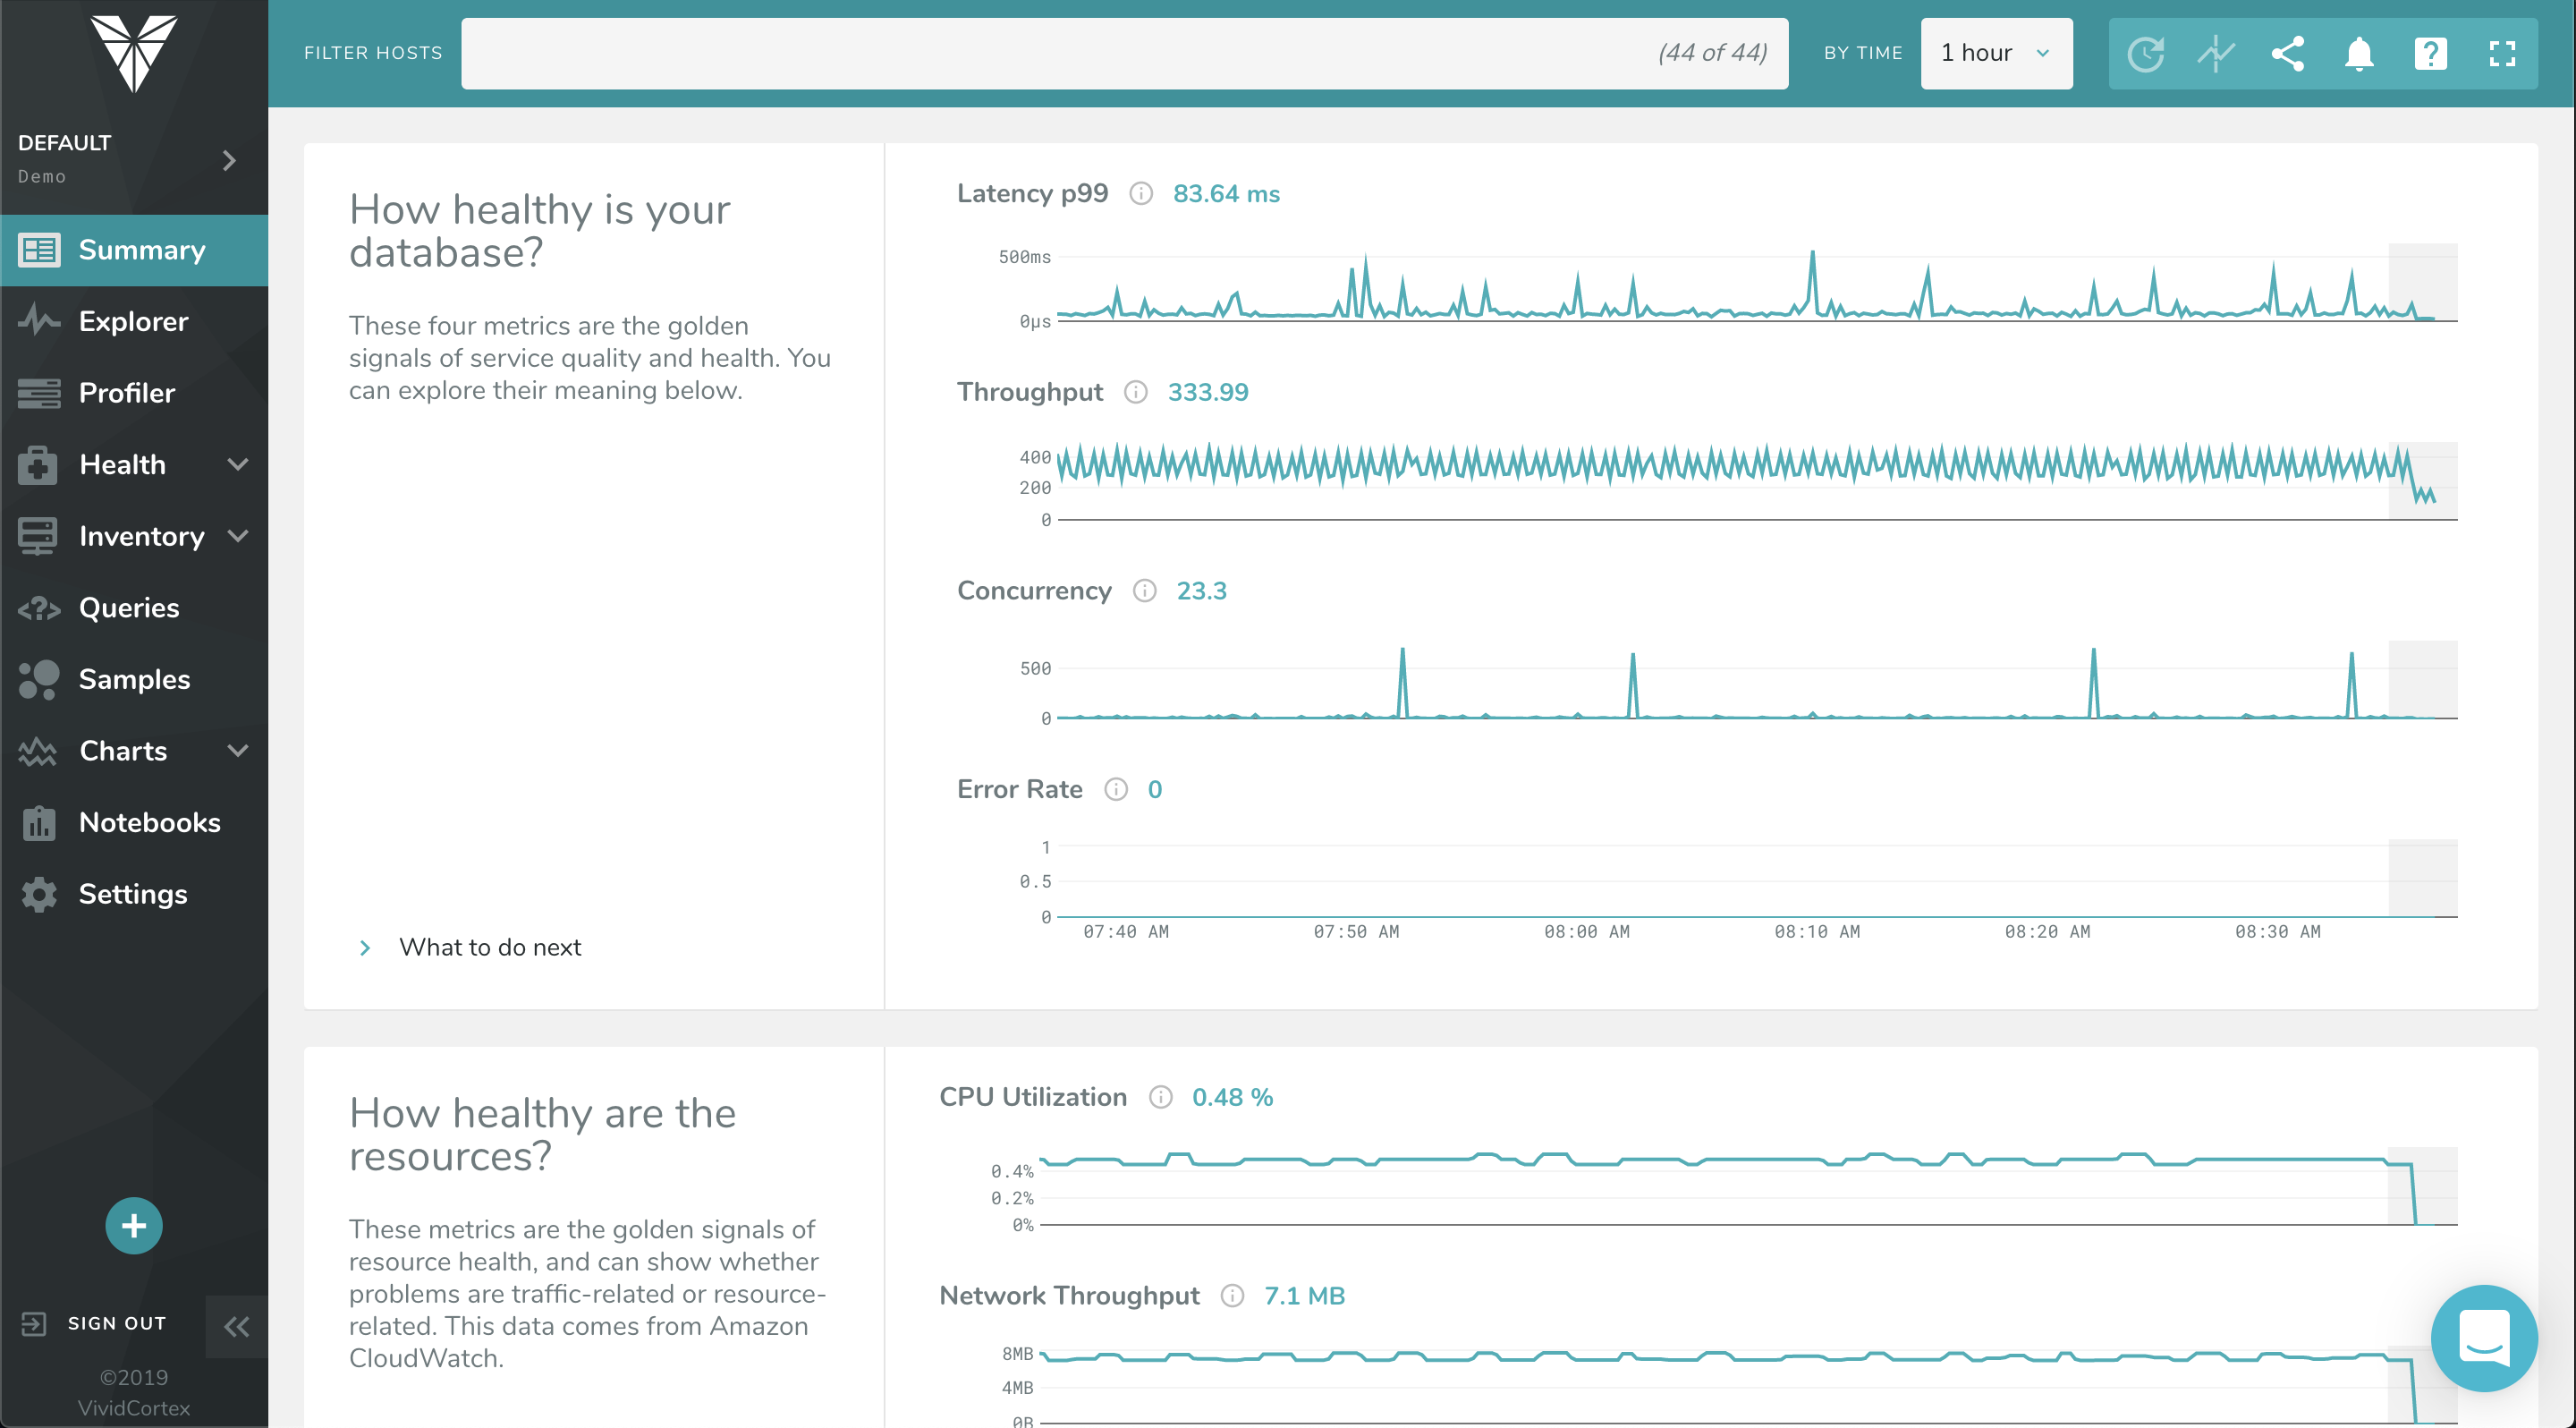
SolarWinds Database Performance Monitor
Score9 out of 10
N/A
VividCortex, acquired by SolarWinds in
December 2019, provides database performance monitoring designed to increase
system performance, team efficiency, and infrastructure cost savings. The GDPR-
and SOC 2-compliant platform offers visibility into major open-source databases—MySQL,
PostgreSQL, Amazon Aurora, MongoDB, and Redis—for the engineering team at
scale. Industry leaders like Etsy, GitHub, SendGrid, and Yelp rely on Database
Performance Monitor for all-query monitoring and drill…
If anyone looking for the monitoring system for the infrastructure this is the go-to tool which monitors all infrastructure related components from server health to Networking and update us with mails and can be easily integrated with multiple other tools as needed for example PagerDuty , Also this suits good both on premises and cloud environments as well. If we are managing complex environment this tool for monitoring is best one.
A de minimis incentive was given to thank the reviewer for their time. The incentive was not used to bias or drive a particular response, nor was the incentive contingent on a positive endorsement. More Info
Computing resources consumed by the DB instance, DPA queries & wait time, deadlock conditions, virtual infrastructure resources. The addition of NPM & DPA integration as well as cross-correlation in the identification of issues with the network or server or DB is all stupid-proof. Monitoring is more than just health and resource consumption, it's also performance. DB performance analysis is key to maintaining healthy DB instances.
A de minimis incentive was given to thank the reviewer for their time. The incentive was not used to bias or drive a particular response, nor was the incentive contingent on a positive endorsement. More Info
A de minimis incentive was given to thank the reviewer for their time. The incentive was not used to bias or drive a particular response, nor was the incentive contingent on a positive endorsement. More Info
A de minimis incentive was given to thank the reviewer for their time. The incentive was not used to bias or drive a particular response, nor was the incentive contingent on a positive endorsement. More Info
A de minimis incentive was given to thank the reviewer for their time. The incentive was not used to bias or drive a particular response, nor was the incentive contingent on a positive endorsement. More Info
A de minimis incentive was given to thank the reviewer for their time. The incentive was not used to bias or drive a particular response, nor was the incentive contingent on a positive endorsement. More Info
This tool has been has been of great use and learning , offering exceptional ease of use, scalability, and detailed reporting. It has a lot of customization options and proactive monitoring which have significantly improved our infrastructure management.It's UI & functions are good. Also has built in templates for various end points.It also provides graphical reports. With a Dashboard you can monitor easily
A de minimis incentive was given to thank the reviewer for their time. The incentive was not used to bias or drive a particular response, nor was the incentive contingent on a positive endorsement. More Info
We are using Nagios XI in our organization primarily for monitoring all our application servers and databases, this is helping us in addressing all the infrastructure issues in advance by alerting us when it any server hits the threshold as per the initial parameter setup also it has free tier which helps for small scale applications monitoring to save some expenses.
A de minimis incentive was given to thank the reviewer for their time. The incentive was not used to bias or drive a particular response, nor was the incentive contingent on a positive endorsement. More Info
I would say it is a very good tool from overall perspective compared to what I have used till now, still I will give it like 9 just for the sake of the interface and the integration which they should be doing soon with the main module which is SAM , NPM etc.
A de minimis incentive was given to thank the reviewer for their time. The incentive was not used to bias or drive a particular response, nor was the incentive contingent on a positive endorsement. More Info
A de minimis incentive was given to thank the reviewer for their time. The incentive was not used to bias or drive a particular response, nor was the incentive contingent on a positive endorsement. More Info
A de minimis incentive was given to thank the reviewer for their time. The incentive was not used to bias or drive a particular response, nor was the incentive contingent on a positive endorsement. More Info
A de minimis incentive was given to thank the reviewer for their time. The incentive was not used to bias or drive a particular response, nor was the incentive contingent on a positive endorsement. More Info
I have been participated in the few implementations, and I would say its bit complex when its come to initial setup once its set post that its easy to manage
A de minimis incentive was given to thank the reviewer for their time. The incentive was not used to bias or drive a particular response, nor was the incentive contingent on a positive endorsement. More Info
Cost efficiency is the main reason which we opted [for] Nagios as we were previously using IDERA tool with comprehensive database monitoring solutions, but the slow performance we are getting while monitoring the instance of the database.
A de minimis incentive was given to thank the reviewer for their time. The incentive was not used to bias or drive a particular response, nor was the incentive contingent on a positive endorsement. More Info
SolarWinds DPA gives you a very deep analysis and monitoring of the devices which these tools will not give you neither Datadog or ManageEngine. It even gives you job rate , db locks and all other parameters to monitor which we usually do manually by going in to the DB and not from the tools. It also creates a dashboard out of the same.
A de minimis incentive was given to thank the reviewer for their time. The incentive was not used to bias or drive a particular response, nor was the incentive contingent on a positive endorsement. More Info
We have installed Nagios XI for our monitoring system and with this we are managing around 600 servers in total and not seen any major issues with its scalability we can scale it as much as we require and also installed on various applications servers and working as expected
A de minimis incentive was given to thank the reviewer for their time. The incentive was not used to bias or drive a particular response, nor was the incentive contingent on a positive endorsement. More Info
A de minimis incentive was given to thank the reviewer for their time. The incentive was not used to bias or drive a particular response, nor was the incentive contingent on a positive endorsement. More Info
A de minimis incentive was given to thank the reviewer for their time. The incentive was not used to bias or drive a particular response, nor was the incentive contingent on a positive endorsement. More Info