NETSCOUT TruView vs. Pandora FMS
NETSCOUT TruView vs. Pandora FMS
| Product | Rating | Most Used By | Product Summary | Starting Price |
|---|---|---|---|---|
 TruView | N/A | NETSCOUT TruView is a unified network monitoring and APM tool. TruView is deployed as hardware on-premises, and it can automate capacity planning and environment discovery and configuration. | N/A | |
 Pandora FMS | Enterprise companies (1,001+ employees) | Pandora FMS is a flexible monitoring solution. It is presented as ideal for medium and big-sized environments with at least 100 devices. Users can monitor any device, infrastructure, application, IT as well as business processes and services. It allows business users to obtain information from their concerns in real time, visualizing the data in a direct way. The solution boasts users among companies and organizations in more than 40 countries around the world, who according to the… | $2,990 100 nodes |
| NETSCOUT TruView | Pandora FMS | |||||||||||||||
|---|---|---|---|---|---|---|---|---|---|---|---|---|---|---|---|---|
| Editions & Modules | No answers on this topic |
| ||||||||||||||
| Offerings |
| |||||||||||||||
| Entry-level Setup Fee | No setup fee | Required | ||||||||||||||
| Additional Details | — | Licensed for individual nodes (agents), starting from 100 nodes. | ||||||||||||||
| More Pricing Information | ||||||||||||||||
| NETSCOUT TruView | Pandora FMS | |
|---|---|---|
| Top Pros | ||
| Top Cons |
|
|
| NETSCOUT TruView | Pandora FMS | |||||||||||||||||||||||||||||||||
|---|---|---|---|---|---|---|---|---|---|---|---|---|---|---|---|---|---|---|---|---|---|---|---|---|---|---|---|---|---|---|---|---|---|---|
| Network Performance Monitoring |
|
| NETSCOUT TruView | Pandora FMS | |
|---|---|---|
| Small Businesses |  NinjaOne Score 9.2 out of 10 | NinjaOne Score 9.2 out of 10 |
| Medium-sized Companies |  Nmap Score 8.8 out of 10 |  PingPlotter Score 9.4 out of 10 |
| Enterprises | Nmap Score 8.8 out of 10 | Nmap Score 8.8 out of 10 |
| All Alternatives | View all alternatives | View all alternatives |
| NETSCOUT TruView | Pandora FMS | |
|---|---|---|
| Likelihood to Recommend | 10.0 (2 ratings) | 9.1 (1 ratings) |
| Support Rating | 10.0 (1 ratings) | 9.1 (1 ratings) |
| NETSCOUT TruView | Pandora FMS | |
|---|---|---|
| Likelihood to Recommend |  NETSCOUT
 Claudio Hoffer Security Specialist | Pandora FMS LLC
 Guillermo Sanchez CEO, CTO & Co-Fundador |
| Pros | NETSCOUT
 Victor Arana IT Manager | Pandora FMS LLC
Guillermo Sanchez CEO, CTO & Co-Fundador |
| Cons | NETSCOUT
Claudio Hoffer Security Specialist | Pandora FMS LLC
Guillermo Sanchez CEO, CTO & Co-Fundador |
| Support Rating | NETSCOUT
Claudio Hoffer Security Specialist | Pandora FMS LLC
Guillermo Sanchez CEO, CTO & Co-Fundador |
| Alternatives Considered | NETSCOUT
Victor Arana IT Manager | Pandora FMS LLC
Guillermo Sanchez CEO, CTO & Co-Fundador |
| Return on Investment | NETSCOUT
Victor Arana IT Manager | Pandora FMS LLC
Guillermo Sanchez CEO, CTO & Co-Fundador |
| ScreenShots | Pandora FMS Screenshots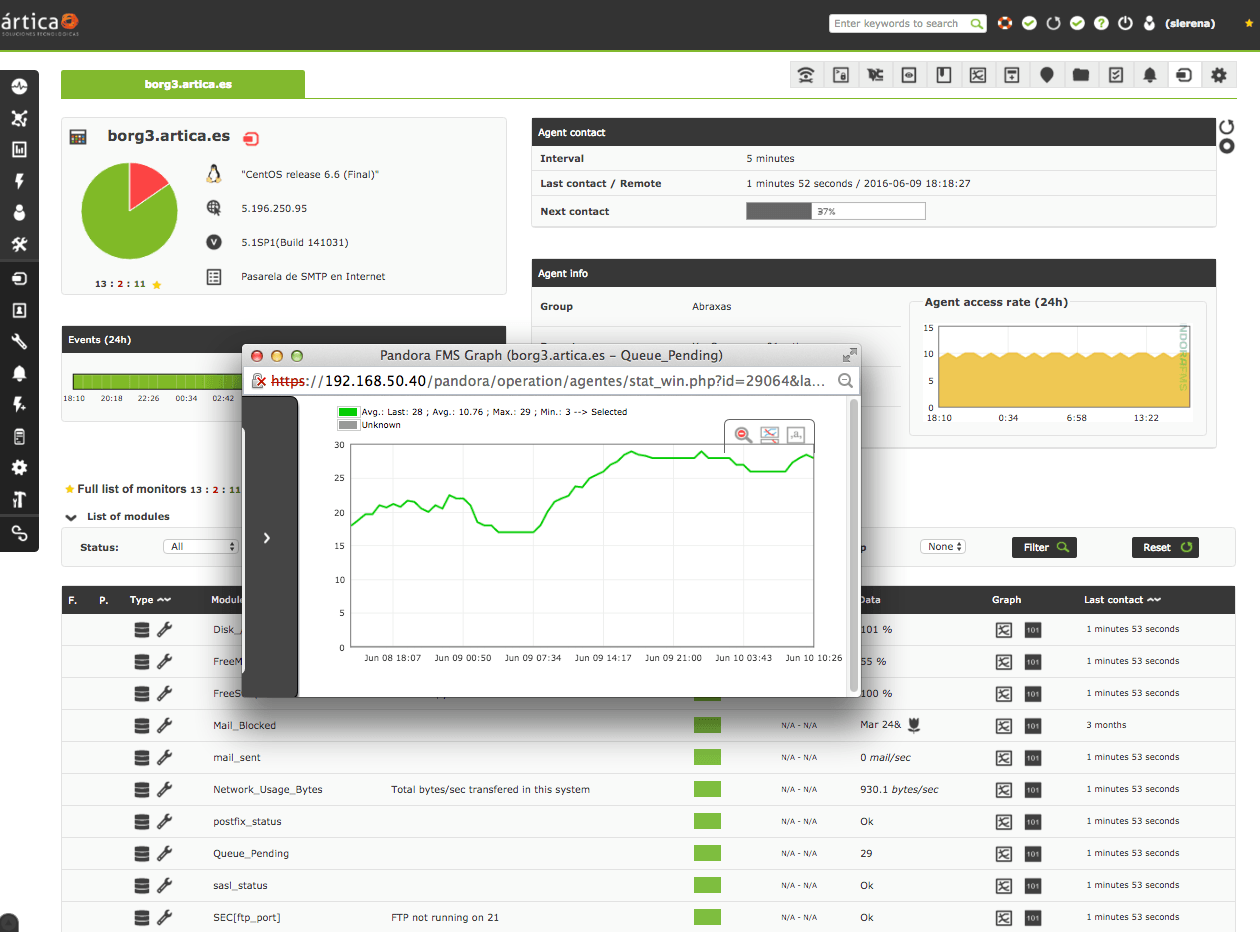   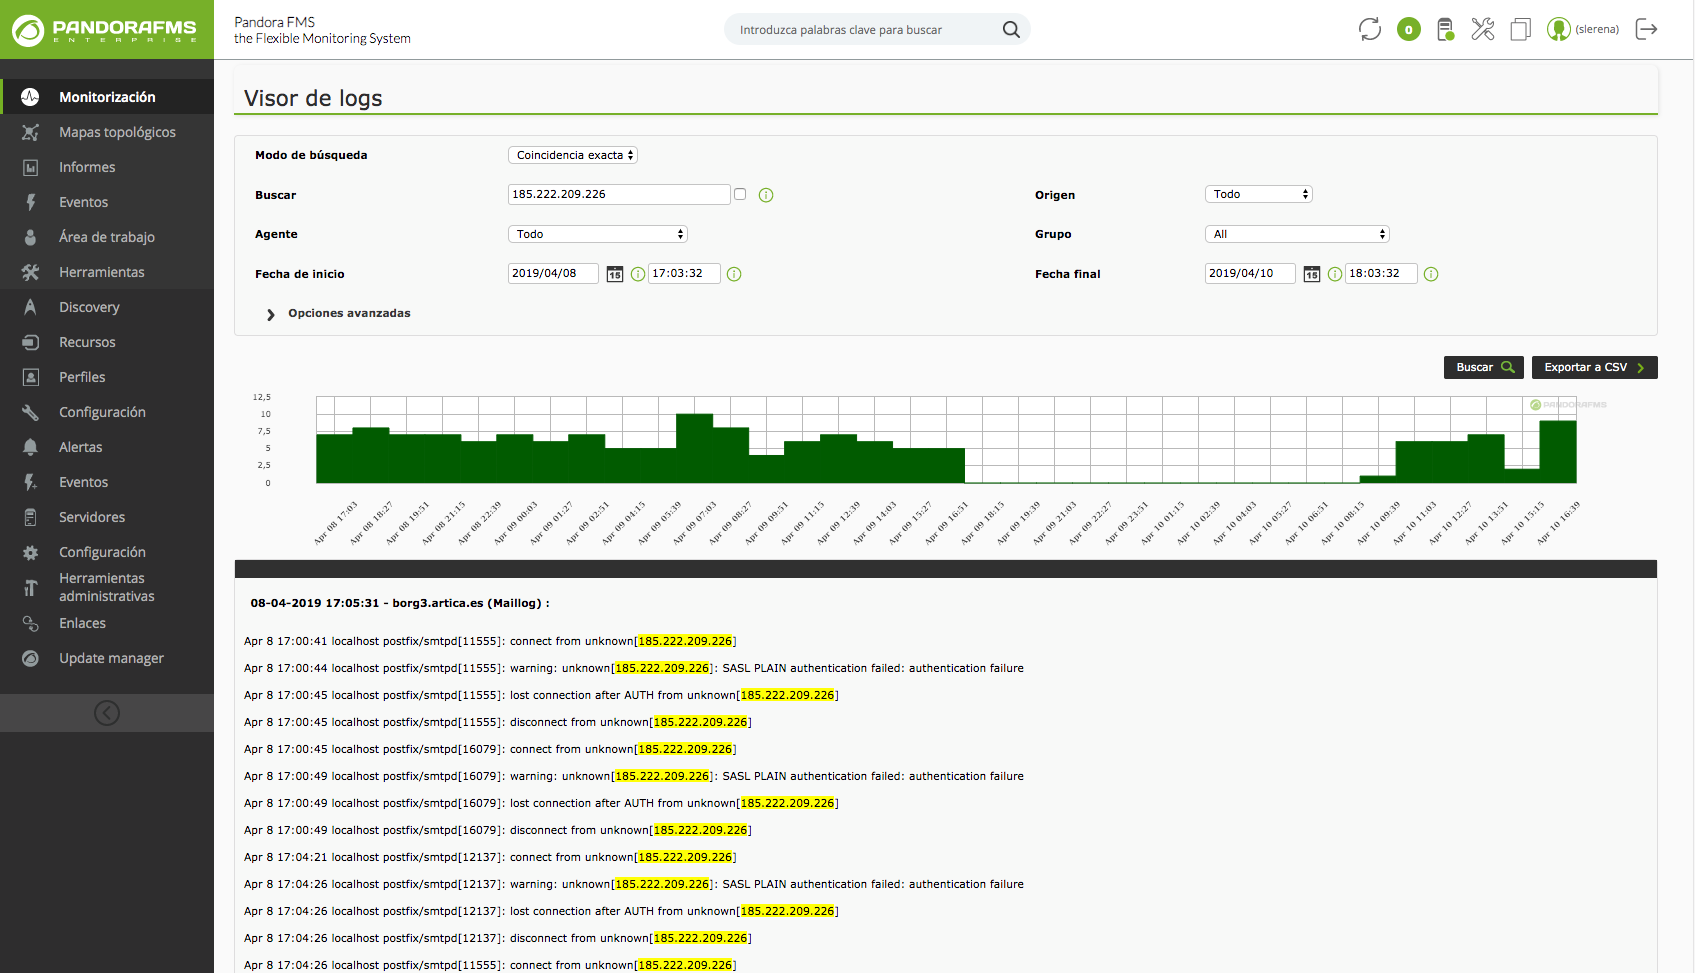   |