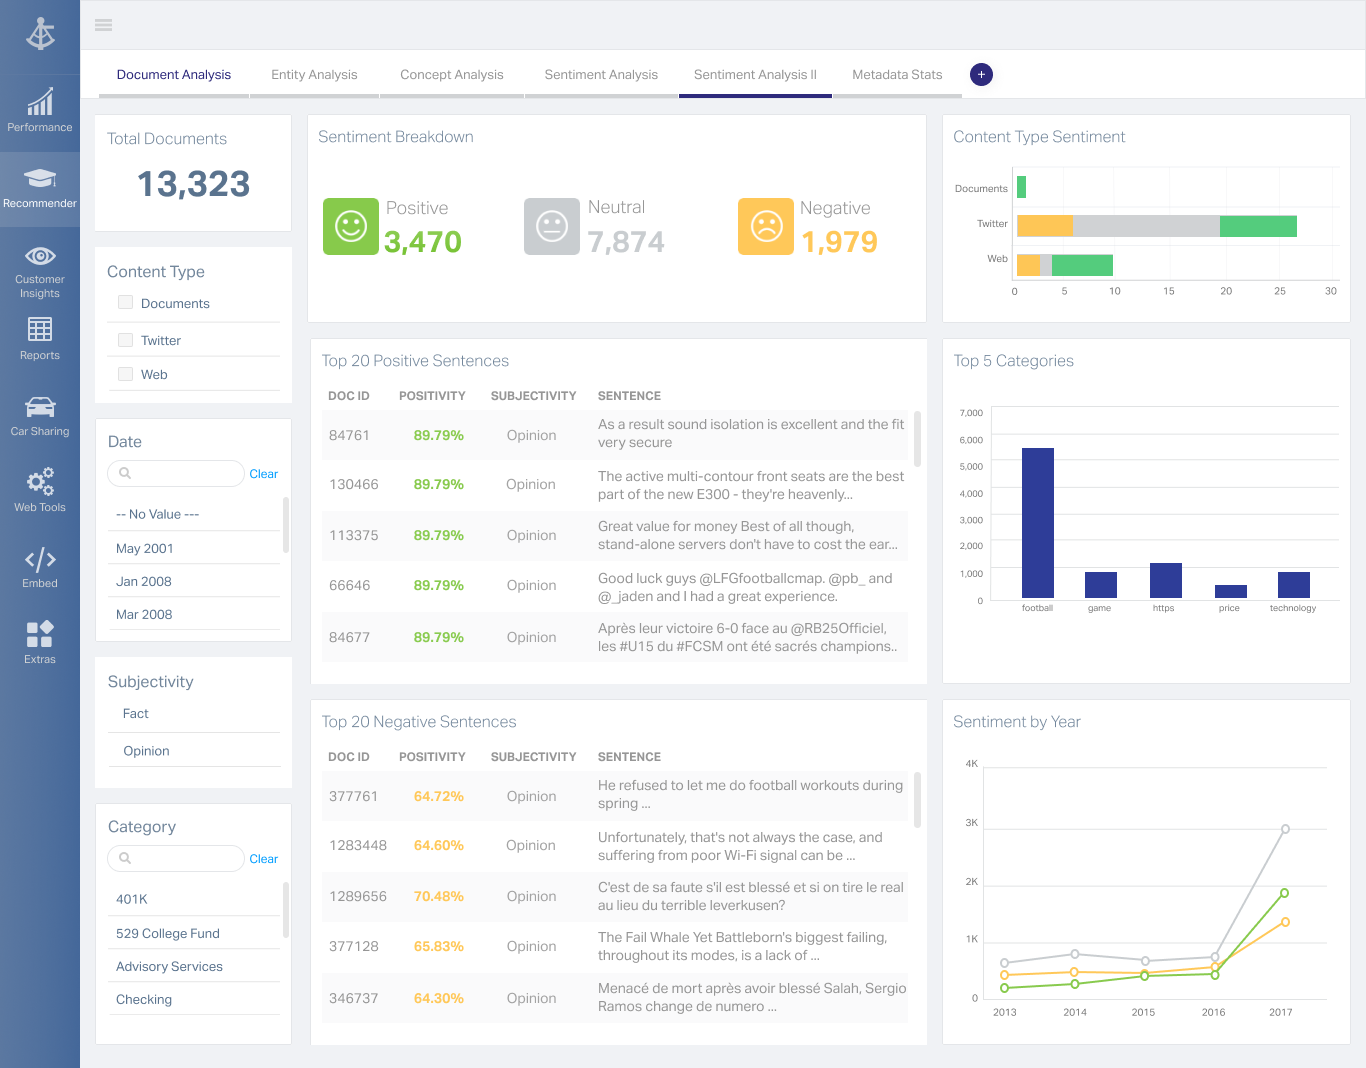
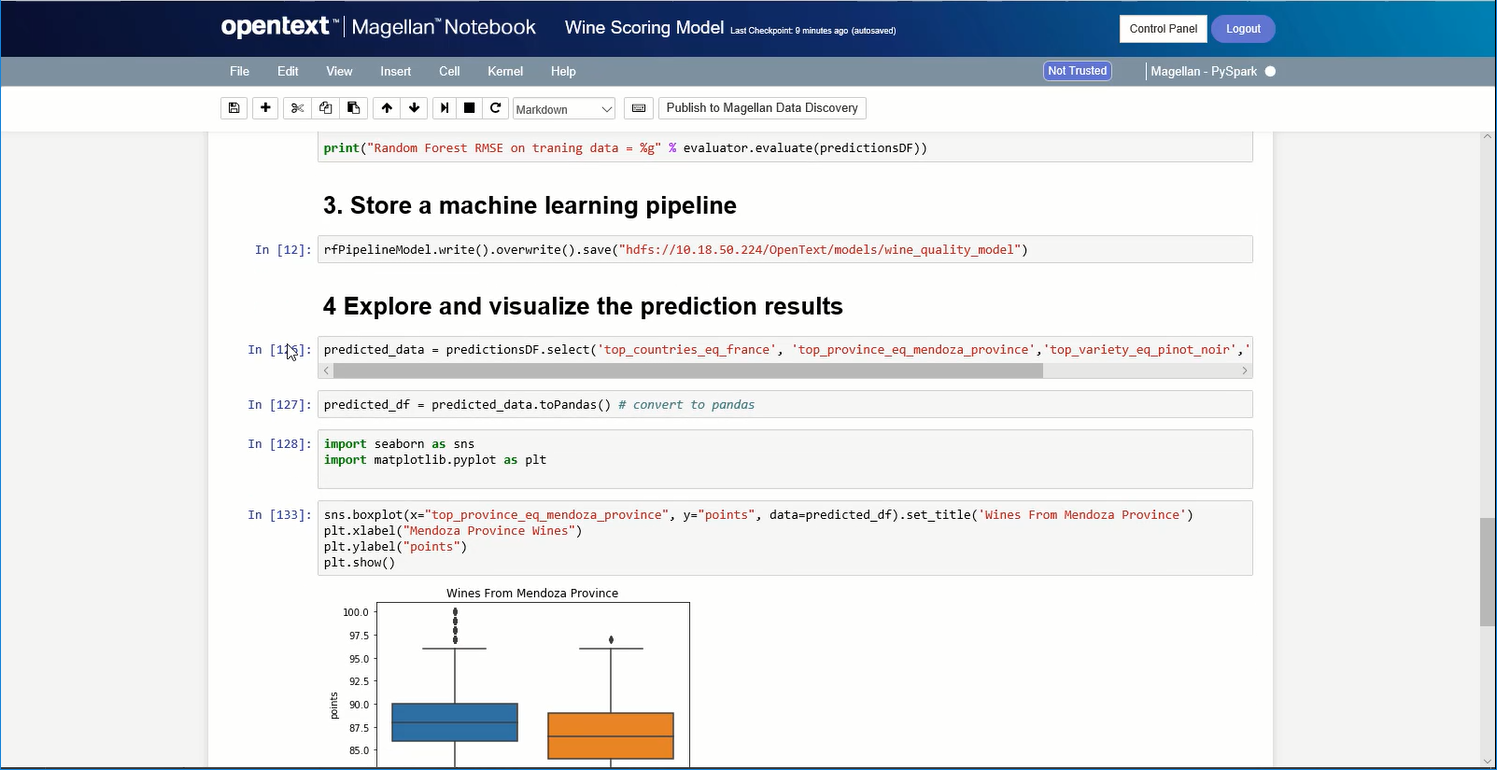
OpenText Magellan Analytics Suite leverages a comprehensive set of data analytics software to identify patterns, relationships and trends through data visualizations and interactive dashboards.
N/A
Q Research Software
Score10 out of 10
N/A
Q Research Software, a division of Displayr, offers a predictive analytics application for marketers, designed to be easier to use by automating correct statistical to use, drag-and-drop interface for building models, and the ability to read many types of files (e.g. SPSS data files) and able to output the desired file type for presentation, with graphics.
N/A
Pricing
OpenText Magellan
Q Research Software
Editions & Modules
No answers on this topic
No answers on this topic
Offerings
Pricing Offerings
OpenText Magellan
Q Research Software
Free Trial
No
No
Free/Freemium Version
No
No
Premium Consulting/Integration Services
No
No
Entry-level Setup Fee
No setup fee
No setup fee
Additional Details
—
—
More Pricing Information
Features
OpenText Magellan
Q Research Software
BI Standard Reporting
Comparison of BI Standard Reporting features of OpenText Magellan and Q Research Software
Feature
OpenText Magellan
7.0
2 Ratings
15% below category average
Q Research Software
-
Ratings
Customizable dashboards
7.02 Ratings
00 Ratings
Report Formatting Templates
7.01 Ratings
00 Ratings
Ad-hoc Reporting
Comparison of Ad-hoc Reporting features of OpenText Magellan and Q Research Software
Feature
OpenText Magellan
8.3
3 Ratings
4% above category average
Q Research Software
-
Ratings
Drill-down analysis
8.03 Ratings
00 Ratings
Formatting capabilities
8.03 Ratings
00 Ratings
Integration with R or other statistical packages
9.01 Ratings
00 Ratings
Report sharing and collaboration
8.02 Ratings
00 Ratings
Report Output and Scheduling
Comparison of Report Output and Scheduling features of OpenText Magellan and Q Research Software
Feature
OpenText Magellan
8.3
2 Ratings
1% above category average
Q Research Software
-
Ratings
Publish to Web
8.02 Ratings
00 Ratings
Publish to PDF
8.02 Ratings
00 Ratings
Report Versioning
9.02 Ratings
00 Ratings
Report Delivery Scheduling
8.02 Ratings
00 Ratings
Data Discovery and Visualization
Comparison of Data Discovery and Visualization features of OpenText Magellan and Q Research Software
If you do not have a large budget and are a large organization, I would steer clear of Actuate. If you are looking to do very complex washboarding, I would not use them. Your developers have to be very skilled to work with this. Plan to bring in consultants if necessary to help your process. Adhoc reporting is weak. If your pricing is user based and you expand, this could be very expensive.
We use Q for quantitative data. If you know what you are doing it can still take a bit of time to manipulate your data into the most suitable format for the software to help you. But it is time well spent because once it's set up, Q makes the analysis a breeze. We use it for producing data tables, word clouds, significance testing, audience segmentation and coding of open-responses.
A de minimis incentive was given to thank the reviewer for their time. The incentive was not used to bias or drive a particular response, nor was the incentive contingent on a positive endorsement. More Info
A de minimis incentive was given to thank the reviewer for their time. The incentive was not used to bias or drive a particular response, nor was the incentive contingent on a positive endorsement. More Info
A de minimis incentive was given to thank the reviewer for their time. The incentive was not used to bias or drive a particular response, nor was the incentive contingent on a positive endorsement. More Info
A de minimis incentive was given to thank the reviewer for their time. The incentive was not used to bias or drive a particular response, nor was the incentive contingent on a positive endorsement. More Info
The pricing model is a little restrictive for smaller teams that only really need one license but have to buy a 2nd to help out modest users/users learning the ropes.
Learning the basics can take quite a bit of time but they offer plenty of free resources that help you through it step-by-step
A de minimis incentive was given to thank the reviewer for their time. The incentive was not used to bias or drive a particular response, nor was the incentive contingent on a positive endorsement. More Info
I am no longer working for the company that was using Actuate but I believe they would continue to use it because the stitching costs would be to high. It would require a complete rewrite of the reports and the never version of Actuate (BIRT) even required an almost complete report rewrite
A de minimis incentive was given to thank the reviewer for their time. The incentive was not used to bias or drive a particular response, nor was the incentive contingent on a positive endorsement. More Info
It is quite intuitive to use. It is fit specifically for doing sentiment, emotion, and intention analysis as well as text classification and text summarization. I would have given 10 if it is fit for the purpose of doing image processing and analysis as well. There is a huge market to analyze video and image data.
A de minimis incentive was given to thank the reviewer for their time. The incentive was not used to bias or drive a particular response, nor was the incentive contingent on a positive endorsement. More Info
It is vastly superior to these in many ways, for complex reporting it is a much more sophisticated solution. Visualizations are very good. Javascript extensibility is very powerful, others don't support this or as well. Pentaho and MS are both OLAP oriented. Pentaho is moving more toward big data, which was not our primary focus. Others are stuck in the Crystal Reports Band metaphor.
We still use Excel in order to use Q, but all the analysis happens in Q. No need to learn formulas or reformat spreadsheets. Q does all the heavy lifting.
A de minimis incentive was given to thank the reviewer for their time. The incentive was not used to bias or drive a particular response, nor was the incentive contingent on a positive endorsement. More Info
Actuate can handle 50 to 60 sub reports inside a report very well.
Dynamically creating the datasource, chart, graph, reports are the main advantages. We can do any level of drilling, and can create a performance matrix dashboard efficiently.
A de minimis incentive was given to thank the reviewer for their time. The incentive was not used to bias or drive a particular response, nor was the incentive contingent on a positive endorsement. More Info