
Plotly Chart Studio vs. SAP Lumira Discovery
| Product | Rating | Most Used By | Product Summary | Starting Price |
|---|---|---|---|---|
 Plotly Chart Studio | Score8 out of 10 | N/A | Plotly headquartered in Montreal offers Chart Studio, a data visualization tool with an open source and free cloud editions, as well as enterprise editions deployable on-cloud or on-premise. The vendor describes Chart Studio as a sophisticated editor for creating D3.js and WebGL charts. | $99 per month |
 SAP Lumira Discovery | Score8.4 out of 10 | N/A | SAP Lumira Discovery is SAP’s data visualization and discovery application. It facilitates data discovery, visualization, and analysis by assisting users with creation of dashboards, infographics, presentations, data facets, tag clouds, and more. | $185 per user |
| Plotly Chart Studio | SAP Lumira Discovery | |||||||||||||||
|---|---|---|---|---|---|---|---|---|---|---|---|---|---|---|---|---|
| Editions & Modules |
|
| ||||||||||||||
| Offerings |
| |||||||||||||||
| Entry-level Setup Fee | No setup fee | No setup fee | ||||||||||||||
| Additional Details | — | — | ||||||||||||||
| More Pricing Information | ||||||||||||||||
| Plotly Chart Studio | SAP Lumira Discovery | |
|---|---|---|
| Considered Both Products | No answer on this topic | No answer on this topic |
| Key User Insights | ||
| Would buy again | ||
No answers on this topic | 80% Would buy again 8 Answers | |
| Delivers good value for the price | ||
No answers on this topic | 86% Delivers good value for the price 6 Answers | |
| Happy with the feature set | ||
No answers on this topic | 90% Happy with the feature set 9 Answers | |
| Lived up to sales and marketing promises | ||
No answers on this topic | 83% Lived up to sales and marketing promises 5 Answers | |
| Implementation went as expected | ||
No answers on this topic | 86% Implementation went as expected 6 Answers | |
| Plotly Chart Studio | SAP Lumira Discovery | ||||||||||||||||
|---|---|---|---|---|---|---|---|---|---|---|---|---|---|---|---|---|---|
| BI Standard Reporting |
| ||||||||||||||||
| Ad-hoc Reporting |
| ||||||||||||||||
| Data Discovery and Visualization |
| ||||||||||||||||
| Report Output and Scheduling |
| ||||||||||||||||
| Plotly Chart Studio | SAP Lumira Discovery | |
|---|---|---|
| Small Businesses |  Chartio (discontinued) Score7.5 out of 10 |  Cyfe Score4 out of 10 |
| Medium-sized Companies |  Jet Reports Score9.5 out of 10 |  Qlik Cloud Analytics (Qlik Sense) Score8.1 out of 10 |
| Enterprises |  Kibana Score8.4 out of 10 |  Jaspersoft Community Edition Score7 out of 10 |
| All Alternatives | View all alternatives | View all alternatives |
| Plotly Chart Studio | SAP Lumira Discovery | |
|---|---|---|
| Likelihood to Recommend | 8.0 | 9.0 |
| Likelihood to Renew | - | 6.0 |
| Usability | - | 8.0 |
| Availability | - | 5.0 |
| Performance | - | 4.0 |
| Support Rating | - | 1.0 |
| In-Person Training | - | 6.0 |
| Online Training | - | 6.0 |
| Implementation Rating | - | 4.0 |
| Configurability | - | 4.0 |
| Data Sharing and Collaboration | - | 2.0 |
| Data Sources | - | 10.0 |
| Ease of integration | - | 4.0 |
| Product Scalability | - | 4.0 |
| Professional Services | - | 5.0 |
| Vendor post-sale | - | 8.0 |
| Vendor pre-sale | - | 5.0 |
| Plotly Chart Studio | SAP Lumira Discovery | |
|---|---|---|
| Likelihood to Recommend |
|
|
| Pros |
|
|
| Cons |
|
|
| Likelihood to Renew | No answers on this topic |
|
| Usability | No answers on this topic |
|
| Reliability and Availability | No answers on this topic |
|
| Performance | No answers on this topic |
|
| Support Rating | No answers on this topic |
|
| In-Person Training | No answers on this topic |
|
| Online Training | No answers on this topic |
|
| Implementation Rating | No answers on this topic |
|
| Alternatives Considered | Incentivized |
|
| Scalability | No answers on this topic |
|
| Return on Investment |
|
|
| ScreenShots | SAP Lumira Discovery Screenshots 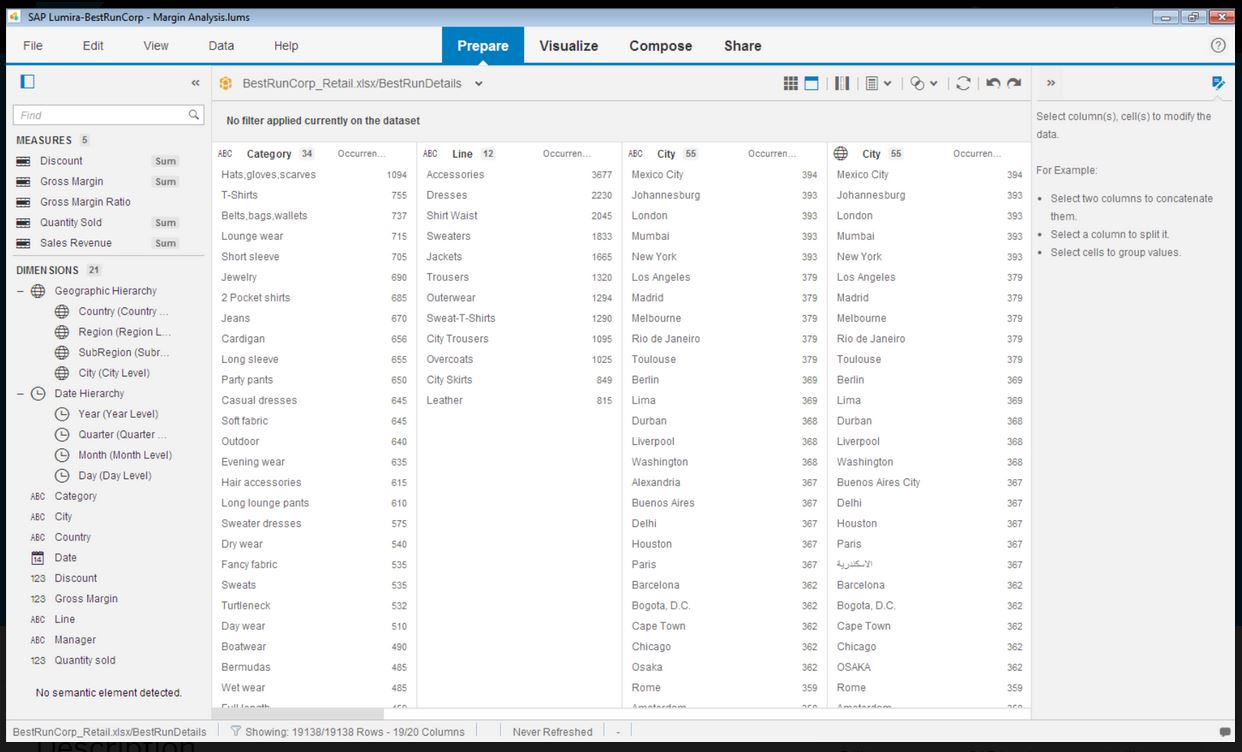     |


