Chose Solver
Flexibility in the creation of dashboard and more robust.
| Product | Rating | Most Used By | Product Summary | Starting Price |
|---|---|---|---|---|
 Solver | N/A | Solver is a cloud-based extended financial planning and analysis solution (xFP&A) that increases access to actionable insights beyond the finance department to accelerate intelligent decisions. | N/A | |
 Tableau Desktop | N/A | Tableau Desktop is a data visualization product from Tableau. It connects to a variety of data sources for combining disparate data sources without coding. It provides tools for discovering patterns and insights, data calculations, forecasts, and statistical summaries and visual storytelling. | $1,380 per year (purchased via a Creator license) |
| Solver | Tableau Desktop | |||||||||||||||
|---|---|---|---|---|---|---|---|---|---|---|---|---|---|---|---|---|
| Editions & Modules | No answers on this topic |
| ||||||||||||||
| Offerings |
| |||||||||||||||
| Entry-level Setup Fee | No setup fee | No setup fee | ||||||||||||||
| Additional Details | Solver has not provided pricing information for this product or service. This is common practice for software sellers and service providers. Contact Solver to obtain current pricing. | All pricing plans are billed annually. A Creator license includes Tableau Desktop, Tableau Prep Builder, and Tableau Pulse. Discounts sometimes available for volume. | ||||||||||||||
| More Pricing Information | ||||||||||||||||
| Solver | Tableau Desktop | |
|---|---|---|
| Considered Both Products | Solver |  Tableau Desktop No answer on this topic |
| Solver | Tableau Desktop | |||||||||||||||||||||
|---|---|---|---|---|---|---|---|---|---|---|---|---|---|---|---|---|---|---|---|---|---|---|
| BI Standard Reporting |
| |||||||||||||||||||||
| Ad-hoc Reporting |
| |||||||||||||||||||||
| Report Output and Scheduling |
| |||||||||||||||||||||
| Data Discovery and Visualization |
| |||||||||||||||||||||
| Access Control and Security |
| |||||||||||||||||||||
| Mobile Capabilities |
| |||||||||||||||||||||
| Application Program Interfaces (APIs) / Embedding |
|
| Solver | Tableau Desktop | |
|---|---|---|
| Small Businesses | No answers on this topic |  Yellowfin Score 8.7 out of 10 |
| Medium-sized Companies |  Cube Score 9.6 out of 10 |  Reveal Score 10.0 out of 10 |
| Enterprises |  OneStream Score 8.8 out of 10 |  Kyvos Semantic Layer Score 9.5 out of 10 |
| All Alternatives | View all alternatives | View all alternatives |
| Solver | Tableau Desktop | |
|---|---|---|
| Likelihood to Recommend | 10.0 (2 ratings) | 8.8 (203 ratings) |
| Likelihood to Renew | - (0 ratings) | 7.5 (41 ratings) |
| Usability | - (0 ratings) | 8.3 (73 ratings) |
| Availability | - (0 ratings) | 10.0 (11 ratings) |
| Performance | - (0 ratings) | 8.0 (10 ratings) |
| Support Rating | - (0 ratings) | 1.0 (57 ratings) |
| In-Person Training | - (0 ratings) | 9.4 (4 ratings) |
| Online Training | - (0 ratings) | 8.0 (5 ratings) |
| Implementation Rating | - (0 ratings) | 8.0 (34 ratings) |
| Configurability | - (0 ratings) | 7.0 (3 ratings) |
| Ease of integration | - (0 ratings) | 10.0 (1 ratings) |
| Product Scalability | - (0 ratings) | 9.0 (4 ratings) |
| Vendor post-sale | - (0 ratings) | 10.0 (1 ratings) |
| Vendor pre-sale | - (0 ratings) | 10.0 (1 ratings) |
| Solver | Tableau Desktop | |
|---|---|---|
| Likelihood to Recommend | Solver
| Tableau
 Karol Kozłowski Project manager |
| Pros | Solver
| Tableau
 Afia Tamanna Information Technology Business Consultant |
| Cons | Solver
| Tableau
|
| Likelihood to Renew | Solver No answers on this topic | Tableau
|
| Usability | Solver No answers on this topic | Tableau
 Al Mubassir Muin Software Engineer |
| Reliability and Availability | Solver No answers on this topic | Tableau
 Brad Llewellyn Associate Data Analytics Consultant |
| Performance | Solver No answers on this topic | Tableau
|
| Support Rating | Solver No answers on this topic | Tableau
|
| In-Person Training | Solver No answers on this topic | Tableau
 Jon Boeckenstedt Associate Vice President |
| Online Training | Solver No answers on this topic | Tableau
|
| Implementation Rating | Solver No answers on this topic | Tableau
 David Fickes Decision Sciences - Modeling, Simulation & Analysis |
| Alternatives Considered | Solver
| Tableau
|
| Scalability | Solver No answers on this topic | Tableau
|
| Return on Investment | Solver
| Tableau
|
| ScreenShots | Solver Screenshots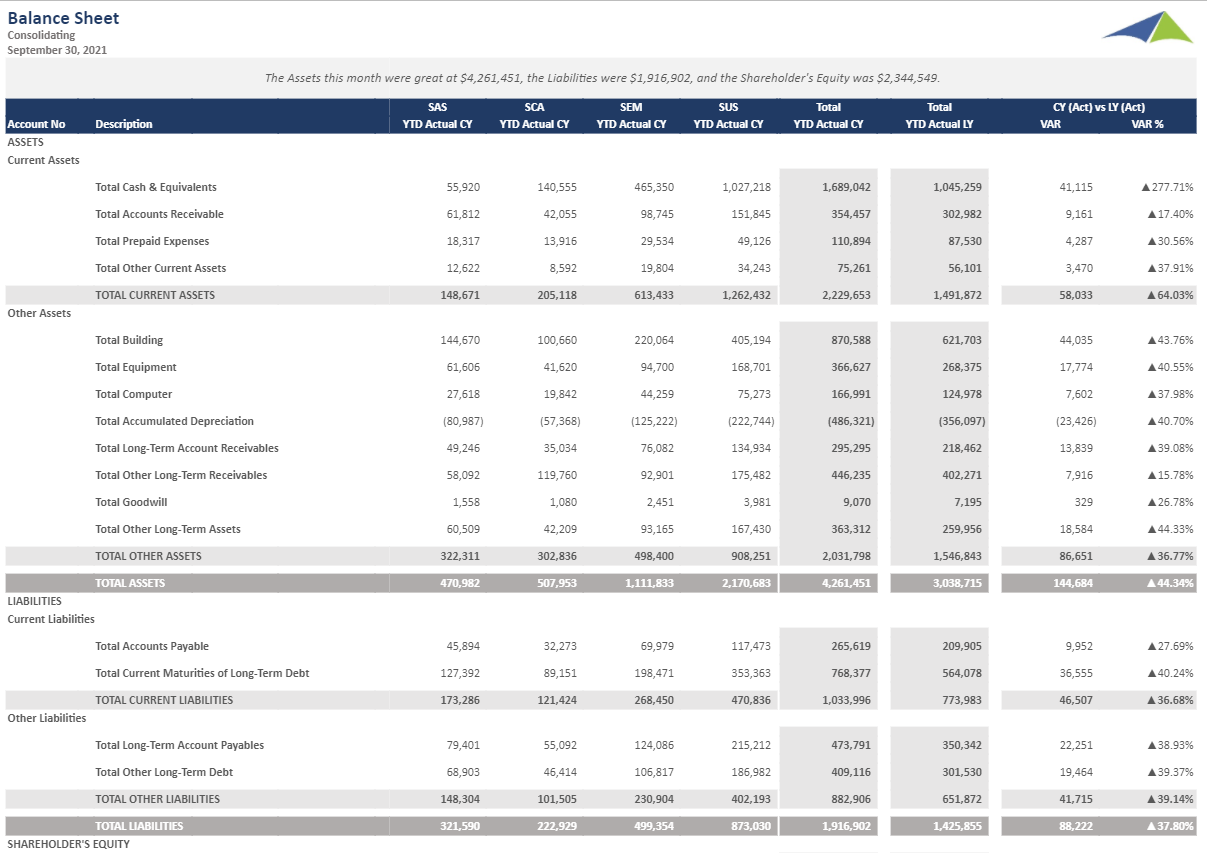 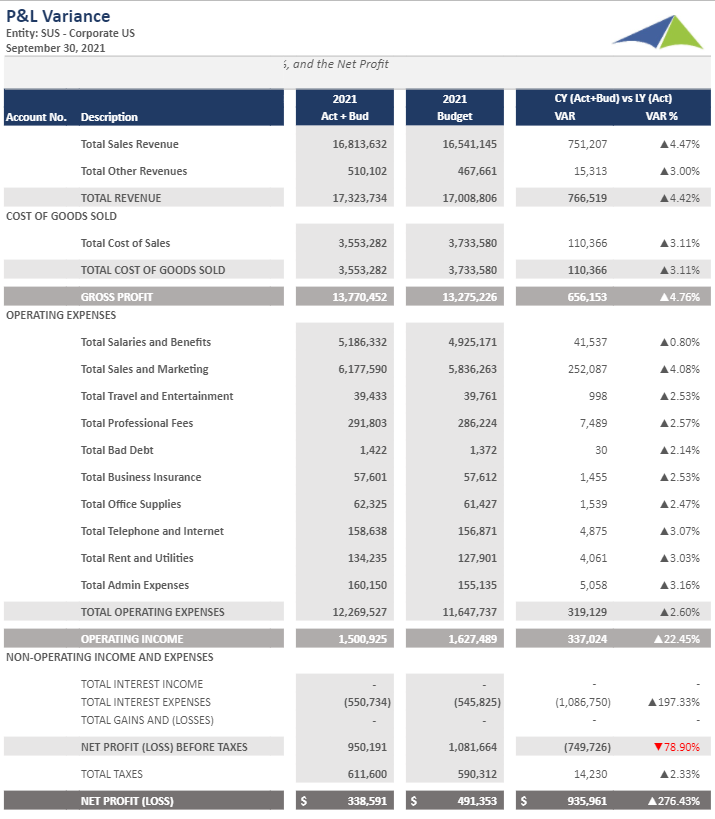 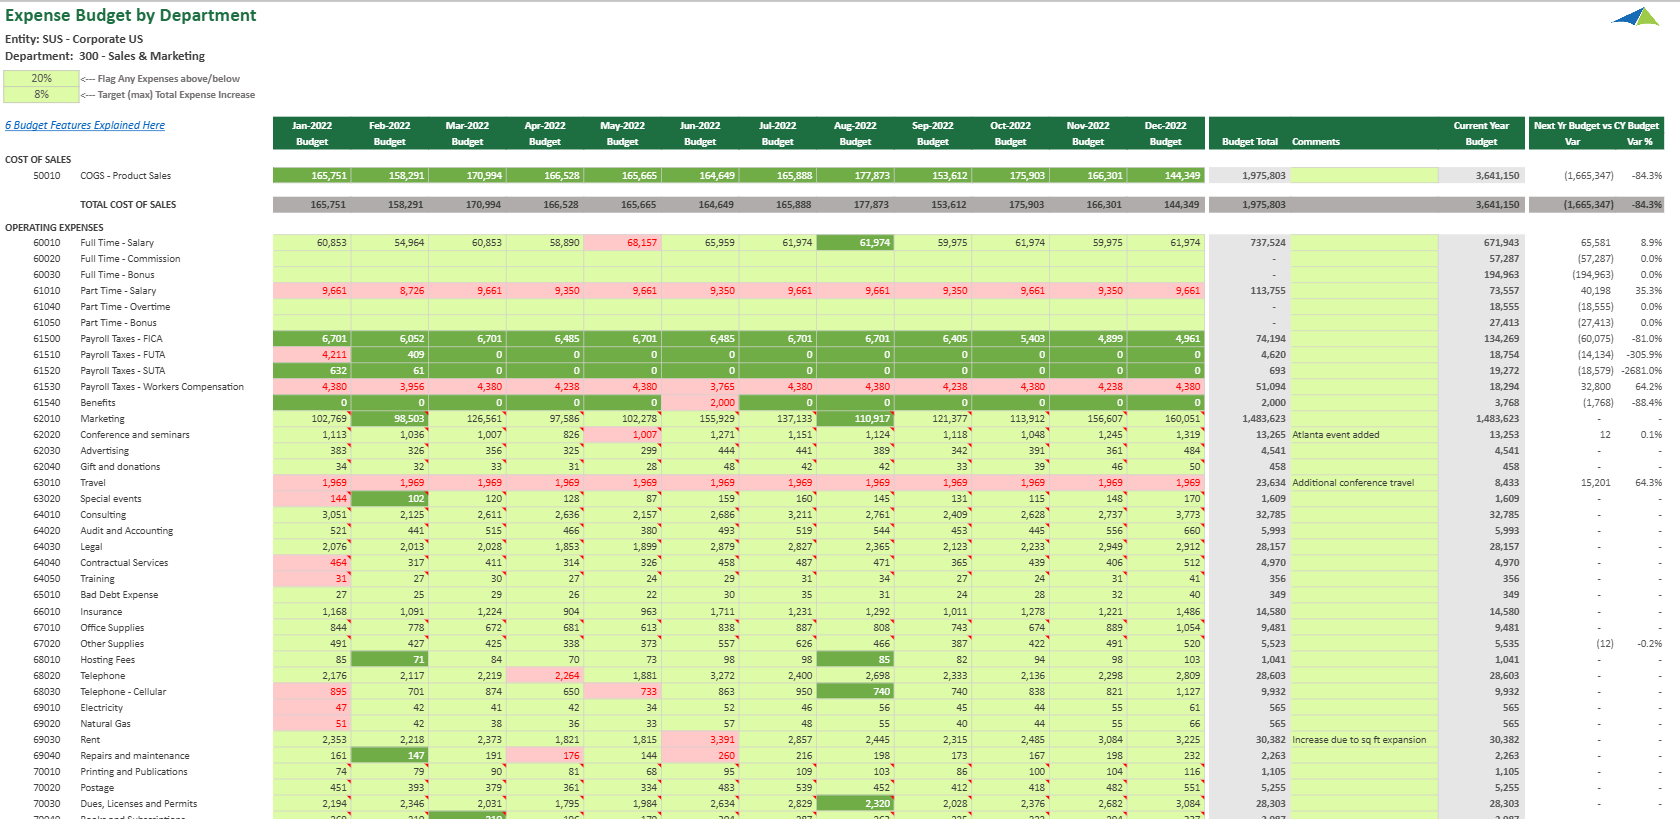 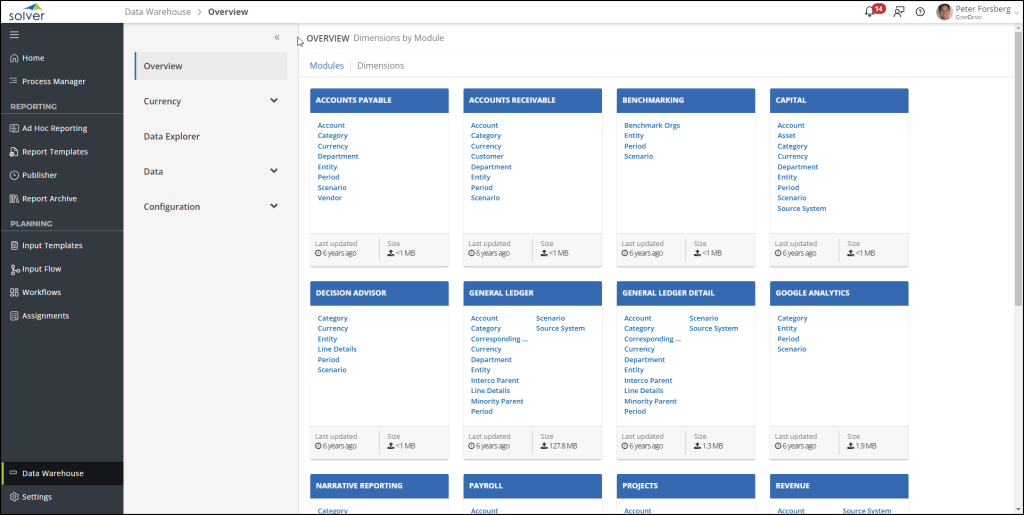 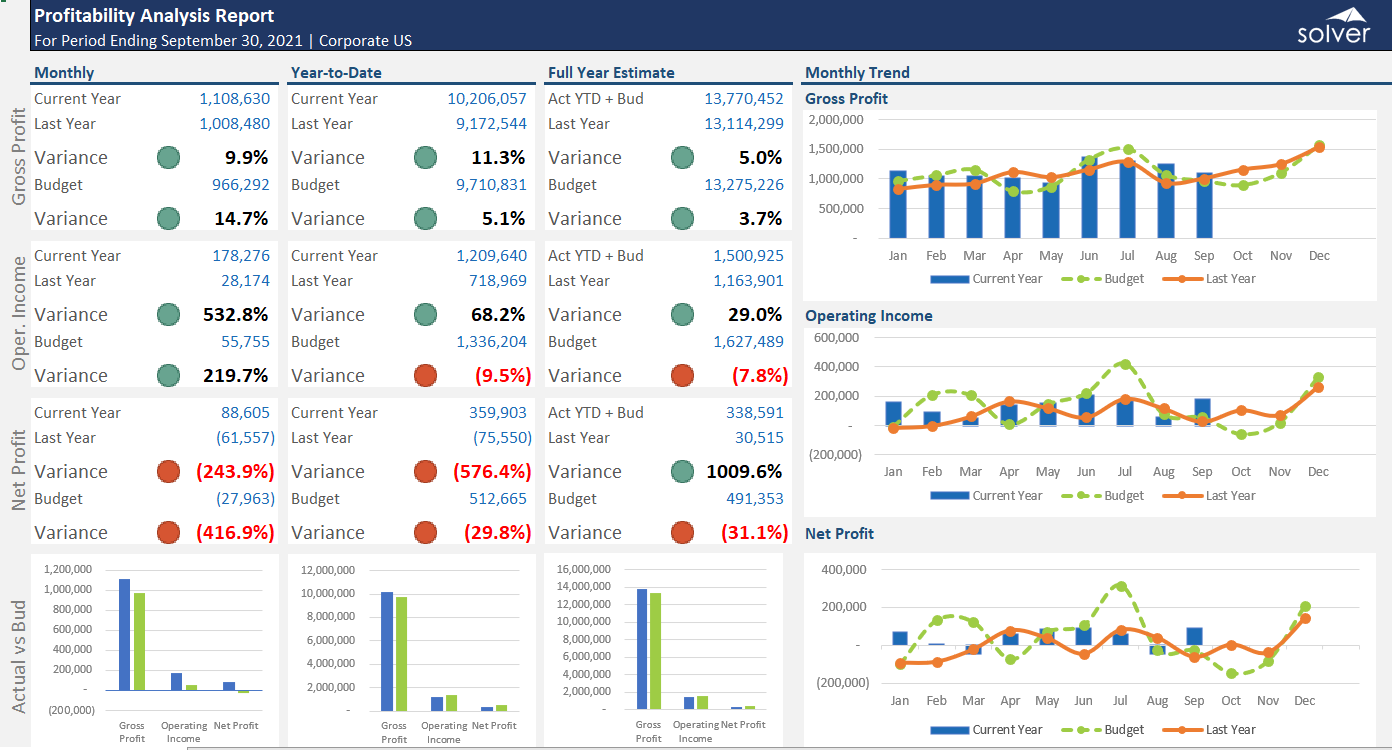 |