TrustRadius: an HG Insights company

IBM SPSS Statistics

Score8 out of 10

450 Reviews and Ratings

What is IBM SPSS Statistics?

SPSS Statistics is a software package used for statistical analysis. It is now officially named "IBM SPSS Statistics". Companion products in the same family are used for survey authoring and deployment (IBM SPSS Data Collection), data mining (IBM SPSS Modeler), text analytics, and collaboration and deployment (batch and automated scoring services).

Read more details.

Media

Screenshot of SPSS Statistics Forecasting. This enables users to build time-series forecasts regardless of their skill level.
Screenshot of SPSS Statistics Regression. These predict categorical outcomes and apply nonlinear regression procedures.
Screenshot of IBM SPSS Statistics Neural Networks. These can discover complex relationships and improve predictive models.
Screenshot of IBM SPSS Statistics Curated Help. These can interpret correlation output.
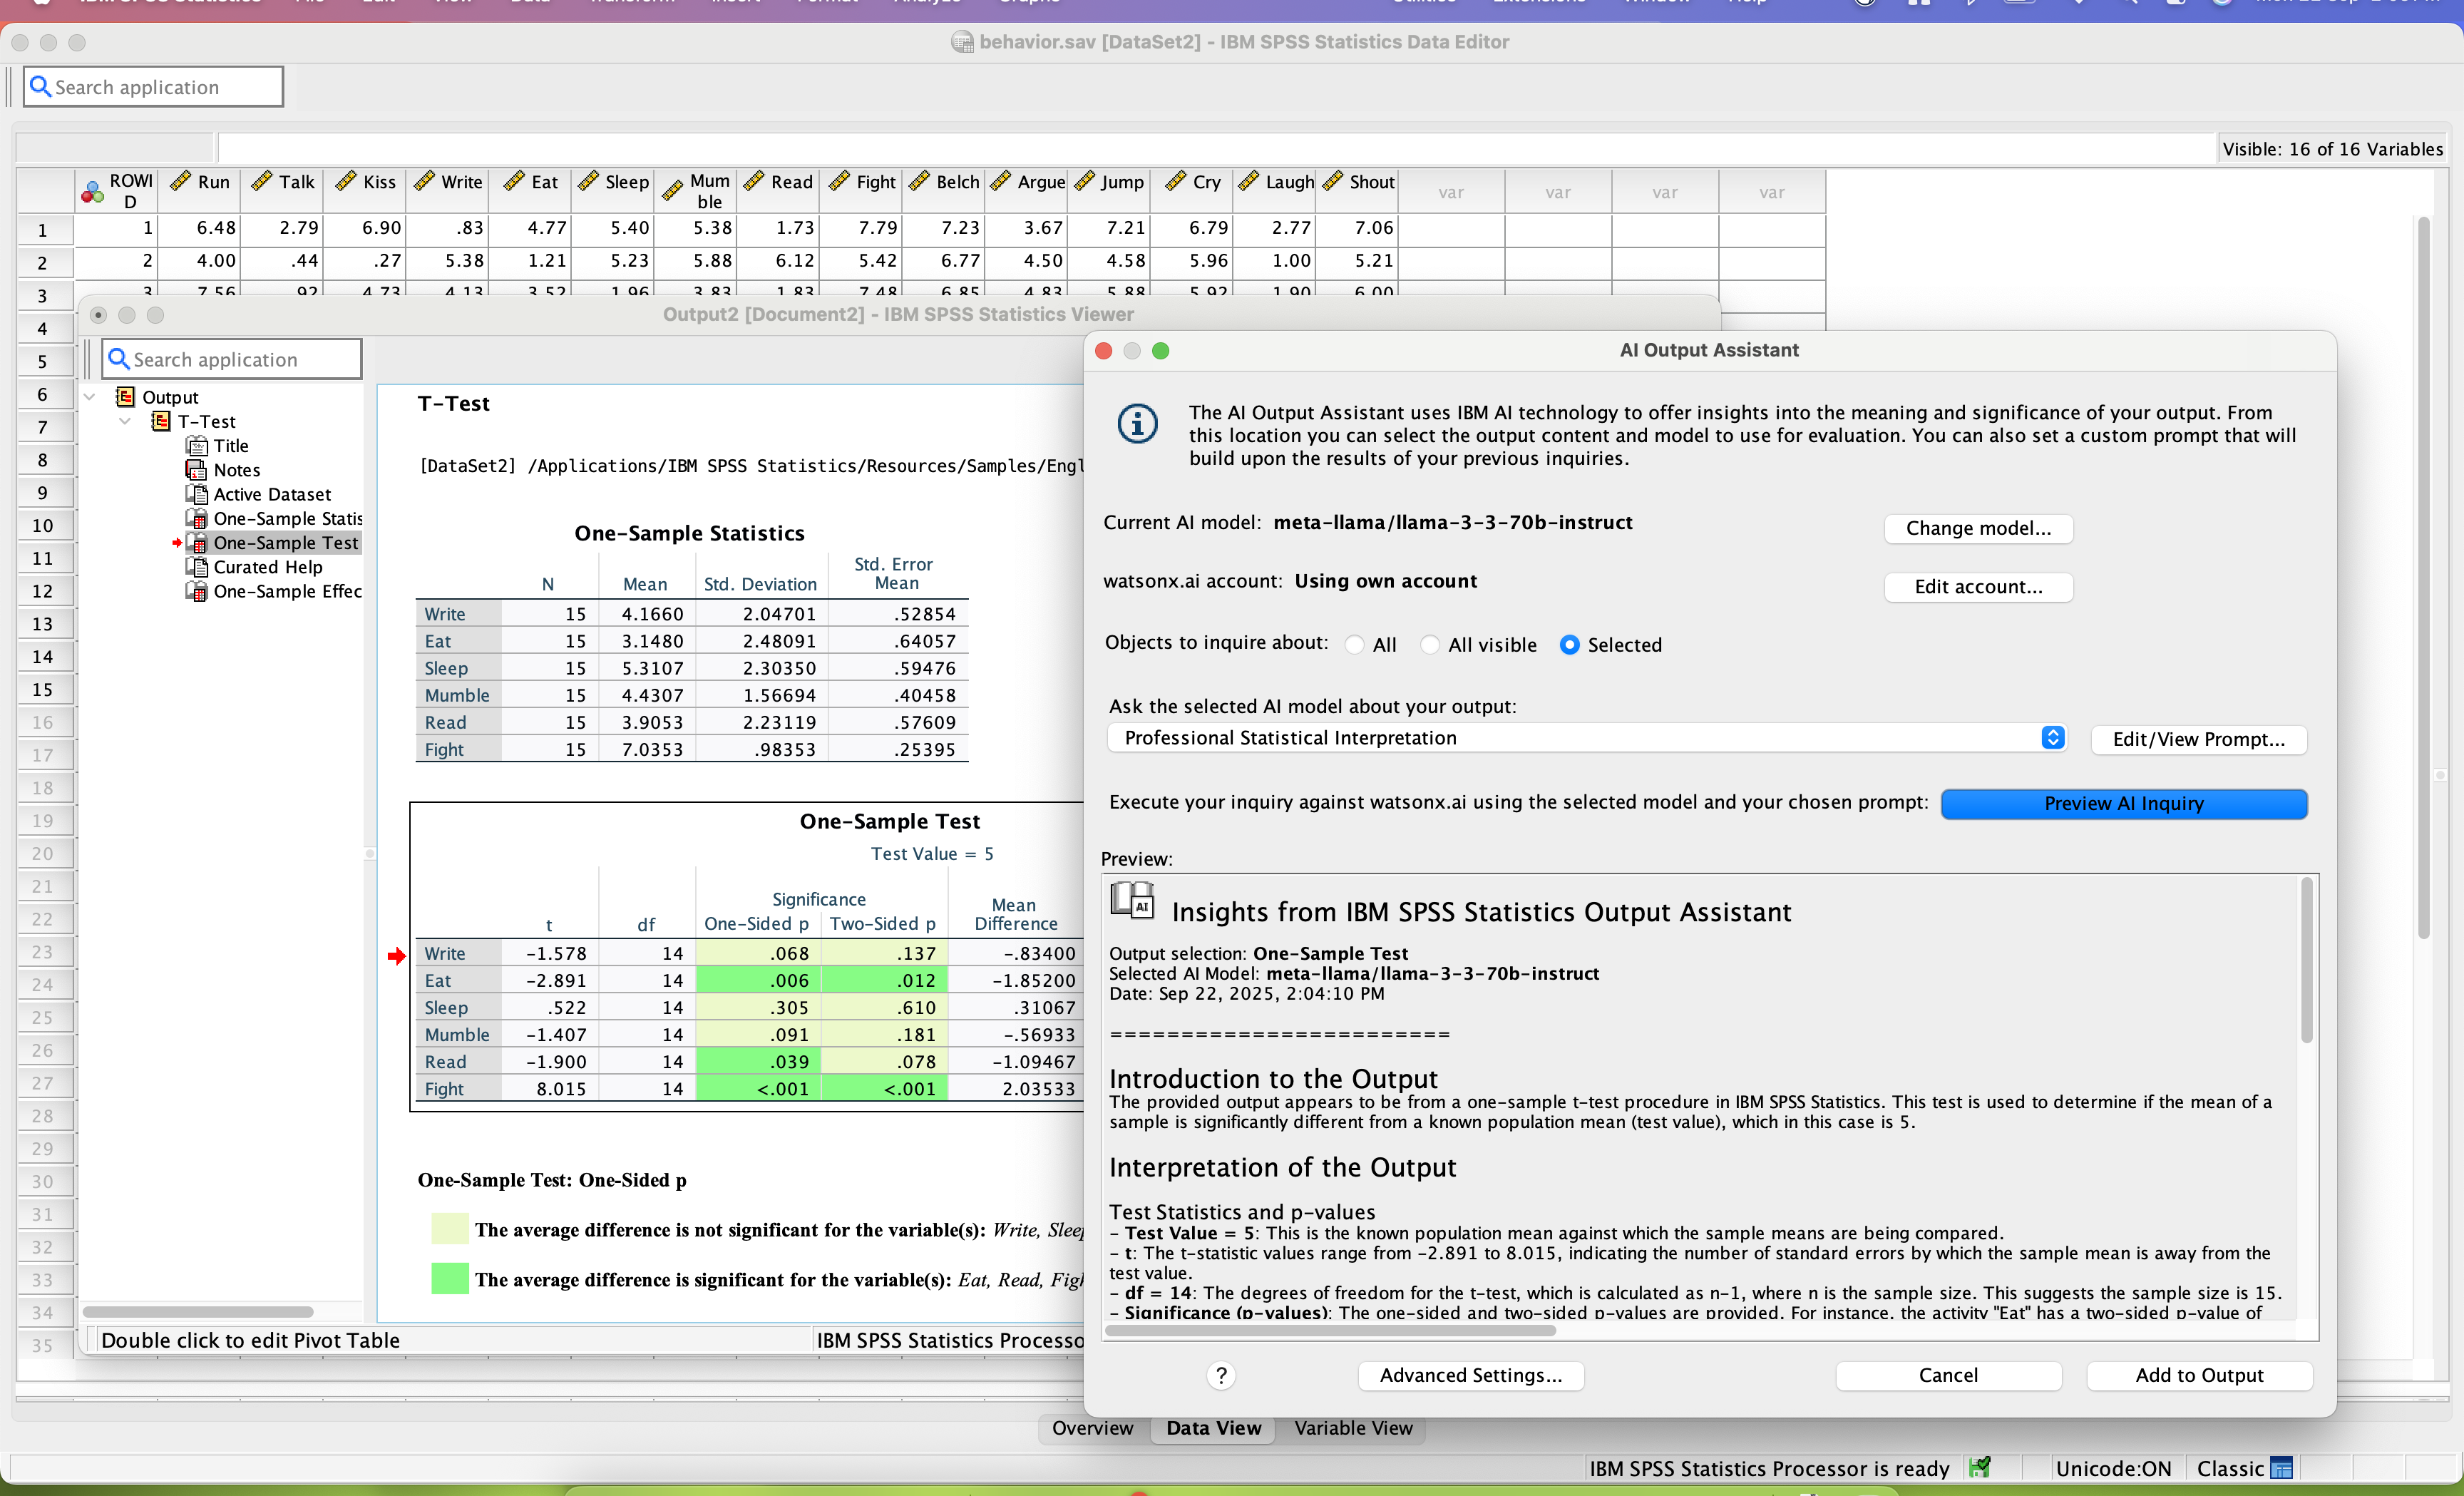
Screenshot of IBM SPSS Statistics AI Output Assistant interprets statistical output in easy to consume language

1 / 5

Screenshot of SPSS Statistics Forecasting. This enables users to build time-series forecasts regardless of their skill level.

Who Buys & Uses IBM SPSS Statistics

Pros

  • Intuitive graphical user interface and ease of use for complex statistical tasks
  • Robust data preparation and management features for cleaning and organizing datasets
  • Comprehensive statistical analysis capabilities, including regression and descriptive statistics

Cons

  • High pricing and licensing costs are considered prohibitive for some organizations
  • User interface requires modernization to align with contemporary design standards
  • Difficulties with data transfer and integration, specifically copy-paste functionality

Comprehensive and Accurate Statistical Analysis App

Use Cases and Deployment Scope

IBM SPSS has effectively helped our company in transforming raw data to actionable and meaningful insights.
We use IBM SPSS to conduct employee and customer surveys, predictive analytics and this guides us in generating reliable reports.
The program has comprehensive statistical measures that guides both non technical and technical users on data analysis
We get visualized results based on the analysis done, which assist us in decision making.

Pros

  • Complex and large datasets are effectively analyzed by this tool
  • All sophisticated analysis are automated and this uses hypothesis testing and regression analysis and
  • The transformation of raw data to actionable insights is a brilliant feature from the app

Cons

  • IBM SPSS has some add on modules that are expensive
  • Beginners find the interface more technical and some procedures are steep to learn
  • The customization part is problematic and needs some administrative intervention

Return on Investment

  • The automation of advanced statistical analysis reduces errors that can affect the decisions we make
  • The generation of actionable insights guides the company in proper planning
  • The optimization of customer satisfaction surveys helps us in determining what customers beed

A Masterful and Top-ranking Statistical Analysis Tool.

Use Cases and Deployment Scope

IBM SPSS Statistics enables me to analyze and manage large volumes of data more effectively. IBM SPSS Statistics is also a very useful tool for simplifying data entry. I'm delighted with IBM SPSS Statistics because it allows me to import/collect data from various sources.

Pros

  • Accurate forecasts.
  • Data import.
  • Advanced statistical analysis.
  • Data preparation.
  • Data visualization.
  • Customizable dashboards and reports.
  • Predictive analytics and modeling.
  • Data entries.

Cons

  • IBM SPSS Statistics delivers excellent performance and results in statistical analysis, so no challenges were encountered.

Return on Investment

  • IBM SPSS Statistics saves time and energy by automating and simplifying the manual data processing process.
  • IBM SPSS Statistics doesn't require much programming knowledge.
  • IBM SPSS Statistics delivers accurate data results.
  • Unlocking of valuable data insights.

Other Software Used

FME, Tableau Desktop, Xero

IBM SPSS Statistics for more than 20 years

Use Cases and Deployment Scope

I am researcher and instructor. I have been using IBM SPSS Statistics for a long time for over 20 years. From simple frequency charts, data manipulation and trimming, to more sophisticated regressions based analytics, I have been using IBM SPSS Statistics and also teaching it to new generations. It does support all of my needs.

Pros

  • Data Cleaning and missing data treatments
  • Charts and visualizations
  • Regression analytics
  • Structural Equation Modeling
  • ANOVA and MANOVA

Cons

  • Easier and more automated data transfer and variable naming and labeling

Return on Investment

  • Accuracy
  • time saving
  • high quality visualizations

Alternatives Considered

Microsoft Excel

Powerful raw data analysis system

Use Cases and Deployment Scope

IBM SPSS Statistics has intuitive user interface that is easy to navigate and run linear regression. It is the most reliable platform that I have used in the organization for data analysis from different departments. The customer support team is proactive and ever offers quick feedback when contacted via live chat or phone call.

Pros

  • Management of metadata.
  • Spreadsheet analysis.
  • Result and chart analysis in different navigation panes.

Cons

  • The UI can be upgraded to suit modern demands.
  • The price is high for most business enterprises.

Return on Investment

  • Efficient data analysis has enhanced positive ROI.
  • We have achieved main business objectives from effective performance.

Other Software Used

Splunk AppDynamics, IBM Process Mining, HubSpot CRM

IBM SPSS Statistics Turning data into decisions

Use Cases and Deployment Scope

We have used IBM SPSS for analyzing surveyed data and also internal behavioral matrix. Its UI is very easy to understand and clean. In addition, SPSS is the backbone of data analysis workflow. Undoubtedly, it is primarily used for survey analysis, predictive modeling and reporting. We can utilize raw data from multiple sources and convert it into market research charts and other forms of insights. It helps and gives us assurance in applying statistics and also for forecasting models helps analyze demand and support.

Pros

  • Definetely, its advanced statistical analysis which it supports without coding
  • Its predictive modeling and forecasting
  • Surved data analysis
  • Reporting and Visualizing

Cons

  • Its licence costing is a little drawback.
  • Integration with modern tools like tableau or power BI seems like a cherry on a cake.

Return on Investment

  • Time saving
  • improved decision making
  • faster reporting

Alternatives Considered

SAS Viya, Microsoft Excel and Stata

Other Software Used

Microsoft Excel