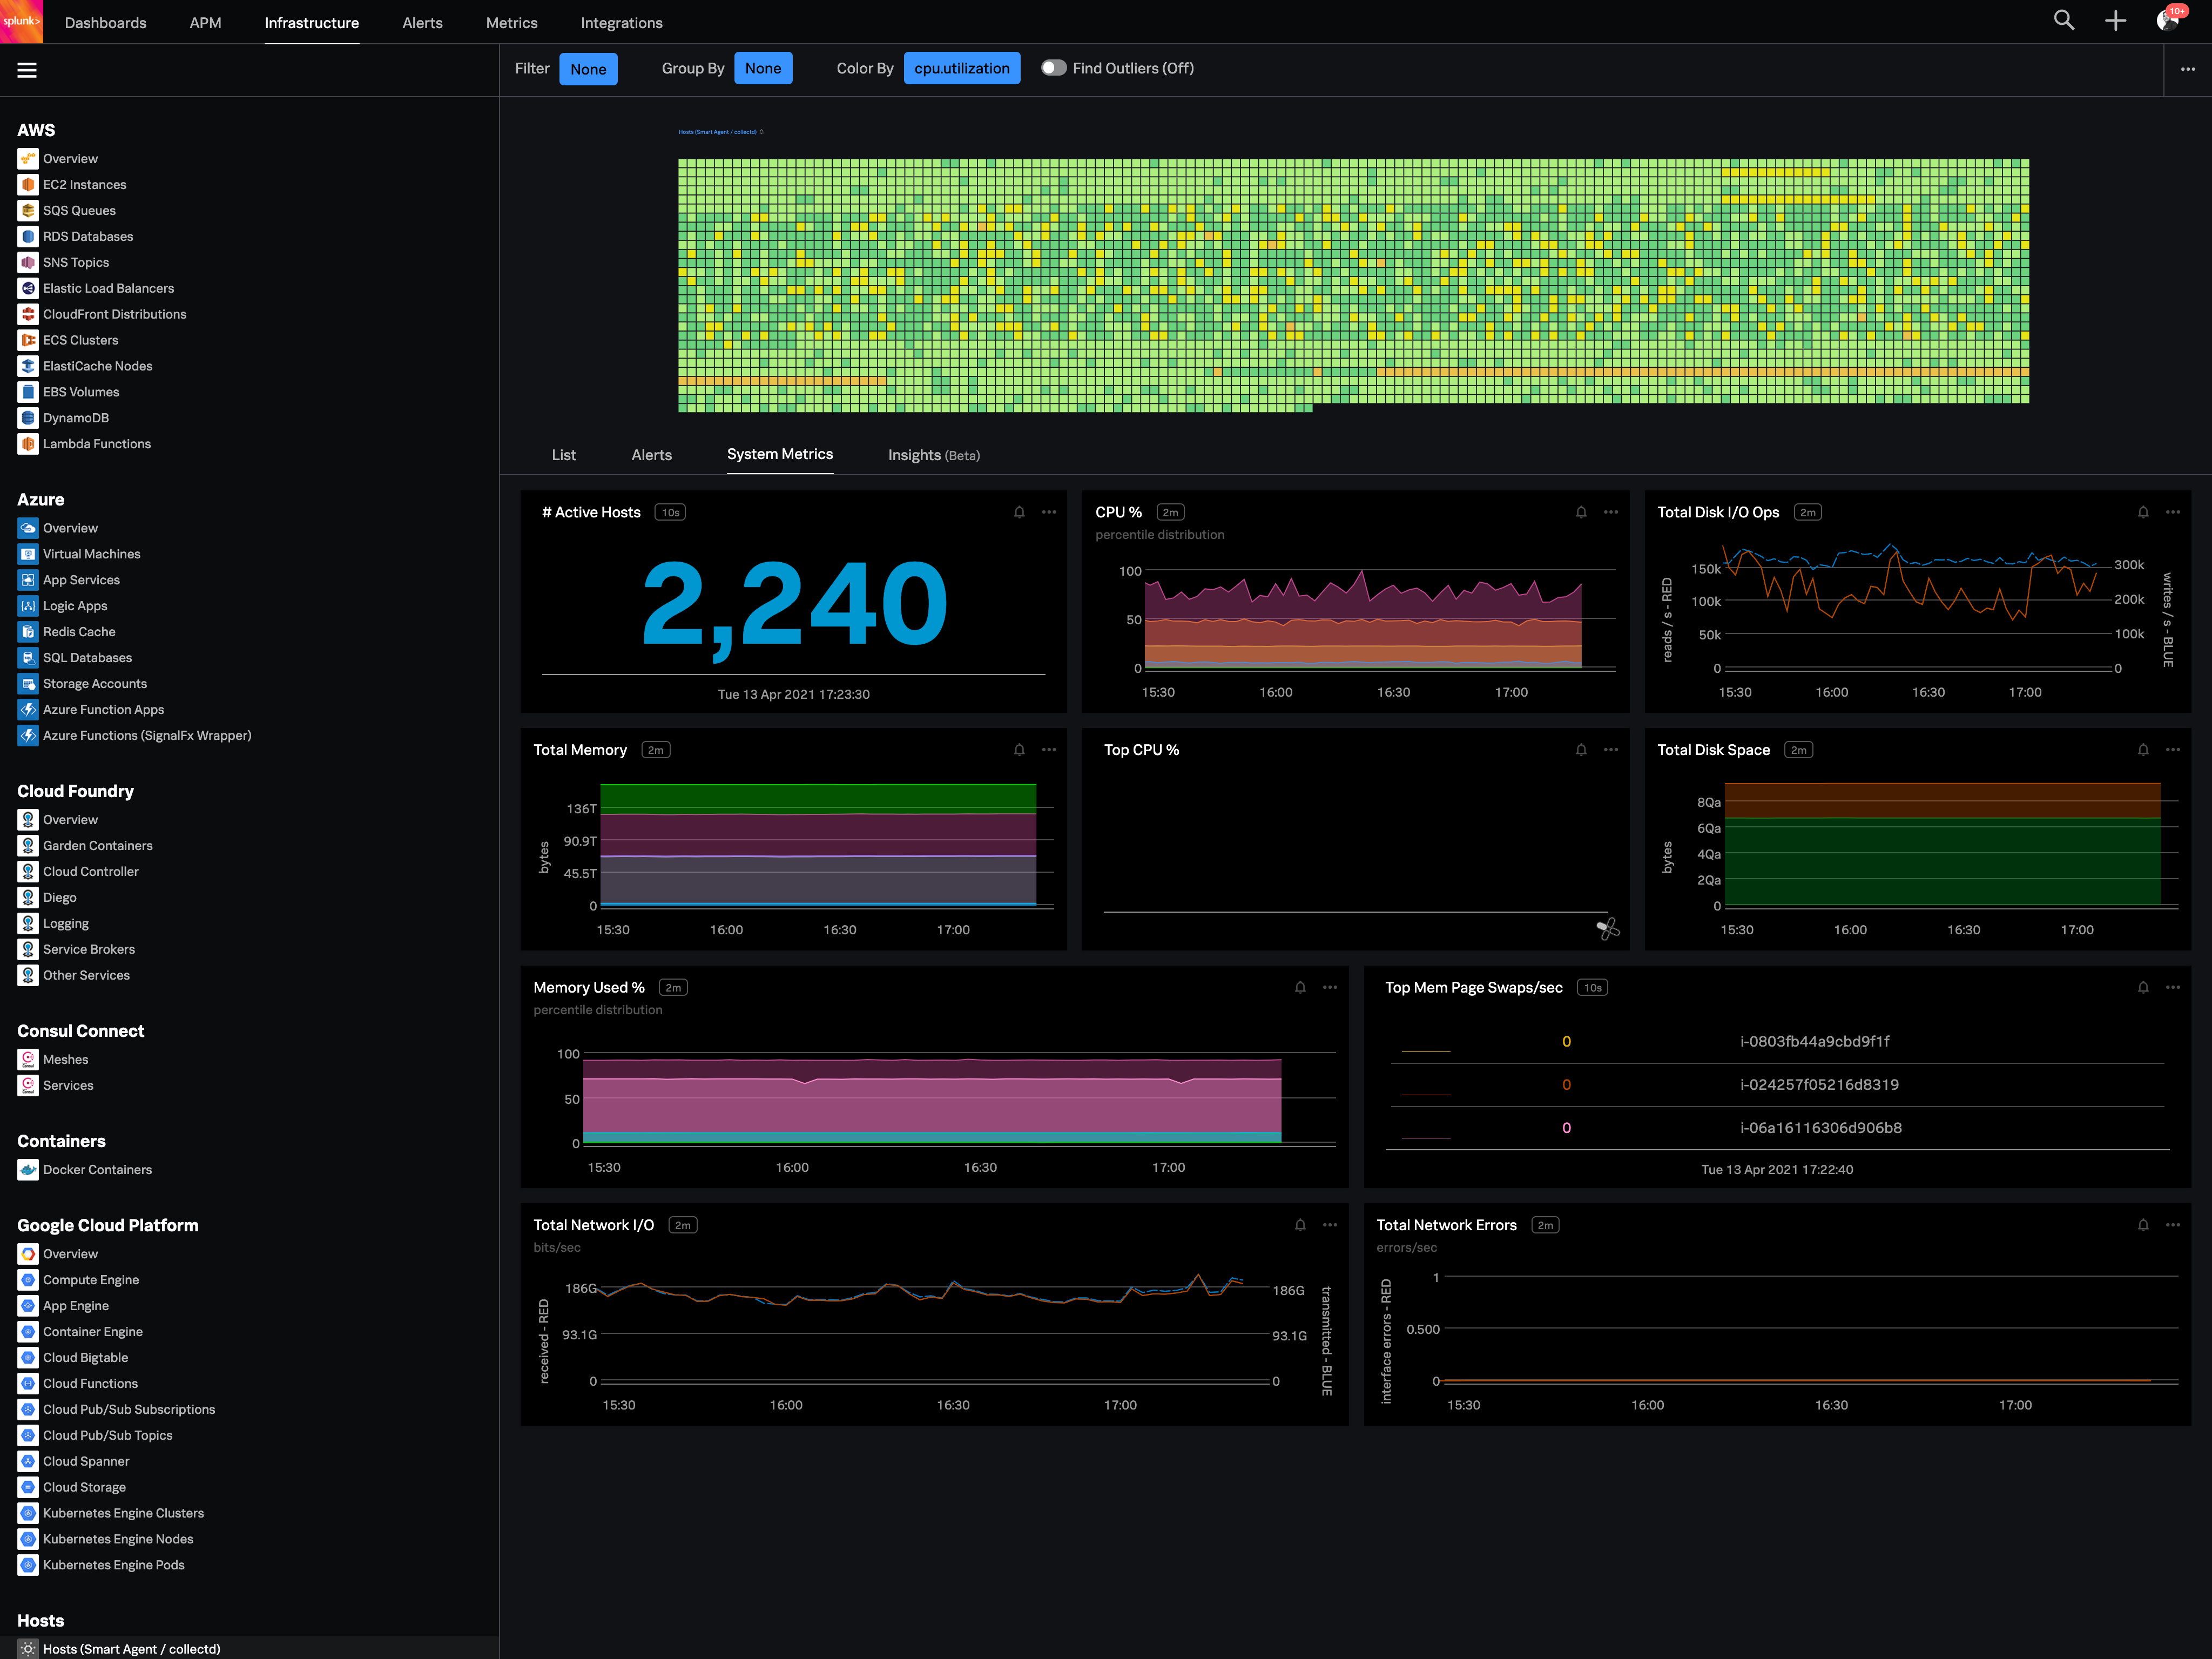
Splunk Observability Cloud aims to enable operational agility and better customer experience through real-time AI-driven streaming analytics allowing accurate alerts in seconds. It is designed to shorten MTTD and MTTR by providing real-time visibility into cloud infrastructure and services.
A de minimis incentive was given to thank the reviewer for their time. The incentive was not used to bias or drive a particular response, nor was the incentive contingent on a positive endorsement. More Info
cyber systems engineer in Engineering at Alaska (201-500 employees)
Use Cases and Deployment Scope
it allows for the full view or the picture to be created on how to analyze the full depth of logs within our environment and furthermore accessing them from cloud allows for the data to always be readily available at all times. In this instance it also provides a more secure manner of storing data and making sure it is readily available
A de minimis incentive was given to thank the reviewer for their time. The incentive was not used to bias or drive a particular response, nor was the incentive contingent on a positive endorsement. More Info
DevOps Engineer in Information Technology at Veefin (501-1000 employees)
Use Cases and Deployment Scope
So we use Splunk Observability Cloud for APM, Traces, Logs and Monitoring of our cloud resources and our application performance. So the main problem it solves is troubleshooting our engineers spent a lot time in troubleshooting but after using this everything is easy and automated we got alert of incident and also with same alert we get link of traces and logs so for our engineers it saves a lot time.
Pros
Troubleshoot errors
Optimize application
Monitor cloud resources
Centralized Incident Alerting
Cons
Advance dashboards are bit learning curve for user
Advance monitoring need more add ons means more cost
They need to give more out of the box dashboards so even small team can start with
Return on Investment
We have optimized our product
We have solved error with minimum downtime because of traces and logs
The main problem of this is if you go advance then cost is too high to pay
A de minimis incentive was given to thank the reviewer for their time. The incentive was not used to bias or drive a particular response, nor was the incentive contingent on a positive endorsement. TR verified that a representative sample of customers was invited. More Info
Verified User
Director in Information Technology (1001-5000 employees)
Use Cases and Deployment Scope
We use it mainly to monitor infrastructure and application performance across multiple environments, but also as part of our broader security and compliance visibility stack. It helps us detect performance issues, and unusual activity before they turn into incidents. It helps with problem of fragmented monitoring and limited visibility across systems that have to meet regulatory requirement especially for HIPAA and PCI data . We use infrastructure monitoring, alerting, and real-time dashboards that support both IT operations and security response teams.
Pros
Realtime visibility across infrastrucrte and applicaitons
Excellent traceability of data to get us to root cause
Dashboard are very flexible and customizable.
Easy integrations with the rest of our tech stack
Cons
Unnecessarily complicated licensing
UI needs and update. It's overly cluttered and difficult to learn
Big correlations for logs and traces can be slow and time consuming.
Return on Investment
Satisfies observability requirements for the reglatory requirements we have
Significantly reduces time to detect and remediate potential threats
Expensive to use. Ensure you are not on a consumption model.
Usability
Alternatives Considered
IntSights Cyber Intelligence, from Rapid7, CrowdStrike Falcon and SentinelOne Singularity
A de minimis incentive was given to thank the reviewer for their time. The incentive was not used to bias or drive a particular response, nor was the incentive contingent on a positive endorsement. TR verified that a representative sample of customers was invited. More Info
Verified User
Engineer in Engineering (201-500 employees)
Use Cases and Deployment Scope
I use Splunk Observability Cloud to monitor mainly my Cloud Infrastructure, FrontEnd and Backend applications. In our Organization, through the help of Splunk Observability Cloud multiple teams can easily troubleshoot their applications and infrastructures through the help of theri metrics and logs which helps us to reduce the MTTD and MTTR. It solves so many problems like End to End Visibility, Real time correlations to reduce MTTD etc.
Pros
The first one is its Kubernetes container monitoring.
I really like this features because as we know how much K8s is vast and to manually monitor each part of the Kubernetes it takes so much time but Splunk Observability Cloud makes it easier. And even once we integrate K8s with Splunk Observability Cloud it gives us some prebuilt dashboards which gives holistic view of our Cluster and its nodes, pods, etc.
The dashbaord feature of Splunk Observability Cloud, it gives us full flexibility to customize our dashboard with a wide range of predefined chart types.
Now it also supports OTEL, which is a plus point for observability. As now everyone is moving towards Otel and in current market there are only few tools who supports OTEL based integrations, Splunk Observability Cloud is one out of them.
Cons
It can improve its pricing models as per its competitors as I have it is a bit costly as compare to others.
It can improve on its OTEL based integration part as currently to integrate OTel based application we need a good knowledge of OTel SDKs.
Return on Investment
Reduction in MTTD and MTTR, it helps us alot by reducting time to detect the exact issue in production environment which gives the positive impact to our business. Because of this we have improved our uptime and Service reliability.
It improves the observability across all business teams by a centralized observability tool, which gives us insights for all of our applications and infrastructures.
We can easily identify the exact error and when & where it occurs, everything we can easily identify
Usability
Alternatives Considered
New Relic, Datadog, Dynatrace, Azure Monitor, Amazon CloudWatch, Prometheus and Grafana
Other Software Used
Microsoft Teams, Google Meet, Azure Functions, Azure Kubernetes Service (AKS)
A de minimis incentive was given to thank the reviewer for their time. The incentive was not used to bias or drive a particular response, nor was the incentive contingent on a positive endorsement. More Info
Junior Network Engineer in Information Technology at TMX Group (1001-5000 employees)
Use Cases and Deployment Scope
In our organization, Splunk Observability Cloud is a critical component of our end-to-end monitoring and observability strategy. We use it to gain deep visibility into the health, performance, and reliability of our cloud-native applications and infrastructure in real time.
Pros
Data security
Custom Dashboards & Alerts
Log Management
Cons
Having the AI within Splunk Observability Cloud and let the users use human language and retrieve the data from it without the knowledge of SQL Splunk queries.
Return on Investment
Made the logging and observability much easier
Proactive Incident Detection & Resolution
Usability
Alternatives Considered
Grafana
Other Software Used
Cisco Catalyst Center, Cisco Nexus Dashboard, Cisco Nexus 9000 Series Switches
Splunk Observability Cloud Alternatives
Products similar to Splunk Observability Cloud that may also meet your needs.