Datadog is a monitoring service for IT, Dev and Ops teams who write and run applications at scale, and want to turn the massive amounts of data produced by their apps, tools and services into actionable insight.
$18
per month per host
Splunk Observability Cloud
Score 8.5 out of 10
N/A
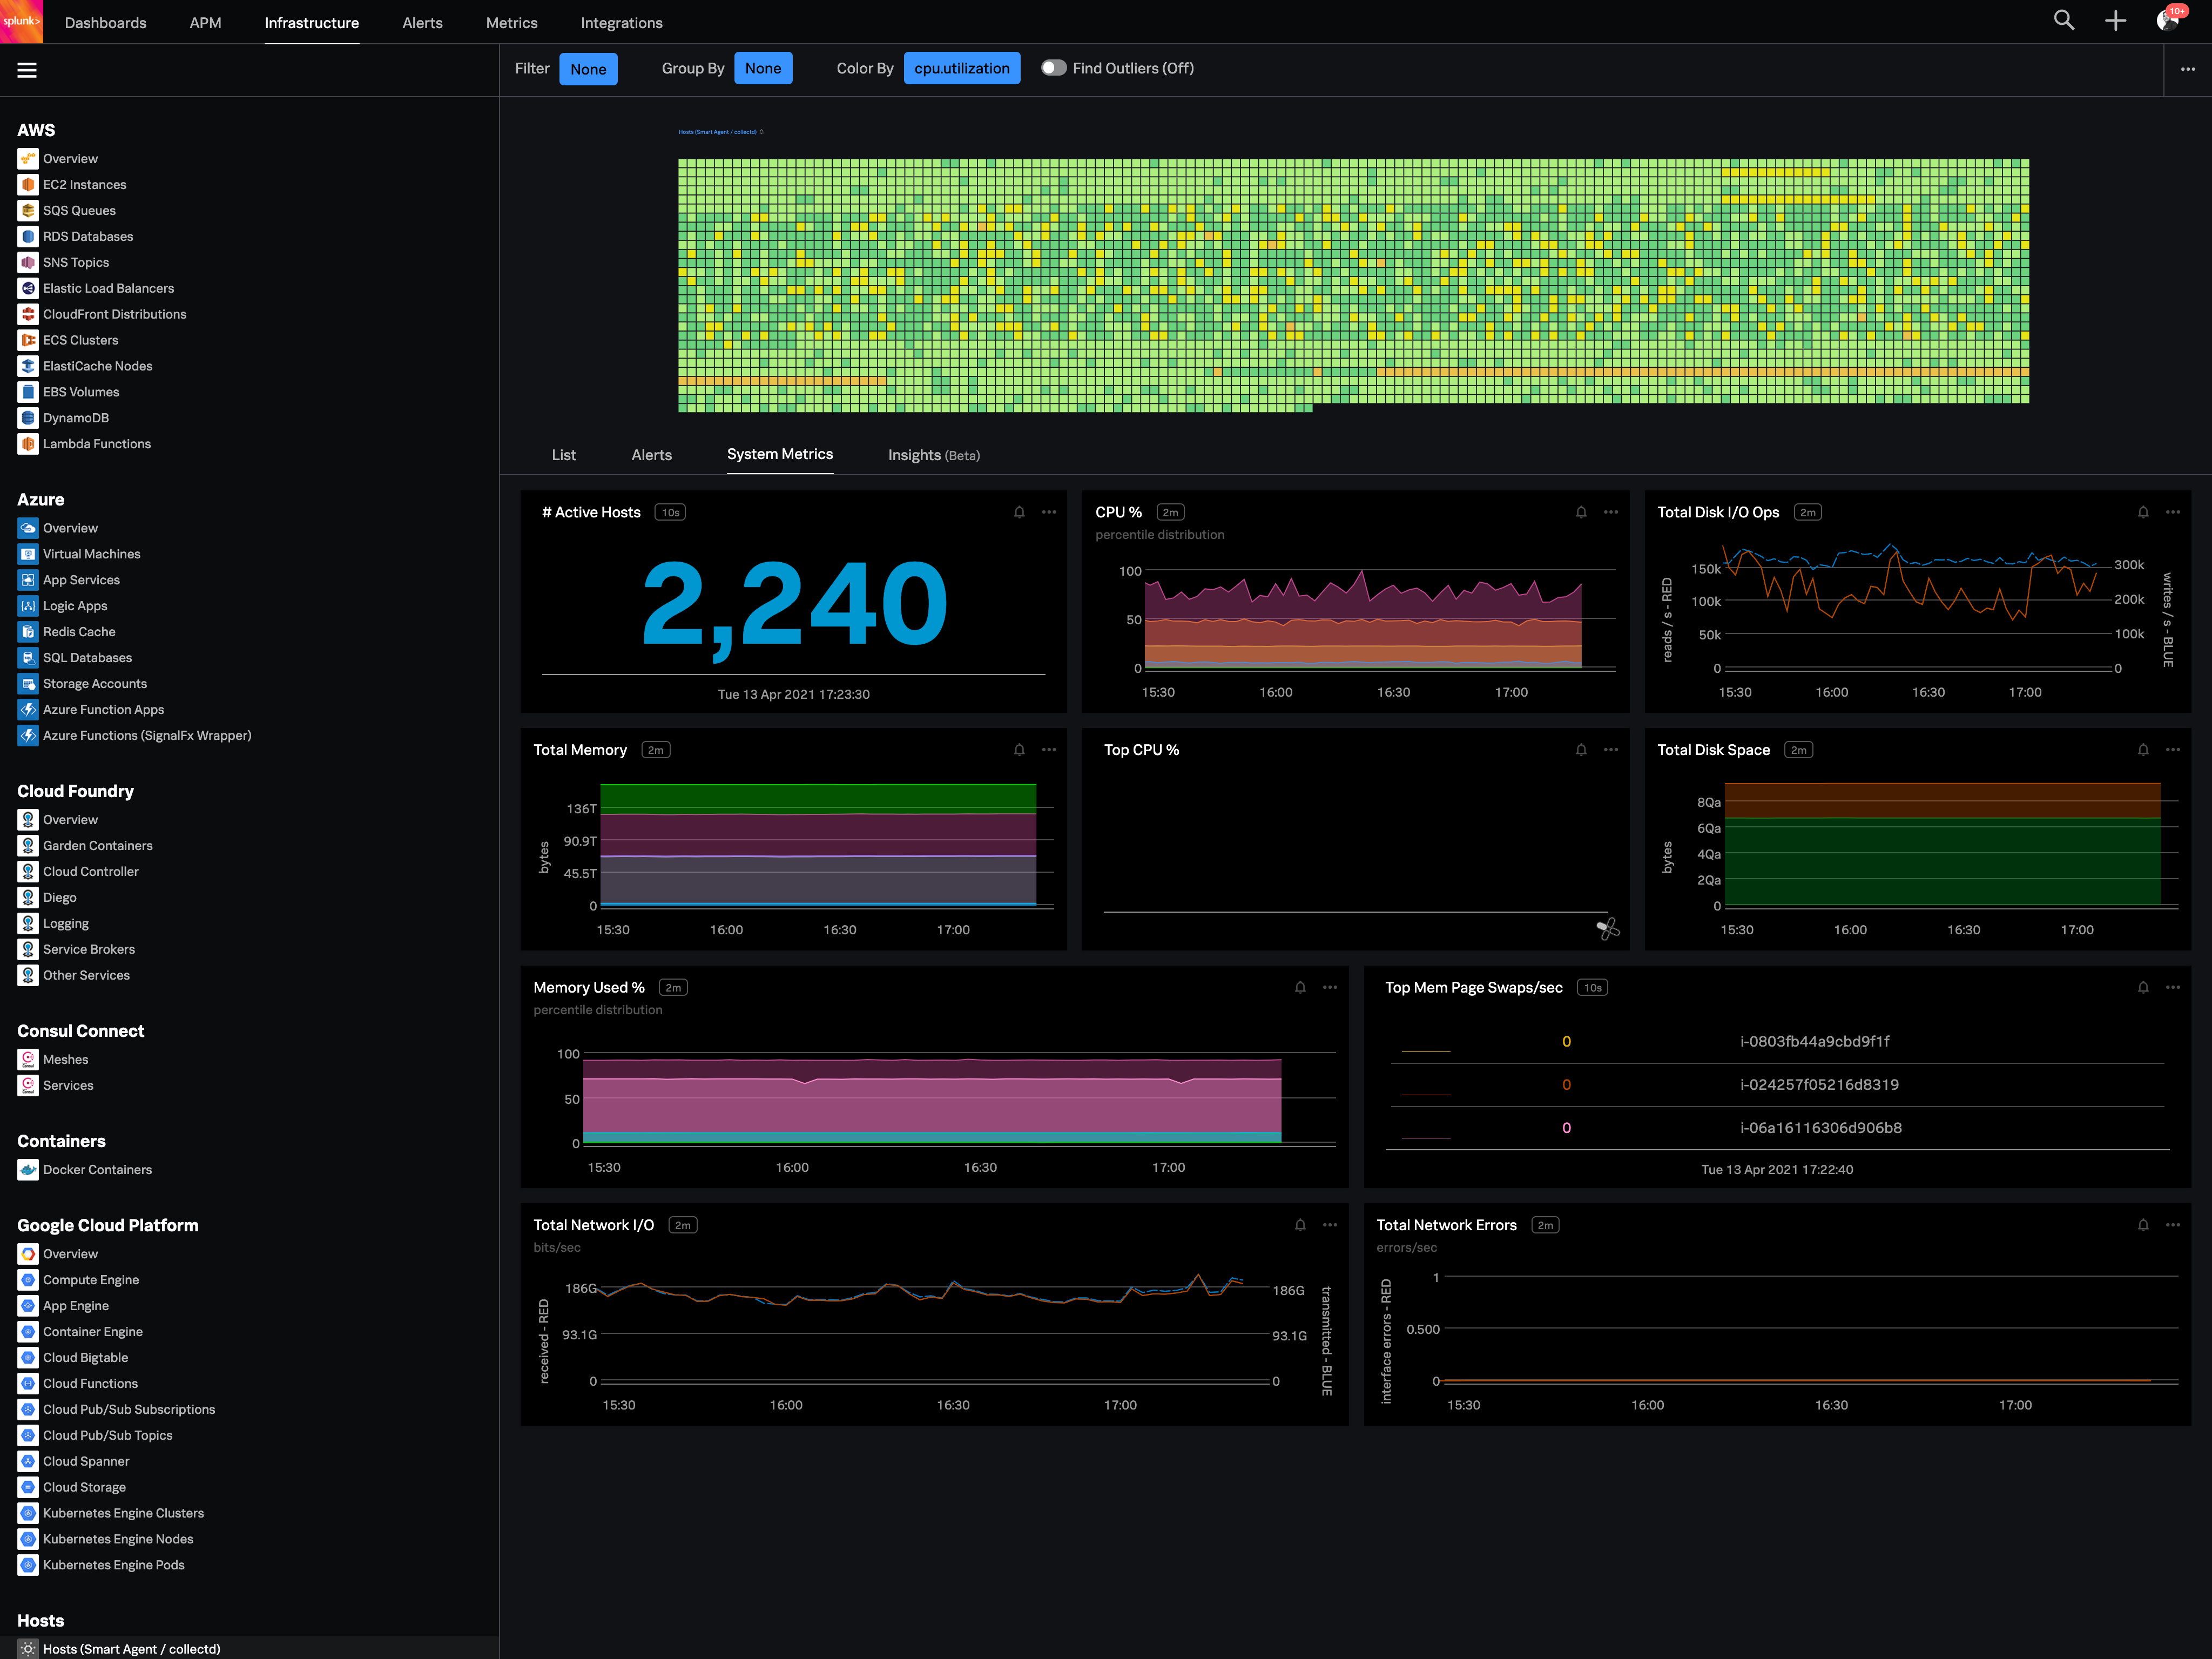
Splunk Observability Cloud aims to enable operational agility and better customer experience through real-time AI-driven streaming analytics allowing accurate alerts in seconds. It is designed to shorten MTTD and MTTR by providing real-time visibility into cloud infrastructure and services.
$180
per year per host
Pricing
Datadog
Splunk Observability Cloud
Editions & Modules
Log Management
$1.27
per month (billed annually) per host
Infrastructure
$15.00
per month (billed annually) per host
Standard
$18
per month per host
Enterprise
$27
per month per host
DevSecOps Pro
$27
per month per host
APM
$31.00
per month (billed annually) per host
DevSecOps Enterprise
$41
per month per host
Infrastructure
$15
per month (billed annually) per host
App & Infra
$60
per month (billed annually) per host
End-to-End
$75
per month (billed annually) per host
Offerings
Pricing Offerings
Datadog
Splunk Observability Cloud
Free Trial
Yes
Yes
Free/Freemium Version
Yes
No
Premium Consulting/Integration Services
No
No
Entry-level Setup Fee
Optional
No setup fee
Additional Details
Discount available for annual pricing. Multi-Year/Volume discounts available (500+ hosts/mo).
I selected Datadog because of its features and the wide range of integration support. As I already told it supports more that 600+ integrations which helps and organization to keep everything in a single place and also its AI feature which is reducing the time for root cause …
I selected Splunk Observability Cloud because it focused so much on OTEL standards which will help us in future as OTEL is covering most of the observability standards. And also it has the best Kubernetes observability as I already explained it has several predefined dashboards …
Splunk is better for Multicloud and UI is very good as compared to other Solutions. Also, time saving in case of Developer Productivity as Detectors can be saved as code.
SignalFX is a strong competitor in the monitoring SaaS space and provide the basic necessities for production grade monitoring and alerting. Other solutions may offer easier adoption and other helpful features, but will have trouble competing for cost for organizations that …
If I want to see what customers are doing wrong in their sessions, we can do that easily. On the other hand, if we want to know the payload in the API calls, that is the area where Datadog can improve.
Its great if you need real-time visibility across complex or regulated environments. Also strong for hybrid or multi-cloud setups where uptime, observability and fast IR are required. It’s probably overkill for smaller teams or environments that don’t have constant changes or compliance reporting needs. It's expensive and has a steep learning curve. Also, in my opinion, do not get yourself into a consumption based model. Costs can certainly get out of control quickly.
The thing which Datadog does really well, one of them are its broad range of services integrations and features which makes it one step observability solution for all. We can monitor all types of our application, infrastructure, hosts, databases etc with Datadog.
Its custom dashboard feature which helps us to visualize the data in a better way . It supports different types of charts through those charts we can create our dashboard more attractive.
Its AI powered alerting capability though that we can easily identify the root cause and also it has a low noise alerting capability which means it correlated the similar type of issues.
The first one is its Kubernetes container monitoring.
I really like this features because as we know how much K8s is vast and to manually monitor each part of the Kubernetes it takes so much time but Splunk Observability Cloud makes it easier. And even once we integrate K8s with Splunk Observability Cloud it gives us some prebuilt dashboards which gives holistic view of our Cluster and its nodes, pods, etc.
The dashbaord feature of Splunk Observability Cloud, it gives us full flexibility to customize our dashboard with a wide range of predefined chart types.
Now it also supports OTEL, which is a plus point for observability. As now everyone is moving towards Otel and in current market there are only few tools who supports OTEL based integrations, Splunk Observability Cloud is one out of them.
You can use table-like functionality to generate dashboards, but these queries are heavy on the system.
It could be easier to give insight into what type of line parsing is used for specific documents in a company-managed environment and/or show ways to gain the insights needed.
I would like to see ways to anonymize specific data for shared reports without pre-formatting this in a dashboard on which reports could be based.
Its a one stop solution for most processes and does reduce cost overall. This does in turn help teams communicate in a much more efficient way, also RUM is a game changer for any quality product; we use RUM alot for debugging and reverse engineering issues. Reports and coverage has been a plus, it all has helped us a lot in our processes.
Good: Stable system with low error rate Easy to use for simple use cases Bad: UI is not very clear for complex usage Mobile view (when logged in from phone) is bad No library for .net
There are so many features that it can be hard to figure out where you need to go for your own use case. For example, RUM monitoring us buried in a "Digital Experience" sidebar setting when this is one of our key use cases that I sometimes struggle to find in the application. It appears that ECS + Fargate monitoring was recently released which is great because we had to build a lambda reporting solution for ephemeral task monitoring. But this new feature was never on my radar until I starting clicking around the application.
When there is an issue, it’s a win if one can easily identify the root cause. To do the same, it should allow the user to dig deep with multiple data points and compare the data and identify the anomaly. In this use case, it’s good to drive from Splunk 011y.
The support team usually gets it right. We did have a rather complicate issue setting up monitoring on a domain controller. However, they are usually responsive and helpful over chat. The downside would be I don’t think they have any phone support. If that is important to you this might not be a good fit.
In terms of usability, I’ve found Datadog significantly more approachable and powerful compared to Elasticsearch, especially for day-to-day operational monitoring. Datadog offers a much more cohesive, user-friendly interface out of the box, with built-in support for metrics, logs, tracing, alerting, and dashboards—all tightly integrated. In contrast, Elasticsearch often felt barebones and required considerable setup and additional tooling (like Kibana or Logstash) to reach the same level of functionality. While Elasticsearch is excellent for high-volume log ingestion and full-text search, it lacks the depth of features and real-time visualization capabilities that Datadog provides natively. The query language in Datadog is also quite usable and comparable for my needs—mainly filtering and aggregating logs and metrics—without needing to learn Elasticsearch's more complex DSL. Overall, Datadog saves our team time and effort, whereas Elasticsearch often felt like building a monitoring system from scratch. The all-in-one nature of Datadog, despite its complexity, is ultimately more efficient and scalable for our use case.
Splunk Infrastructure Monitoring provides far superior options for anybody using a complex hybrid multi-cloud environment and allows both your SOC and NOC to work together on the same data while driving their own insights. We found other products are still in the old world view of servers and agents residing together within a single data centre, but modern apps are no longer like this.