New Relic is a SaaS-based web and mobile application performance management provider for the cloud and the datacenter. They provide code-level diagnostics for dedicated infrastructures, the cloud, or hybrid environments and real time monitoring.
$0
No credit card required; 100 GB free ingest per month, 1 free full user + unlimited basic users, 8 days retention, 100 Synthetics Checks
Splunk Observability Cloud
Score 8.5 out of 10
N/A
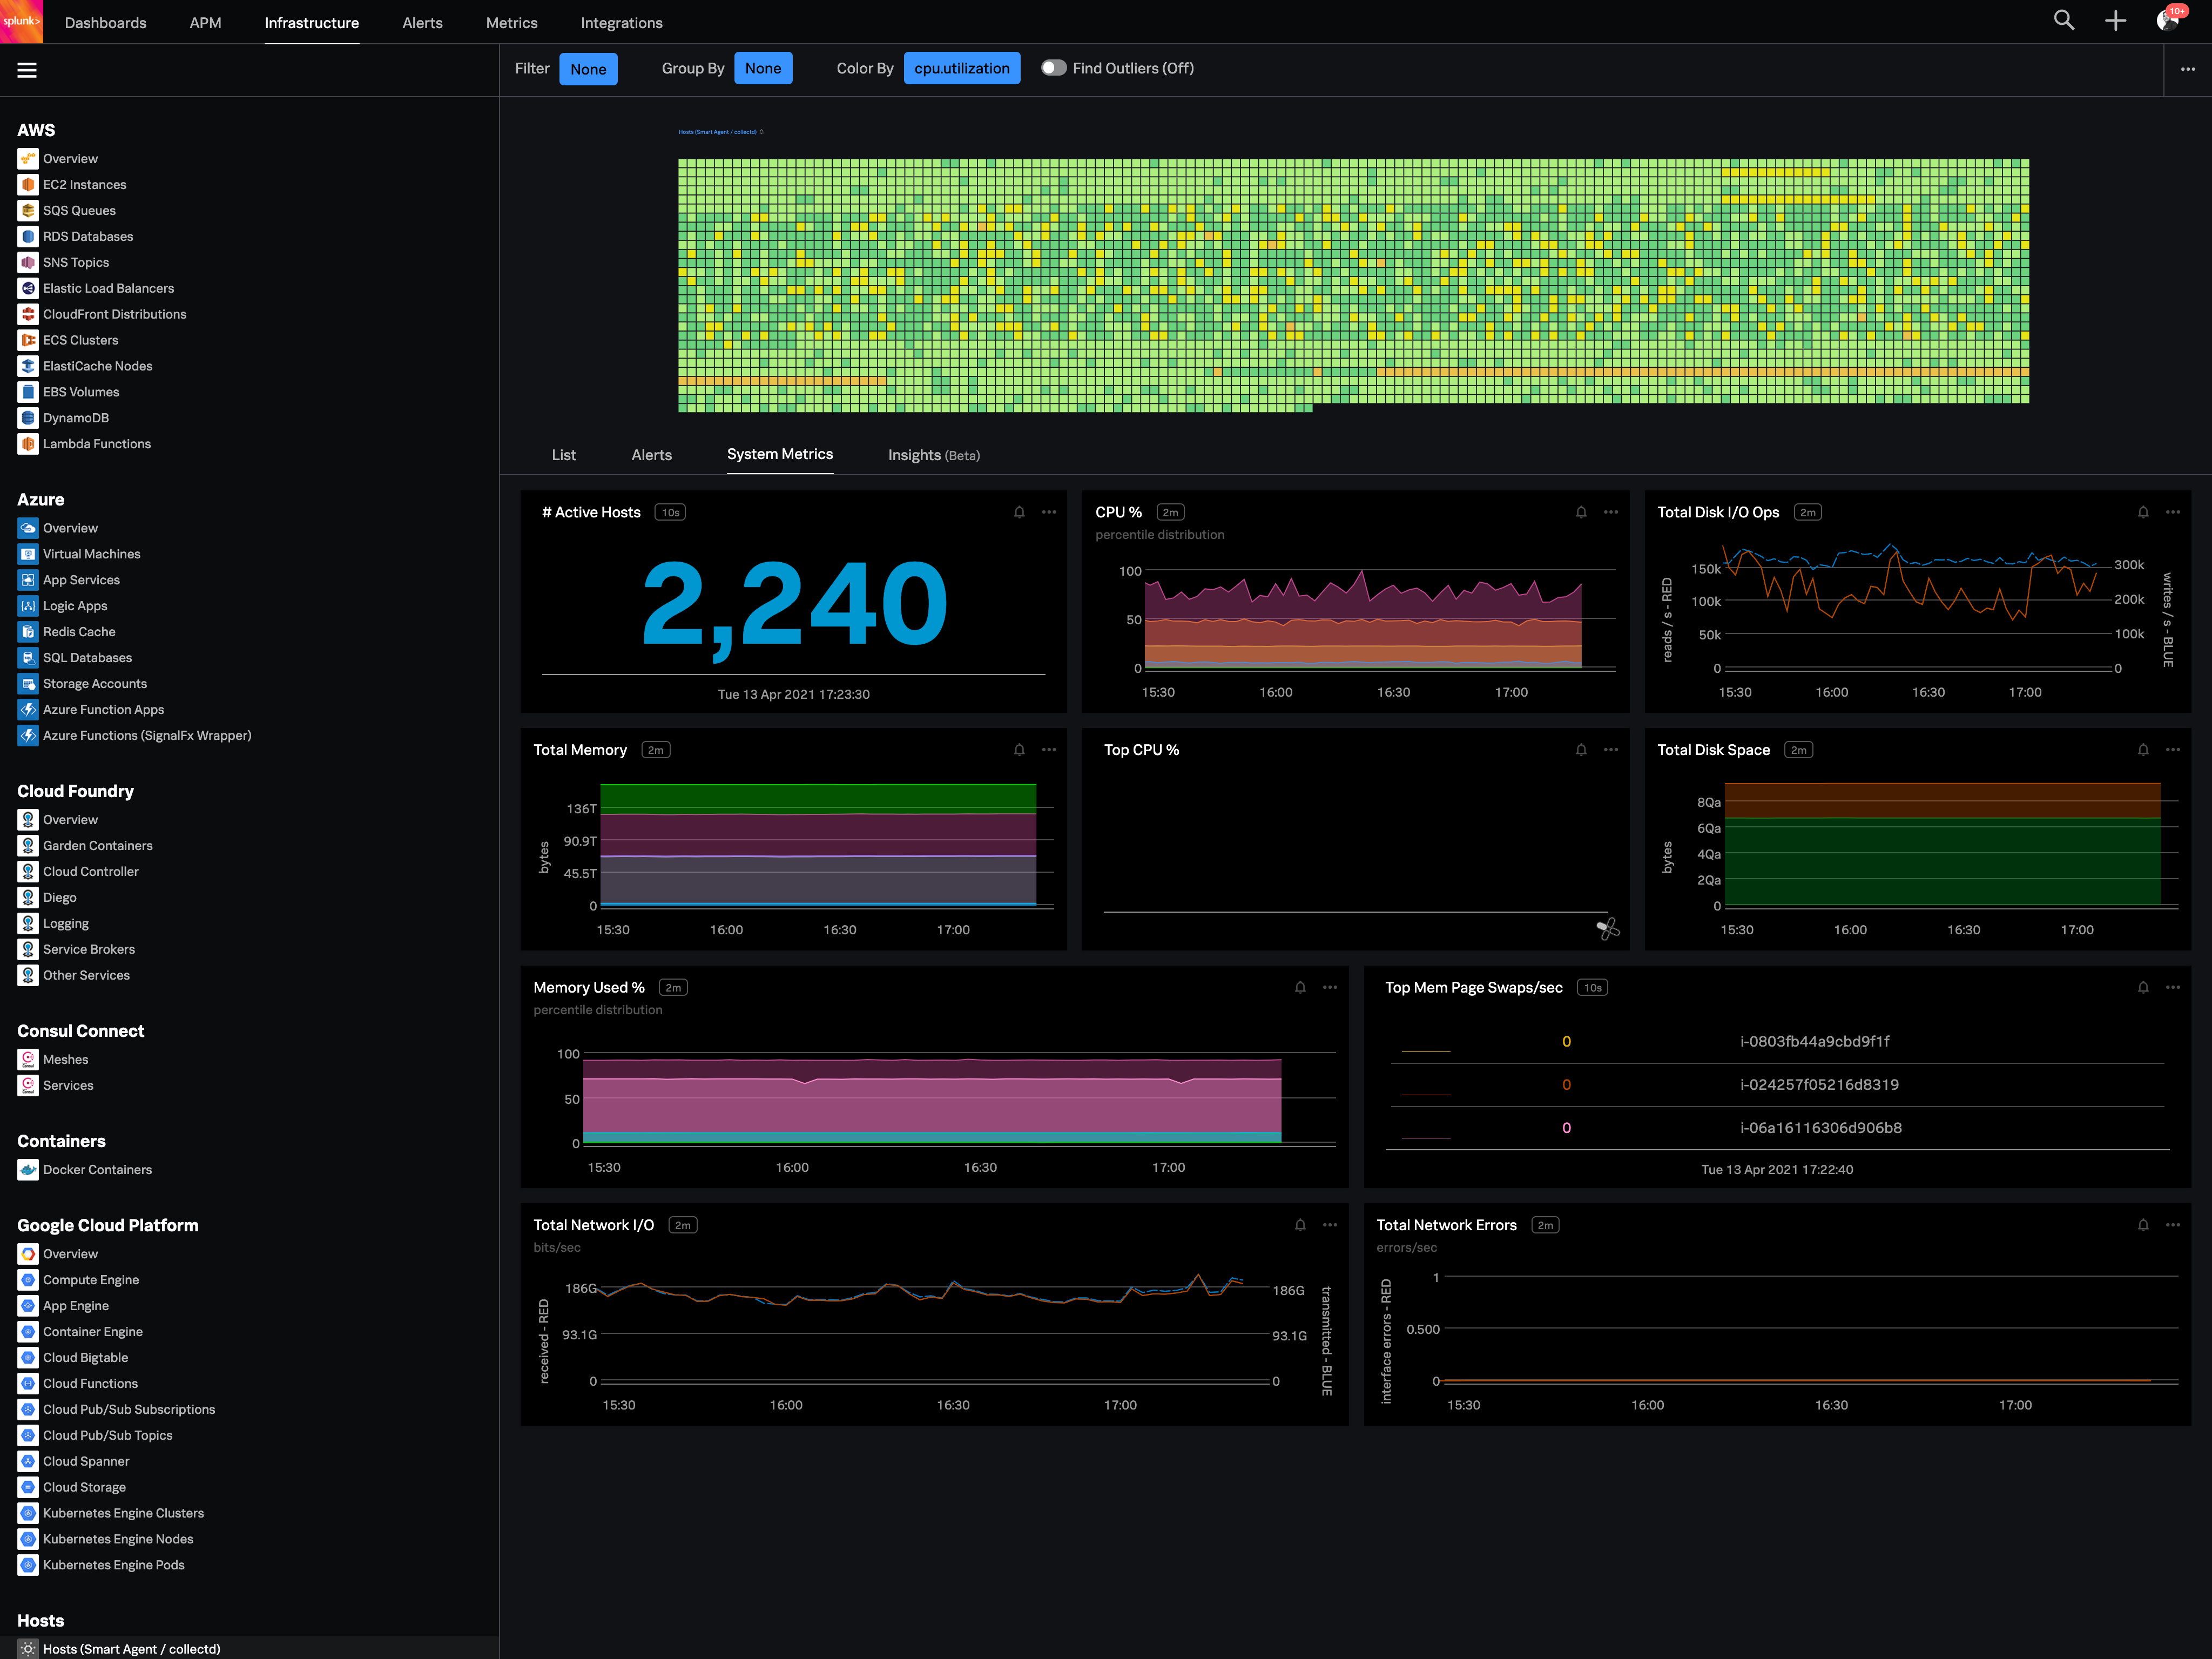
Splunk Observability Cloud aims to enable operational agility and better customer experience through real-time AI-driven streaming analytics allowing accurate alerts in seconds. It is designed to shorten MTTD and MTTR by providing real-time visibility into cloud infrastructure and services.
$15
per month (billed annually) per host
Pricing
New Relic
Splunk Observability Cloud
Editions & Modules
Free (Forever)
$0
No credit card required; 100 GB free ingest per month, 1 free full user + unlimited basic users, 8 days retention, 100 Synthetics Checks
Telemetry Data Platform
$0.25
per month per extra GB data ingest (after first free 100GB per month)
Incident Intelligence
$0.50
per month per event (after first 1000 free events per month)
Standard
$99
per month per full user (after first free full user - unlimited free basic users)
Before start using New Relic, we had a custom Grafana monitoring tool configured for our clients. Altough functional, it took too much time to add new alerts and monitoring features. New Relic is way easier and simpler to to configure and saves us a lot of time spent not only …
Data Dog has solutions that look more attractive, but not at their price point. We have also tried to build a solution straight from the Cloud, where our business is built, but some things are too hard to replicate. This shows that New Relic is useful and helps our efficiency.
New Relic continuously focusing on Open Telemetry and agentic AI integrations which is helping users to focus on the latest technology and as we all know that in future Observability will be mostly on OTel concept and AI driven and New Relic focusing on those area. Apart from …
The main reason is its pricing models which is value for money with respect to its features and it supports the OTEL related integrations which helps us to adopt the updations of Otel very easily and also it gives us flexible to drop the data in different stages through the …
Its covers all the observability aspects as well as giving us more competitive pricing models compared to other providers that's why I like to use New Relic in place of other tools. And also it introduces new Agentic AI features as well as it adopts AI in its RCA. As an …
Tracing of the services calls between the entire components in the architecture is good and easy to understand. Dashboarding building process is simple. UI is simple.
New Relic has full stack visibility and gives us all options for observability like one stop shop. It gives you front end, backend as well synthetic monitoring capabilities.
Every other feature built into one cost model (usually) which ties to data that you send, it helps you …
New Relic stood out to us primarily because of its all-in one approach, combining APM, infra monitoring, logs and alerts in single platform. Compared to other tools we evaluated, if offered a smoother on boarding experience and required less stitching together of different …
Less expensive than datadog and sentry with almost everything we need. Less effort to set up and maintain than elastic search and kibana so saved a ton on engineering bandwidth which would have otherwise been lost.
Solarwinds was good until they migrated to a new kind of offering and discounting the old product making it more expensive and less flexible for our specific use-case. The free trial also helped me try and get started without needing to commit. I think right now New Relic is the …
New Relic is the easiest to adopt, the price is in line with the other tools, and it has the lowest threshold to cross in order to learn the system and the platform. Adopting OpenTelemetry has been helpful in getting data aligned, and their documentation has been sufficient for …
The New Relic Platform addresses this challenge with the new plugin architecture. Plugins provide a way to monitor each of these technologies, extending the New Relic interface with custom-made dashboards specific to each. They pair the reporting of metrics specific to the …
We selected TrackJS for error monitoring and New Relic for site speed monitoring. TrackJS is a much easier to use tool for JS error monitoring, so we never ended up consolidating tools or moving over to New Relic permanently. We use New Relic for site speed monitoring and …
New Relic is the most full-featured offering that we've found, and is incredibly easy to start using with a PHP app. The New Relic agent is installed as a PHP extension so it is able to monitor and track the performance of any PHP app being run by the web server. Other tools …
New Relic is used by developers and support teams at our organisation - Splunk is used more in security monitoring by our SecOps team - not sure how they might compare doing the same job
The overlap is not large, but the one advantage of the speed curve is retention: data is available permanently, which allows you to investigate the hypothesis with data collected before formulating the hypothesis. This has proven very effective for us.
it could stack up against this version of Splunk because in this instance of having the cloud option as an available use case it furthermore has more use cases and the options for the data to always be readily available will furthermore allows for analysts to review the data in …
Datadog pushes intom proprietary ecosystem and pricing structure.Compared to self hosted prometheus and grafarna but it gave headache og managing our own monitoring infrastructure at scale.Prometheus is excellent for scraping cluster metrics but it doesnt handle distributed …
I guess scale is the main factor against grafana and ease of use against amazon elasticsearch service and also i have used signoz and ELK Stack also, but stability Splunk Observability Cloud gives is too good and also it comes with high avability and you have to maintain …
We initially chose Splunk Observability Cloud because it promised full-stack visibility and tighter integration. The other tools didn't offer this as part of the core package. Their analytics and real-time dashboards looked strong during the demo but it turned out to a lot …
I selected Splunk Observability Cloud because it focused so much on OTEL standards which will help us in future as OTEL is covering most of the observability standards. And also it has the best Kubernetes observability as I already explained it has several predefined dashboards …
Splunk Observability Cloud stood out for its real-time data ingestion, native OpenTelemetry support, and seamless correlation between metrics, traces, and logs, which gave us faster root cause analysis and better end-to-end visibility compared to Grafana setups that required …
To be honest, Datadog is very similar to Splunk and LogScale to a lesser degree, but it is just as good if you don't need too complex observability. Grafana is still growing and might reach the same level soon.
It's able to quickly detect and resolve issues across the entire spectrum of deployments including on-premises, public cloud, private cloud, hybrid cloud and multicloud
The above applications have their own use cases. Thousand Eyes or Sitescope is used for URL monitoring and Splunk is used for application monitoring. Appdynamics is also used for application monitoring and can monitor the server very well but it lacks when searching in logs …
Splunk is superior in many ways to these solutions when I'm comes to ingesting, storing, manipulating, and using data, but dynatraces automatic agents do make it much easier to use out of the box. Nagios seems much cheaper but does not provide as much functionality as Splunk. …
SQL is a great tool for smaller quick checks. When trying to monitor several different environments, applications, APIs, several thousand devices, connections, and technology, it just doesn't stand up to what you need. Splunk Infrastructure Monitoring has really stood out …
We are having other monitoring tools like AppDynamics, Dynatrace, Datadog and already using their end-user monitoring capability. Most of our customers are looking for agent-free monitoring where they don't want to instrument any agent on their client-side (as it might …
Splunk Infrastructure Monitoring provides far superior options for anybody using a complex hybrid multi-cloud environment and allows both your SOC and NOC to work together on the same data while driving their own insights.
We found other products are still in the old world view …
I have used New Relic in different scenarios like monitoring my production infrastructure and applications which helps us to reduce the downtime of my applications and websites and also I have used the synthetic monitoring feature which helps to proactively monitor our websites availability. Along with this I have also used New Relic for cloud resources cost monitoring which helps to reduce my cloud cost. Also I have used mobile application monitoring which helps me to trace the sessions easily and I can easily reduce my RCA through the help of that.
Good for below cases 1. There is a front end and need to correlate data with front end data 2. multiple microservices and need to check the health of each system 3. correlate data from various sources 4. Application performance is a key to be captured 5. application performance is a key metric.
New Relic APM allows us to follow up transactions across services and trace performance bottlenecks in real-time, crucial when monitoring the processing of energy loads or predictive maintenance algorithms.
It gives us deep visibility into our cloud servers, containers and IOT gateways, so we can catch CPU spikes or memory leaks which can impact the data we ingest from the field devices.
We develop custom dashboards for monitoring trends of power consumption, abnormality in sensors and API health. In conjunction with alerting, it makes sure we are fixing issues before customers even see them.
The first one is its Kubernetes container monitoring.
I really like this features because as we know how much K8s is vast and to manually monitor each part of the Kubernetes it takes so much time but Splunk Observability Cloud makes it easier. And even once we integrate K8s with Splunk Observability Cloud it gives us some prebuilt dashboards which gives holistic view of our Cluster and its nodes, pods, etc.
The dashbaord feature of Splunk Observability Cloud, it gives us full flexibility to customize our dashboard with a wide range of predefined chart types.
Now it also supports OTEL, which is a plus point for observability. As now everyone is moving towards Otel and in current market there are only few tools who supports OTEL based integrations, Splunk Observability Cloud is one out of them.
An indicator for errors on the navigations pane so that we don't have to go through each tab.
As we go more and more cloud maybe you guys can implement a pay-as-you-use strategy so that small companies using it not frequently can also afford it.
That's it can't think of any and it wont let me skip to next question. Thanks
I have not yet found any similar product that offers me this range of features to help us keep our online service fast and reliable. Besides this, New Relic is constantly evolving by adding new plugins to emerging technologies and platforms. Server performance measuring features are a key point as our user database grows.
Good: Stable system with low error rate Easy to use for simple use cases Bad: UI is not very clear for complex usage Mobile view (when logged in from phone) is bad No library for .net
I have given this much rating as I am used New Relic in different sectors and for different use cases like its K8s monitoring, infra monitoring, full stack monitoring as compare to other tools New Relic gives data in a formatted and connected way, and also it is giving us value for money. It also launches new features day by day which helps users to track the issue very quickly. It also supports OTel integrations which is the latest trend of observability tools. thats why I had given this much rating to New Relic.
Overall a great tool to have in your toolbox, It is very intuitive and our entire staff uses the tool. It is easy to use and cost is very reasonable. Splunk also has excellent support team and very easy to work with. Every time we had a challenge, support team was able to help us with the end result.
The support team has been really helpful and resolved most of the issues on time. However, for a couple of issues, several follow-ups were needed to elicit a reasonable response. The issue was deeply technical and could have been investigated only by their Architects, and bringing them into the ticket took longer than needed
The documentation was clear and concise; the only issue we ran into was custom application naming. Due to HTTPD mod_fcgid and the need for the application name to be set in php.ini (not in .htaccess or the virtual host directive) ... we had issues setting this up.
Before start using New Relic, we had a custom Grafana monitoring tool configured for our clients. Altough functional, it took too much time to add new alerts and monitoring features. New Relic is way easier and simpler to to configure and saves us a lot of time spent not only on configuration, but also keeping the service working.
To be honest, Datadog is very similar to Splunk and LogScale to a lesser degree, but it is just as good if you don't need too complex observability. Grafana is still growing and might reach the same level soon.