Quality product, delivers on promise
We use it to identify digital content performance, story trends and conversion tracking. We also use it to share engagement metrics with …

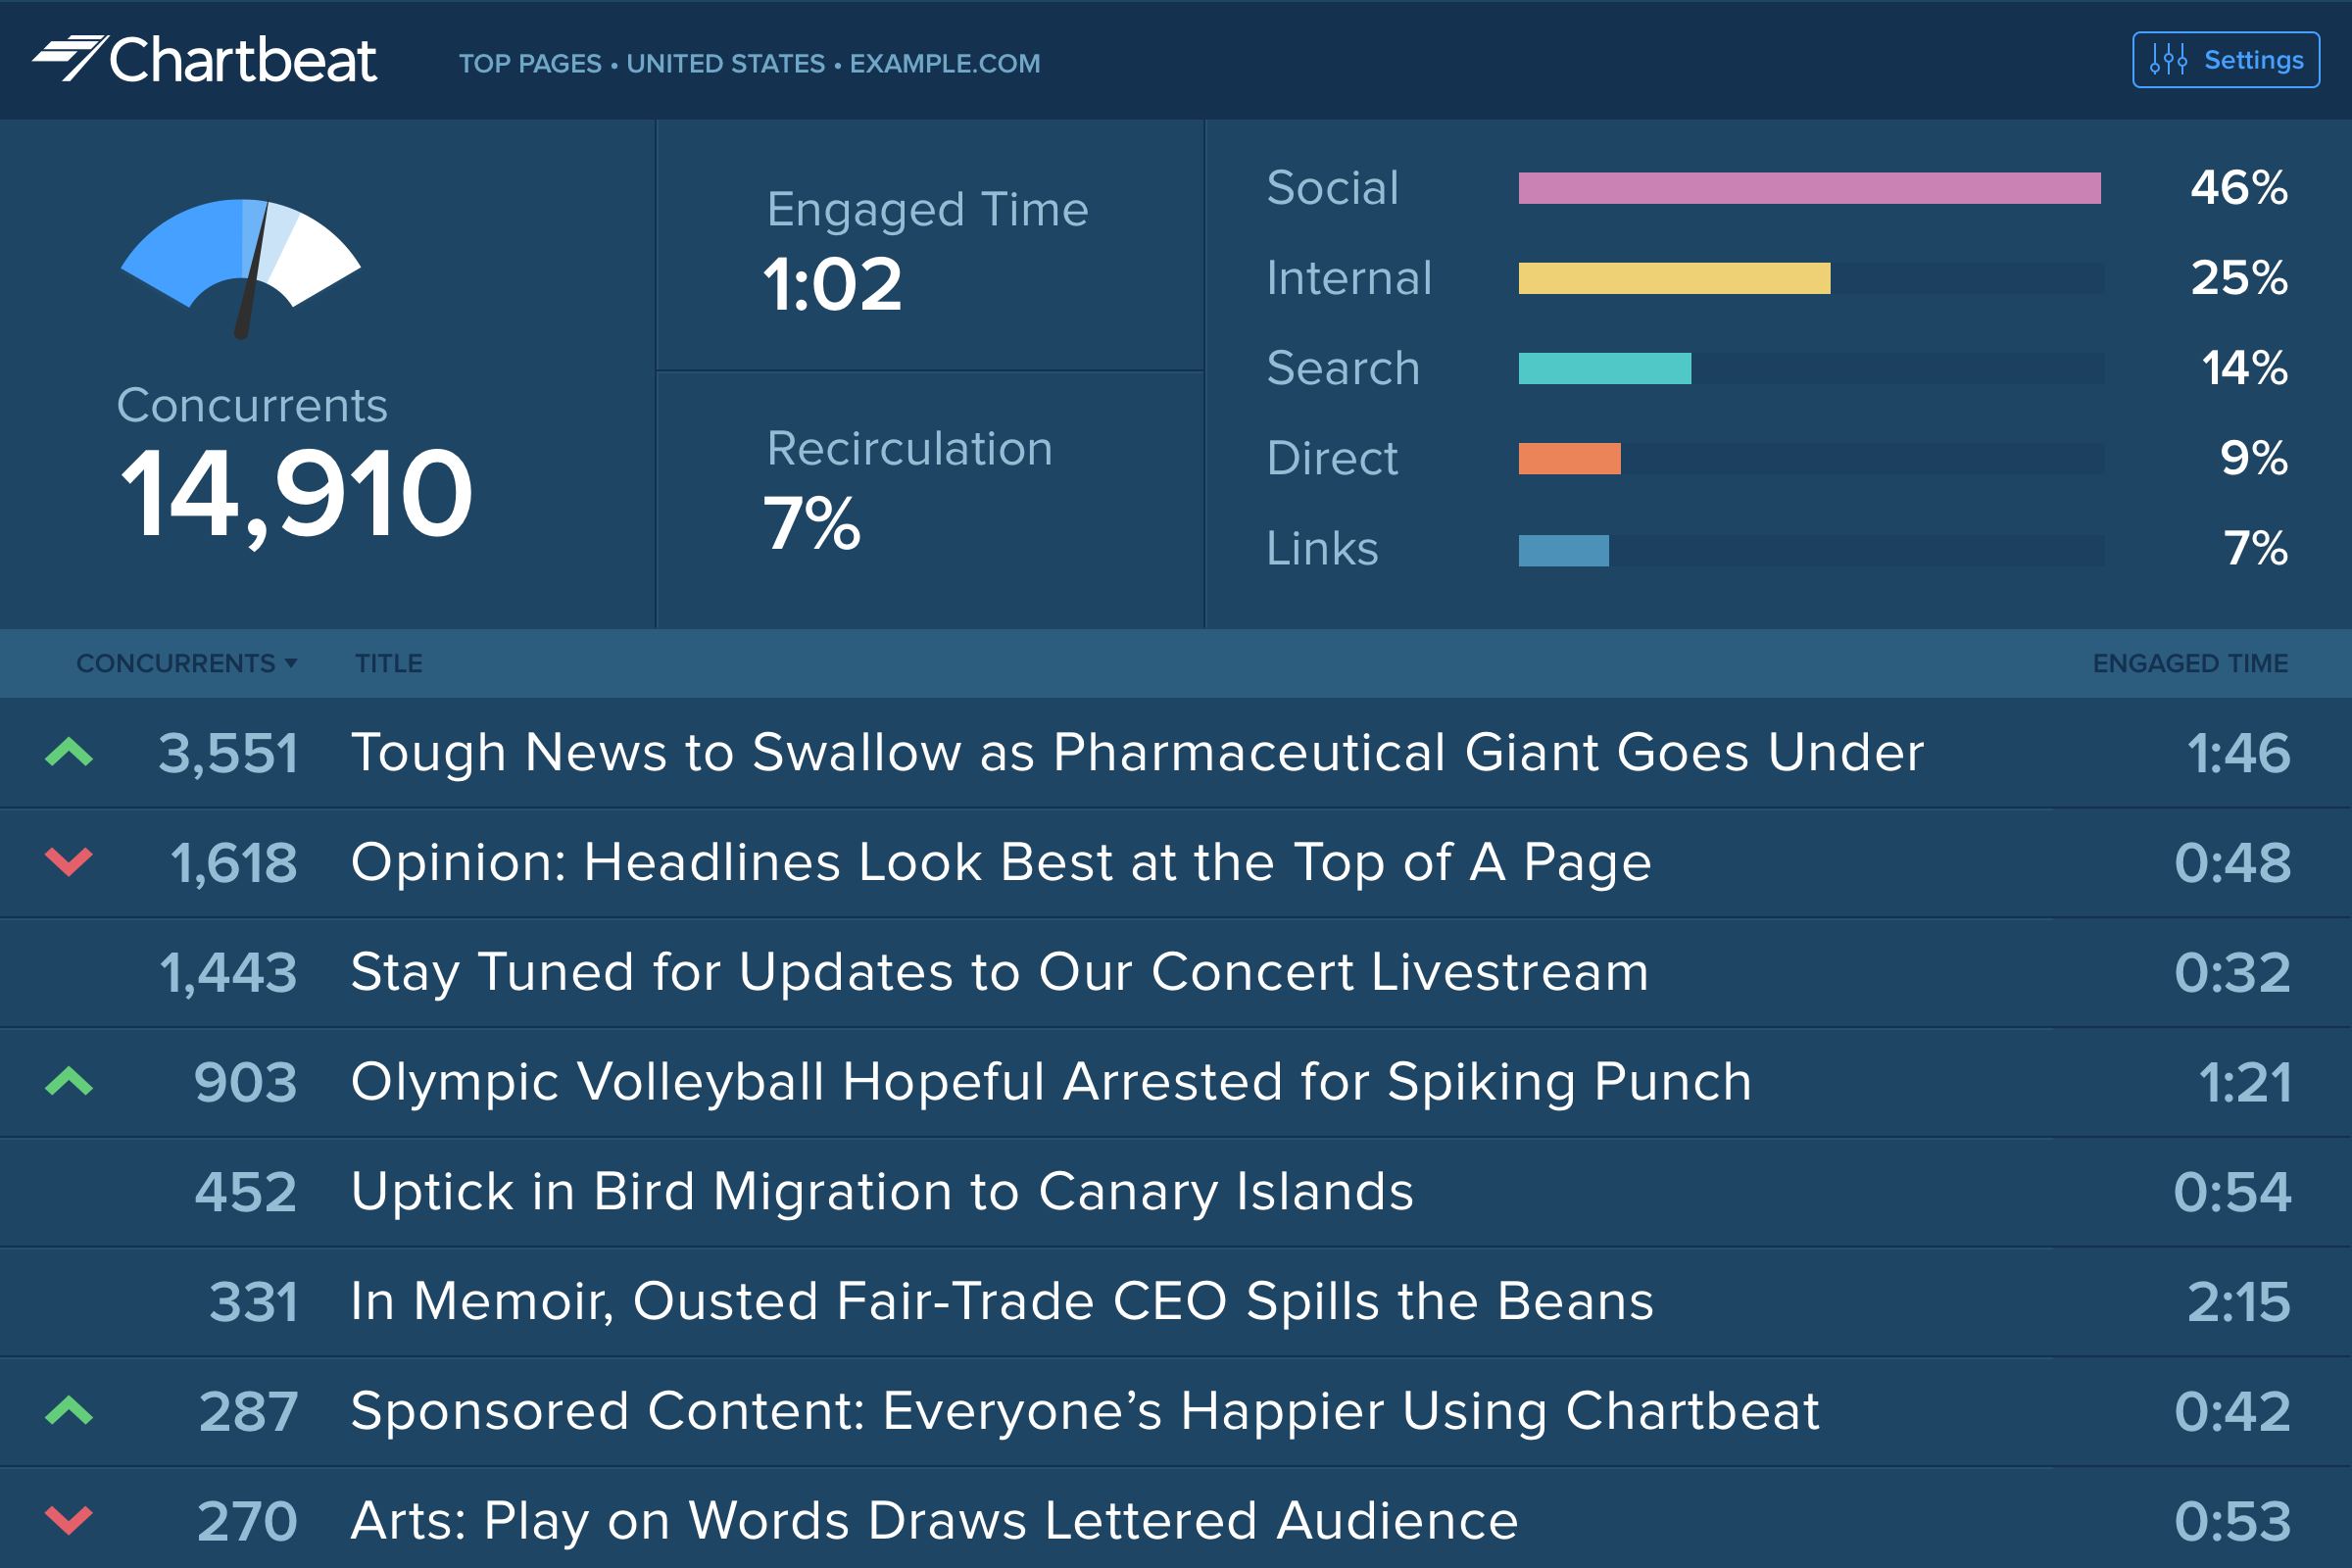
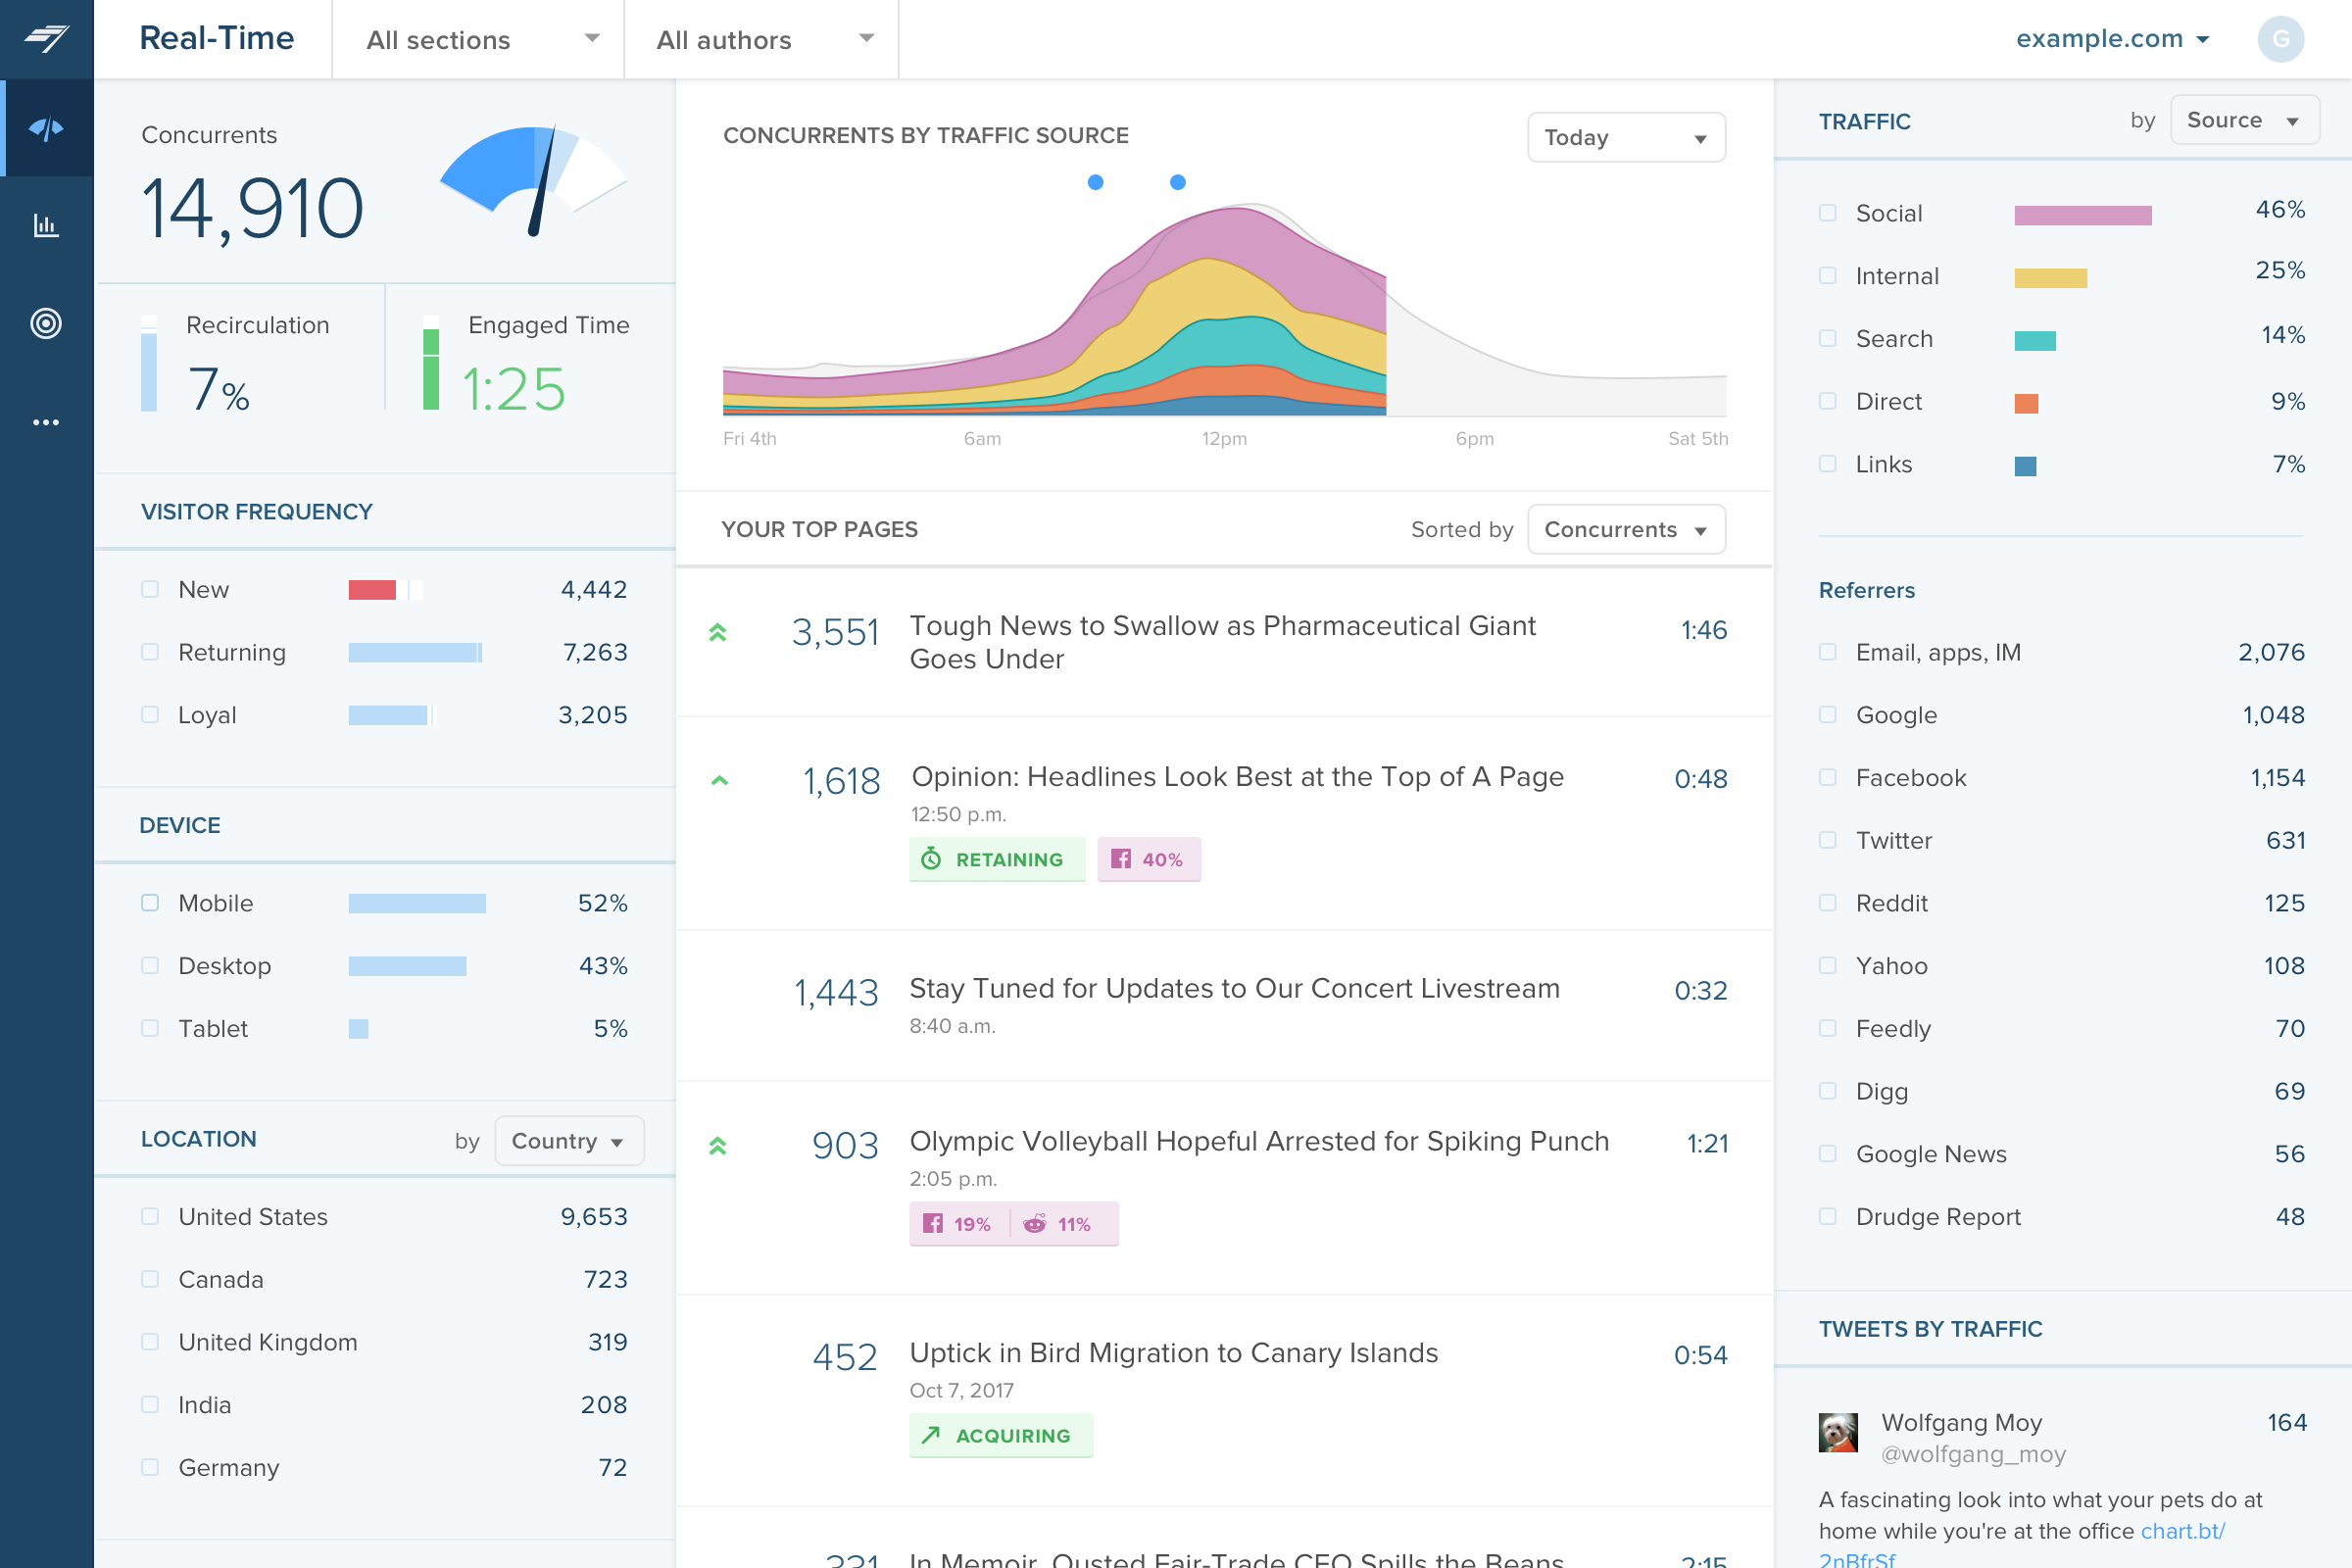
Chartbeat delivers real-time analytics, insights, and transformative tools for content teams around the world, to help improve audience engagement, inform editorial decisions, and increase loyalty.
Products that are considered exceptional by their customers based on a variety of criteria win TrustRadius awards. Learn more about the types of TrustRadius awards to make the best purchase decision. More about TrustRadius Awards
Chartbeat delivers real-time analytics, insights, and transformative tools for content teams around the world, to help improve audience engagement, inform editorial decisions, and increase loyalty.
20 people also want pricing
Google Analytics is perhaps the best-known web analytics product and, as a free product, it has massive adoption. Although it lacks some enterprise-level features compared to its competitors in the space, the launch of the paid Google Analytics Premium edition seems likely to close the gap.
Parse.ly is a content optimization platform for online publishers. It provides in-depth analytics and helps maximize the performance of the digital content. It features a dashboard geared for editorial and business staff and an API that can be used by a product team to create personalized or…
Web Analytic features such as SEO tracking, user engagement tracking, pageview tracking, and behavior analysis.
This tool allows you to follow a user's path through your website until they complete a certain action, like making a purchase or signing up for a newsletter, enabling you to understand what leads to conversions.
This feature measures the number of users who visit only one page on your website before leaving, helping to identify issues with content quality or website design.
This enables an overview of the type of devices or browsers users are using to access your website, helping in improving website design, usability, and visibility.
A feature that records and provides data on a specific page's popularity and the number of times it has been viewed by users.
This enables the tracking of specific actions or 'events' on your website, such as button clicks, form submissions, and engagement with other interactive elements.
This feature provides immediate data and analysis about web traffic and user behavior, facilitating real-time decision making.
This feature tracks the original source of your web traffic, informing you where your users are coming to your site from whether it be through other websites, social media, etc.
This feature allows users to personalize their view of data and reports to focus on specific metrics that best fit their business needs.
Chartbeat, a content intelligence platform for publishers, empowers media companies to build loyal audiences with real-time and historical editorial analytics across desktop, social, and mobile platforms. Chartbeat helps digital publishing organizations understand what, within their content, is keeping people engaged. Partnering with over 60,000 media brands across 70+ countries, Chartbeat’s real-time and historical dashboards, in-depth headline testing and in-page optimization tools, and reporting help media organizations understand, measure, and build business value from the attention earned by their written and video content.


| Deployment Types | Software as a Service (SaaS), Cloud, or Web-Based |
|---|---|
| Operating Systems | Unspecified |
| Mobile Application | Apple iOS, Android |
| Supported Countries | All |