Adobe Commerce Intelligence vs. Jama Analyze (Discontinued) vs. Microsoft BI (MSBI)
Adobe Commerce Intelligence vs. Jama Analyze (Discontinued) vs. Microsoft BI (MSBI)
| Product | Rating | Most Used By | Product Summary | Starting Price |
|---|---|---|---|---|
 Adobe Commerce Intelligence | N/A | Adobe Commerce Intelligence (formerly Magento BI) is an ecommerce analytics solution that provides data pipeline, warehouse and visualization capabilities. It was acquired by Magento, and is now owned and supported by Adobe. | N/A | |
 Jama Analyze (Discontinued) | Mid-Size Companies (51-1,000 employees) | Jama Analyze (formerly called Notion) was a solution for quickly creating shareable, custom dashboards. However, the product is no longer available. Jama Software sunset the Analyze product in 2019. Some of the benefits of Jama Analyze included the ability to: Create custom metrics across all teams with data from any source with the intuitive metric builder. Experience self-serve BI with no coding and no IT to get started making custom dashboards.… | $23 per month | |
 Microsoft BI (MSBI) | N/A | Microsoft BI is a business intelligence product used for data analysis and generating reports on server-based data. It features unlimited data analysis capacity with its reporting engine, SQL Server Reporting Services alongside ETL, master data management, and data cleansing. | $14 per month per user |
| Adobe Commerce Intelligence | Jama Analyze (Discontinued) | Microsoft BI (MSBI) | ||||||||||||||||||||||
|---|---|---|---|---|---|---|---|---|---|---|---|---|---|---|---|---|---|---|---|---|---|---|---|---|
| Editions & Modules | No answers on this topic |
|
| |||||||||||||||||||||
| Offerings |
| |||||||||||||||||||||||
| Entry-level Setup Fee | No setup fee | No setup fee | No setup fee | |||||||||||||||||||||
| Additional Details | — | — | — | |||||||||||||||||||||
| More Pricing Information | ||||||||||||||||||||||||
| Adobe Commerce Intelligence | Jama Analyze (Discontinued) | Microsoft BI (MSBI) |
|---|
| Adobe Commerce Intelligence | Jama Analyze (Discontinued) | Microsoft BI (MSBI) | |||||||||||||||||||||||||||
|---|---|---|---|---|---|---|---|---|---|---|---|---|---|---|---|---|---|---|---|---|---|---|---|---|---|---|---|---|---|
| BI Standard Reporting |
| ||||||||||||||||||||||||||||
| Ad-hoc Reporting |
| ||||||||||||||||||||||||||||
| Report Output and Scheduling |
| ||||||||||||||||||||||||||||
| Data Discovery and Visualization |
| ||||||||||||||||||||||||||||
| Access Control and Security |
| ||||||||||||||||||||||||||||
| Mobile Capabilities |
| ||||||||||||||||||||||||||||
| Application Program Interfaces (APIs) / Embedding |
|
| Adobe Commerce Intelligence | Jama Analyze (Discontinued) | Microsoft BI (MSBI) | |
|---|---|---|---|
| Small Businesses |  Webgility Score 9.6 out of 10 |  Yellowfin Score 8.7 out of 10 | Yellowfin Score 8.7 out of 10 |
| Medium-sized Companies |  Looker Score 8.4 out of 10 |  Reveal Score 10.0 out of 10 | Reveal Score 10.0 out of 10 |
| Enterprises | Looker Score 8.4 out of 10 |  Kyvos Semantic Layer Score 9.5 out of 10 | Kyvos Semantic Layer Score 9.5 out of 10 |
| All Alternatives | View all alternatives | View all alternatives | View all alternatives |
| Adobe Commerce Intelligence | Jama Analyze (Discontinued) | Microsoft BI (MSBI) | |
|---|---|---|---|
| Likelihood to Recommend | 9.0 (2 ratings) | 8.0 (1 ratings) | 9.9 (73 ratings) |
| Likelihood to Renew | - (0 ratings) | - (0 ratings) | 8.0 (25 ratings) |
| Usability | 9.0 (1 ratings) | - (0 ratings) | 10.0 (15 ratings) |
| Availability | - (0 ratings) | - (0 ratings) | 9.5 (2 ratings) |
| Performance | - (0 ratings) | - (0 ratings) | 7.0 (2 ratings) |
| Support Rating | 9.0 (1 ratings) | - (0 ratings) | 8.9 (15 ratings) |
| In-Person Training | - (0 ratings) | - (0 ratings) | 6.9 (3 ratings) |
| Online Training | - (0 ratings) | - (0 ratings) | 8.5 (2 ratings) |
| Implementation Rating | - (0 ratings) | - (0 ratings) | 9.6 (7 ratings) |
| Configurability | - (0 ratings) | - (0 ratings) | 10.0 (2 ratings) |
| Adobe Commerce Intelligence | Jama Analyze (Discontinued) | Microsoft BI (MSBI) | |
|---|---|---|---|
| Likelihood to Recommend | Adobe
 Ali Kazempour Information Technology Adviser | Jama Software
| Microsoft
|
| Pros | Adobe
 Kristen Edgerton Merchandise Manager | Jama Software
| Microsoft
 Nilufa Hossain IT Specialist |
| Cons | Adobe
Ali Kazempour Information Technology Adviser | Jama Software
| Microsoft
|
| Likelihood to Renew | Adobe No answers on this topic | Jama Software No answers on this topic | Microsoft
 Lee Cullom President |
| Usability | Adobe
Ali Kazempour Information Technology Adviser | Jama Software No answers on this topic | Microsoft
|
| Reliability and Availability | Adobe No answers on this topic | Jama Software No answers on this topic | Microsoft
 Robert Goodman Director, Business Intelligence & Analytics |
| Performance | Adobe No answers on this topic | Jama Software No answers on this topic | Microsoft
Robert Goodman Director, Business Intelligence & Analytics |
| Support Rating | Adobe
Ali Kazempour Information Technology Adviser | Jama Software No answers on this topic | Microsoft
 Jacob Saunders National Practice Director - Business Intelligence |
| In-Person Training | Adobe No answers on this topic | Jama Software No answers on this topic | Microsoft
 Stephanie Grice Business Intelligence Analyst |
| Online Training | Adobe No answers on this topic | Jama Software No answers on this topic | Microsoft
 Sean Brady Business Intelligence Architect |
| Implementation Rating | Adobe No answers on this topic | Jama Software No answers on this topic | Microsoft
Jacob Saunders National Practice Director - Business Intelligence |
| Alternatives Considered | Adobe
Ali Kazempour Information Technology Adviser | Jama Software
| Microsoft
|
| Return on Investment | Adobe
Ali Kazempour Information Technology Adviser | Jama Software No answers on this topic | Microsoft
 Haibo Yang BI Reporting Specialist |
| ScreenShots | Jama Analyze (Discontinued) Screenshots     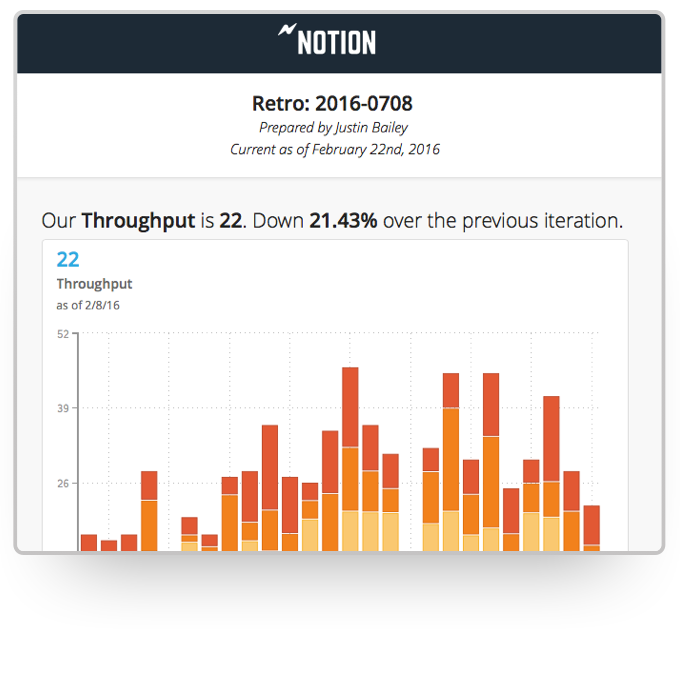 |