Akamai mPulse vs. AppNeta
Akamai mPulse vs. AppNeta
| Product | Rating | Most Used By | Product Summary | Starting Price |
|---|---|---|---|---|
 Akamai mPulse | N/A | mPulse, from Akamai, is a real-time end-user digital experience monitoring solution (or RUM, for real user monitoring) that enables the user to capture user experience data, optimize website performance, and measure ROI. | N/A | |
 AppNeta | Enterprise companies (1,001+ employees) | AppNeta provides performance monitoring solutions for distributed, cloud-connected, digital enterprises. AppNeta’s SaaS-based solutions give IT teams application and network performance data, allowing them to constantly monitor user experience across any application, network, data center or cloud. | N/A |
| Akamai mPulse | AppNeta | |||||||||||||||
|---|---|---|---|---|---|---|---|---|---|---|---|---|---|---|---|---|
| Editions & Modules | No answers on this topic | No answers on this topic | ||||||||||||||
| Offerings |
| |||||||||||||||
| Entry-level Setup Fee | No setup fee | No setup fee | ||||||||||||||
| Additional Details | — | — | ||||||||||||||
| More Pricing Information | ||||||||||||||||
| Akamai mPulse | AppNeta |
|---|
| Akamai mPulse | AppNeta | |
|---|---|---|
| Small Businesses |  SolarWinds Pingdom Score 9.5 out of 10 | SolarWinds Pingdom Score 9.5 out of 10 |
| Medium-sized Companies |  Cisco ThousandEyes Score 8.9 out of 10 | Cisco ThousandEyes Score 8.9 out of 10 |
| Enterprises | Cisco ThousandEyes Score 8.9 out of 10 | Cisco ThousandEyes Score 8.9 out of 10 |
| All Alternatives | View all alternatives | View all alternatives |
| Akamai mPulse | AppNeta | |
|---|---|---|
| Likelihood to Recommend | 7.0 (1 ratings) | 6.0 (2 ratings) |
| Support Rating | - (0 ratings) | 5.0 (1 ratings) |
| Akamai mPulse | AppNeta | |
|---|---|---|
| Likelihood to Recommend | Akamai
|  Broadcom
|
| Pros | Akamai
| Broadcom
 Richard Phung Sr. Windows Administrator |
| Cons | Akamai
| Broadcom
|
| Support Rating | Akamai No answers on this topic | Broadcom
|
| Alternatives Considered | Akamai
| Broadcom
Richard Phung Sr. Windows Administrator |
| Return on Investment | Akamai
| Broadcom
|
| ScreenShots | AppNeta Screenshots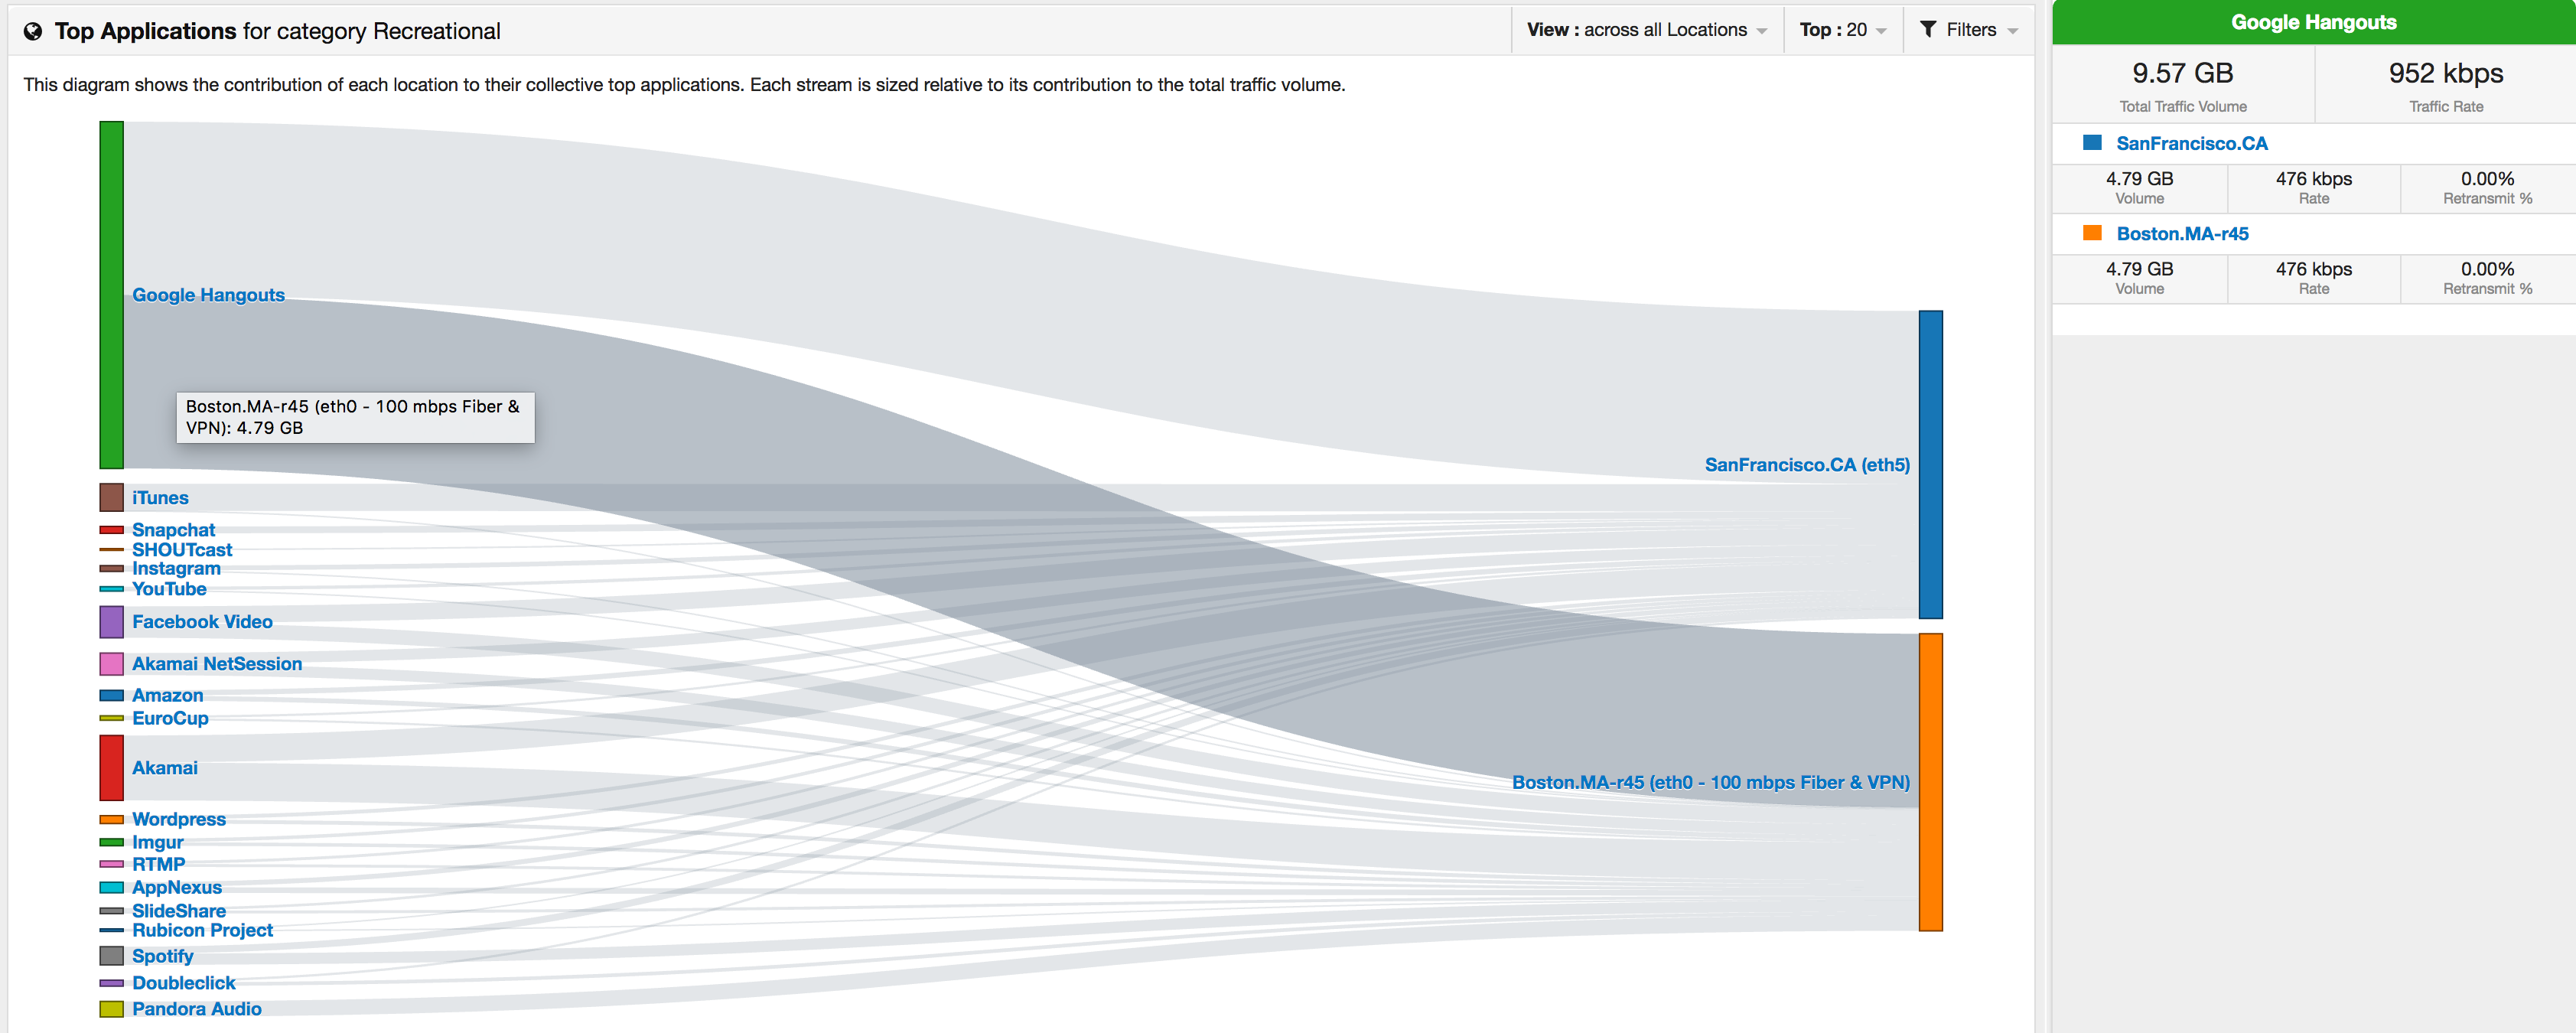 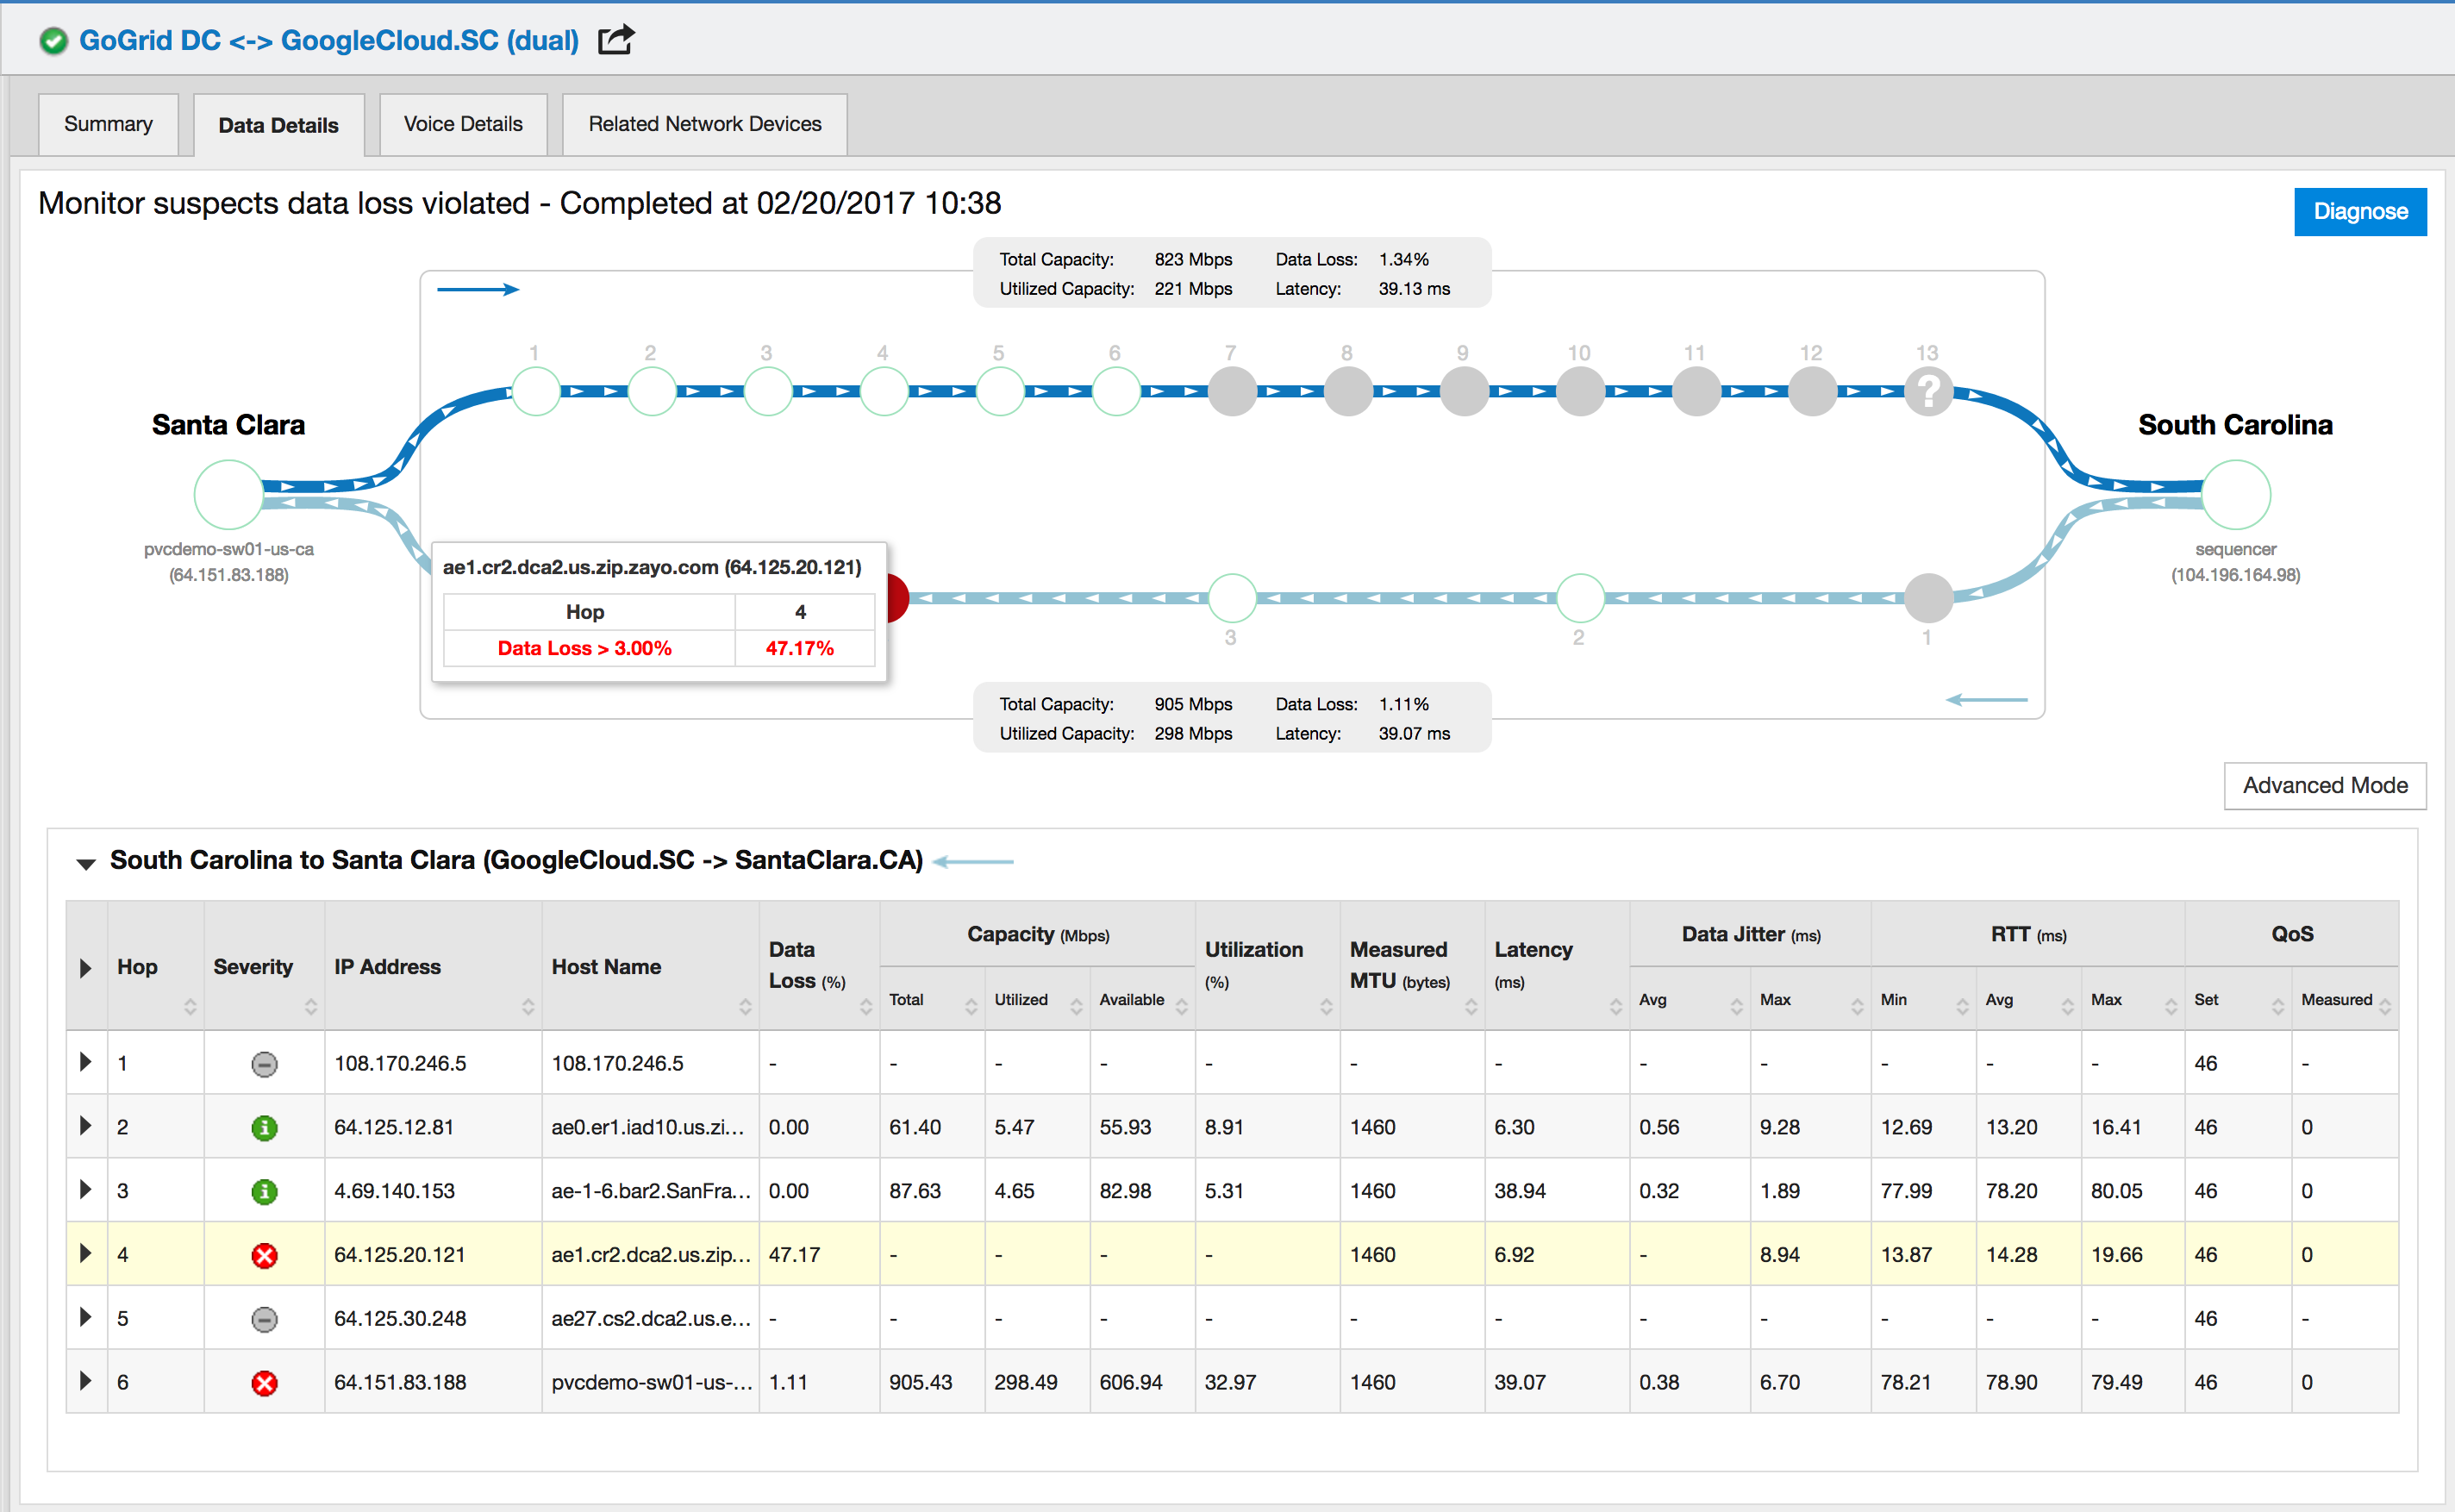   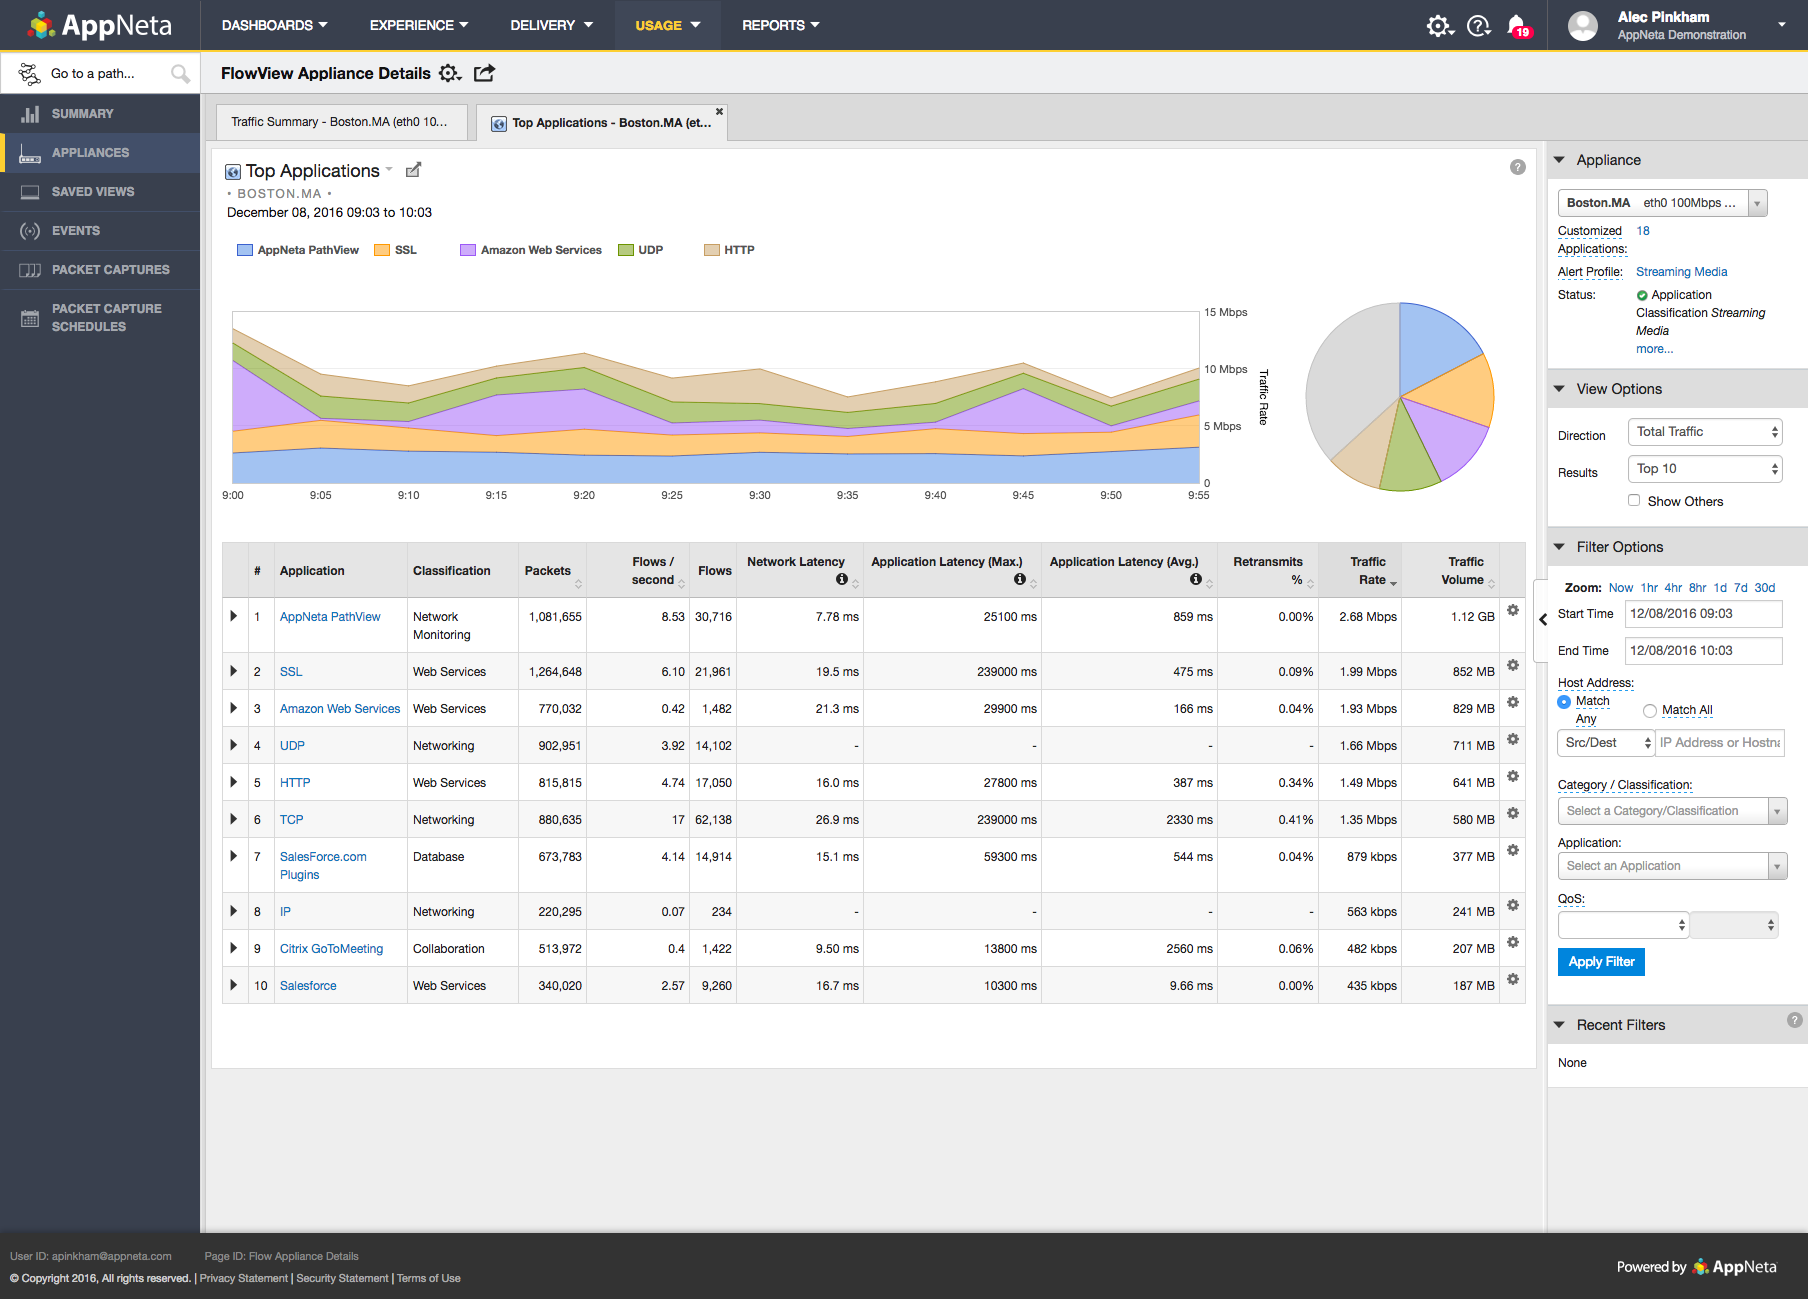  |