Amazon CloudWatch vs. AppNeta
Amazon CloudWatch vs. AppNeta
| Product | Rating | Most Used By | Product Summary | Starting Price |
|---|---|---|---|---|
 Amazon CloudWatch | N/A | Amazon CloudWatch is a native AWS monitoring tool for AWS programs. It provides data collection and resource monitoring capabilities. | $0 per canary run | |
 AppNeta | Enterprise companies (1,001+ employees) | AppNeta provides performance monitoring solutions for distributed, cloud-connected, digital enterprises. AppNeta’s SaaS-based solutions give IT teams application and network performance data, allowing them to constantly monitor user experience across any application, network, data center or cloud. | N/A |
| Amazon CloudWatch | AppNeta | |||||||||||||||
|---|---|---|---|---|---|---|---|---|---|---|---|---|---|---|---|---|
| Editions & Modules |
| No answers on this topic | ||||||||||||||
| Offerings |
| |||||||||||||||
| Entry-level Setup Fee | No setup fee | No setup fee | ||||||||||||||
| Additional Details | With Amazon CloudWatch, there is no up-front commitment or minimum fee; you simply pay for what you use. You will be charged at the end of the month for your usage. | — | ||||||||||||||
| More Pricing Information | ||||||||||||||||
| Amazon CloudWatch | AppNeta |
|---|
| Amazon CloudWatch | AppNeta | |
|---|---|---|
| Small Businesses |  InfluxDB Score 8.8 out of 10 |  SolarWinds Pingdom Score 9.5 out of 10 |
| Medium-sized Companies |  Logz.io Score 8.5 out of 10 |  Cisco ThousandEyes Score 8.9 out of 10 |
| Enterprises |  NetBrain Technologies Score 9.2 out of 10 | Cisco ThousandEyes Score 8.9 out of 10 |
| All Alternatives | View all alternatives | View all alternatives |
| Amazon CloudWatch | AppNeta | |
|---|---|---|
| Likelihood to Recommend | 7.7 (40 ratings) | 6.0 (2 ratings) |
| Usability | 7.0 (3 ratings) | - (0 ratings) |
| Support Rating | 8.4 (8 ratings) | 5.0 (1 ratings) |
| Amazon CloudWatch | AppNeta | |
|---|---|---|
| Likelihood to Recommend | Amazon AWS
|  Broadcom
|
| Pros | Amazon AWS
 Apurv Doshi Senior Solutions Architect | Broadcom
 Richard Phung Sr. Windows Administrator |
| Cons | Amazon AWS
| Broadcom
|
| Usability | Amazon AWS
| Broadcom No answers on this topic |
| Support Rating | Amazon AWS
 Ramindu Deshapriya Lead Consultant - Technology | Broadcom
|
| Alternatives Considered | Amazon AWS
| Broadcom
Richard Phung Sr. Windows Administrator |
| Return on Investment | Amazon AWS
 Rob Domenico Senior Systems Administrator | Broadcom
|
| ScreenShots | Amazon CloudWatch Screenshots     | AppNeta Screenshots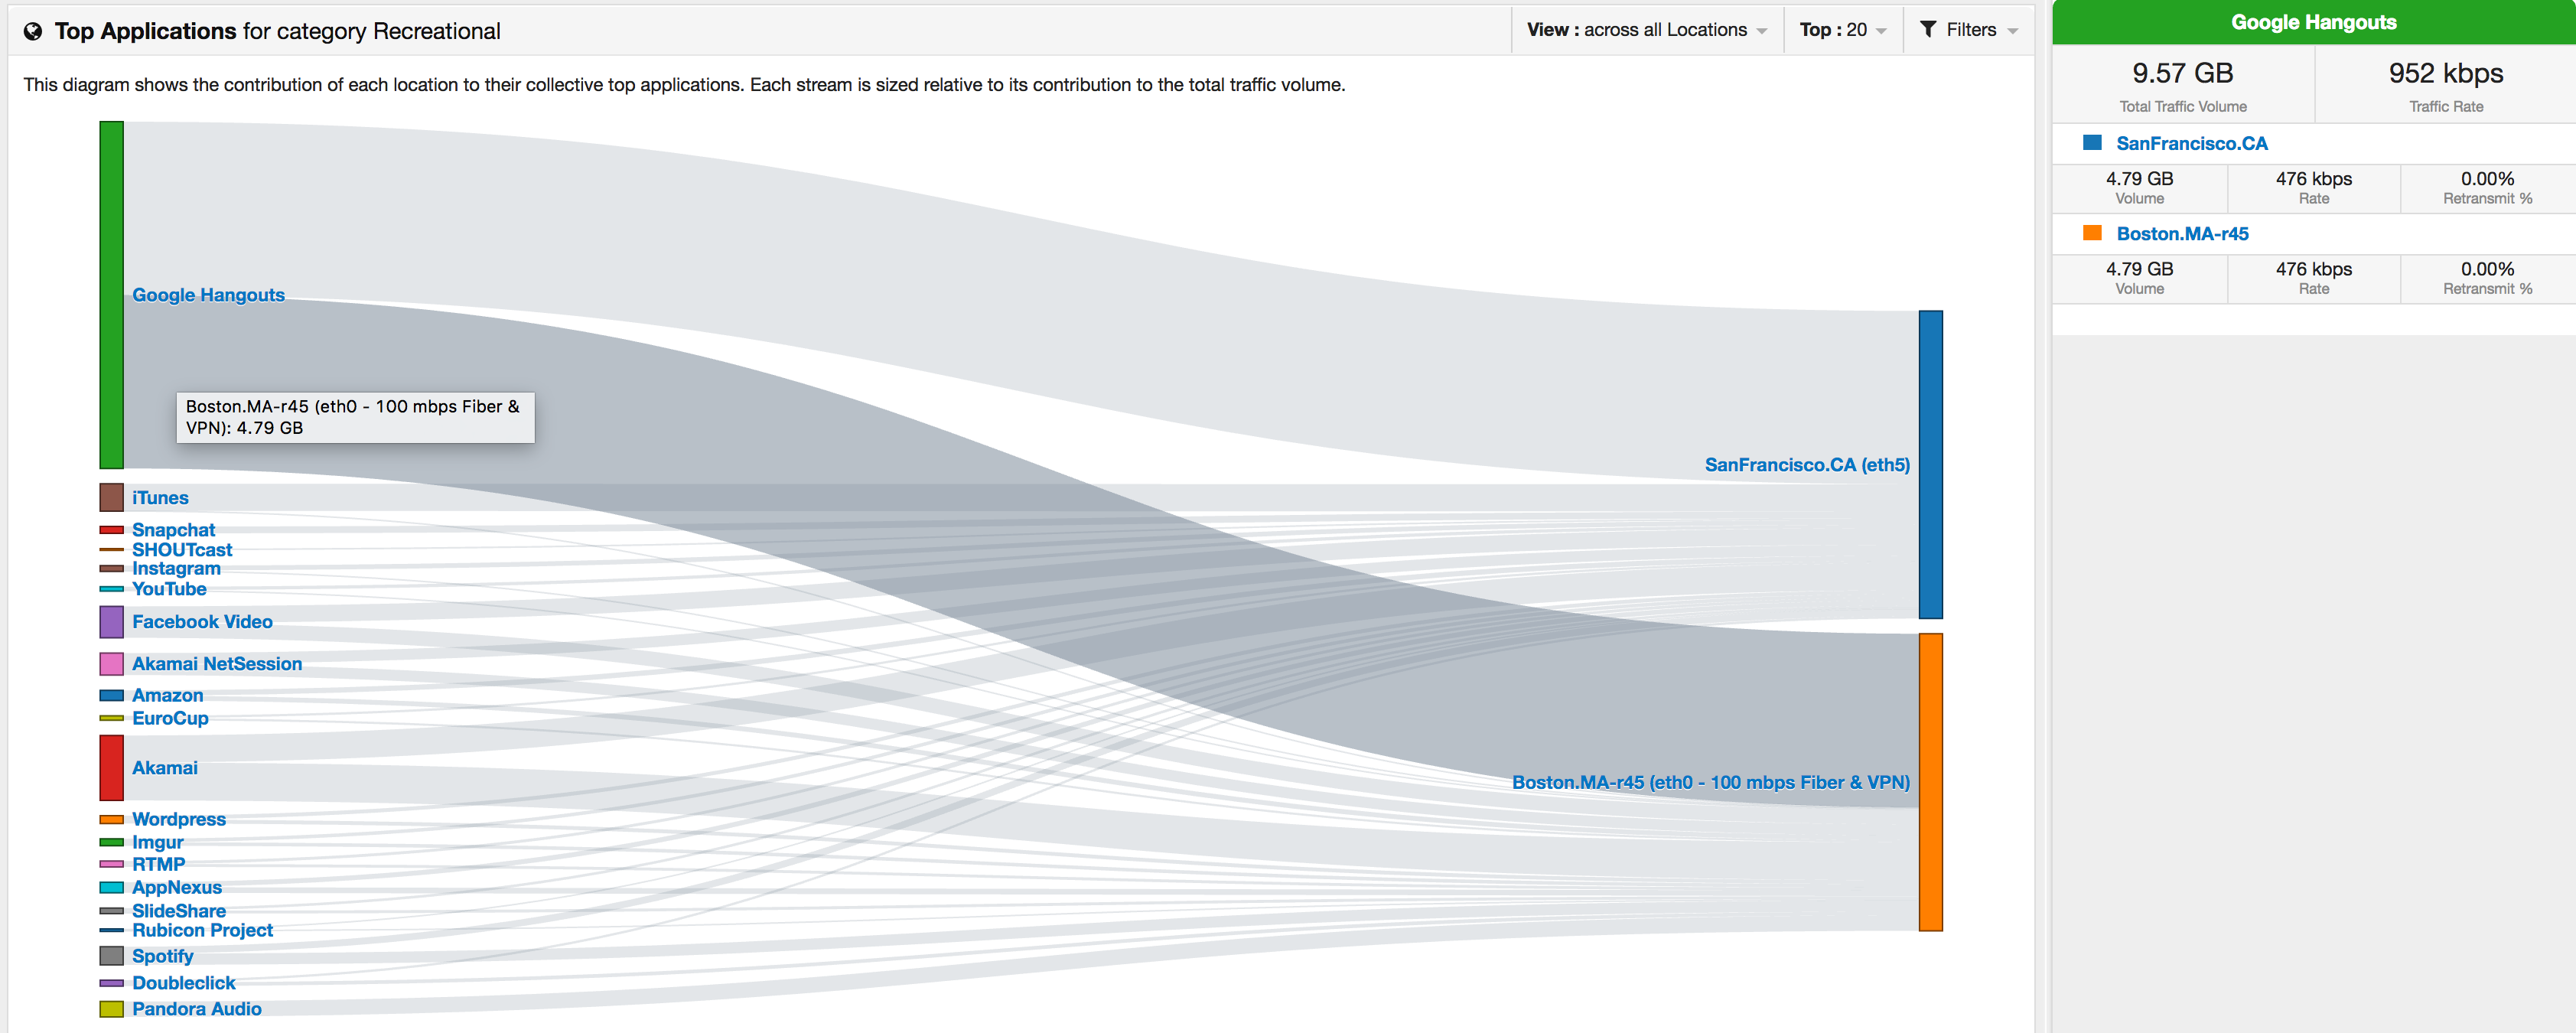 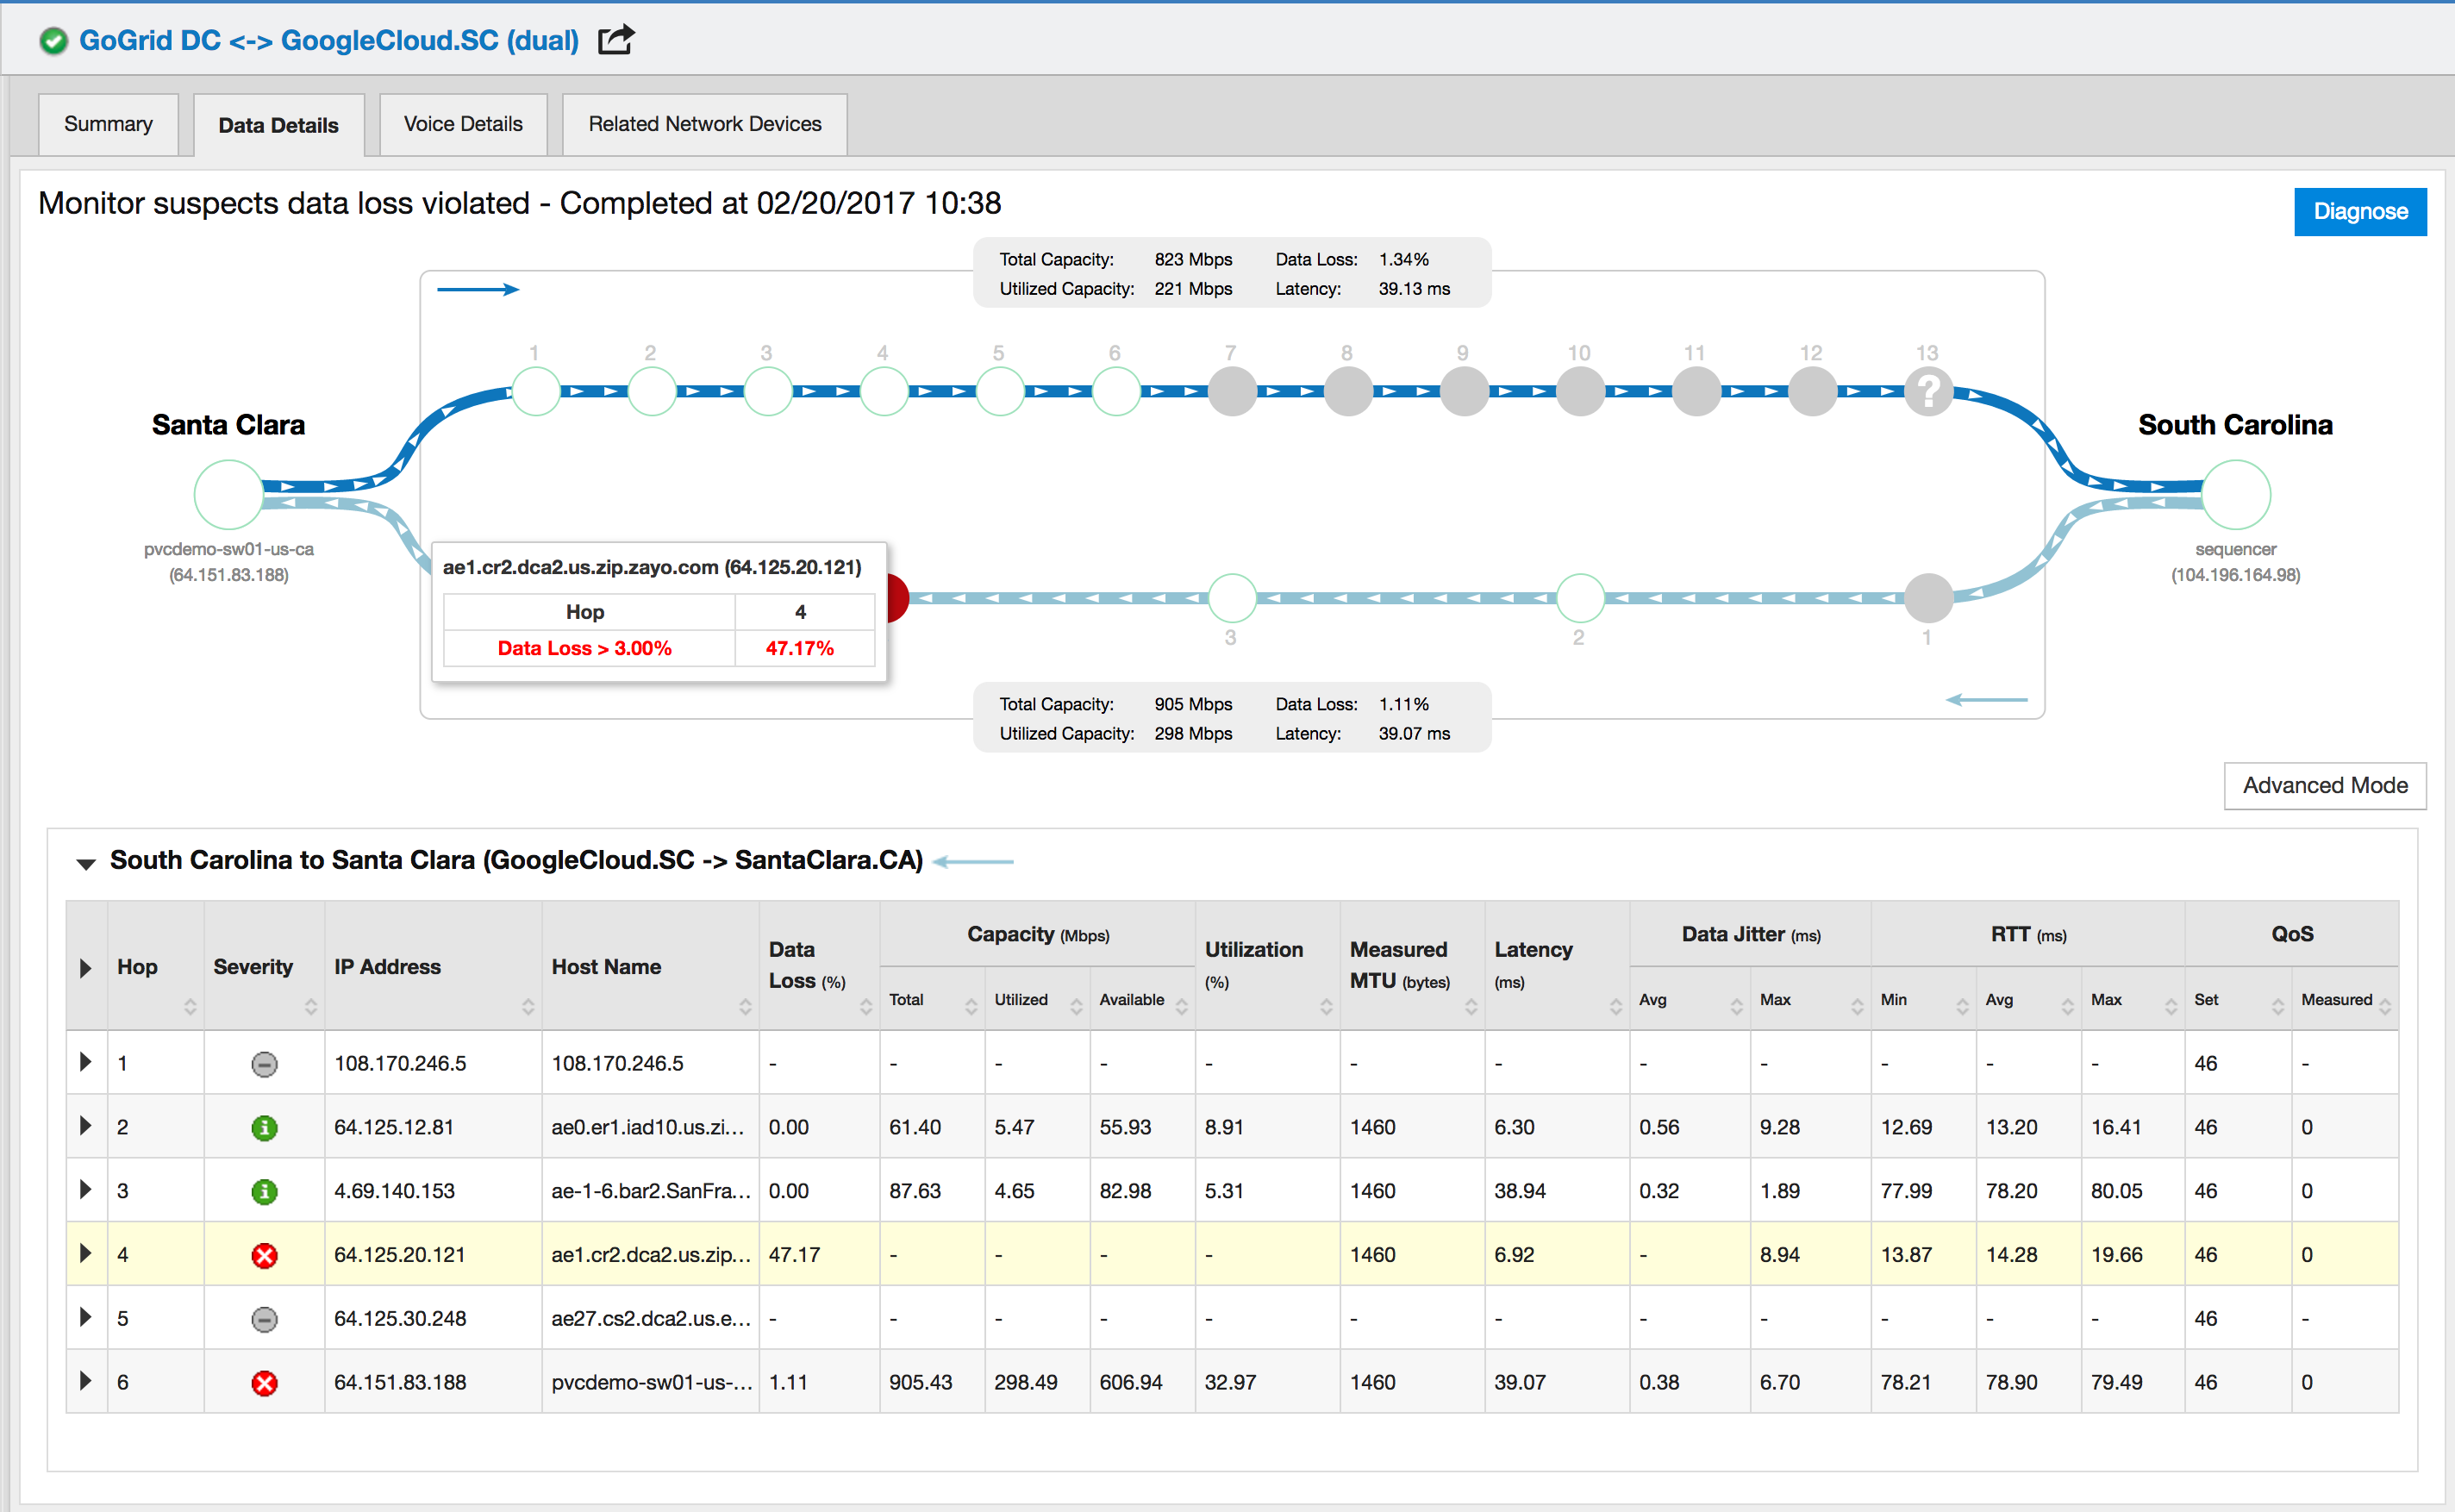   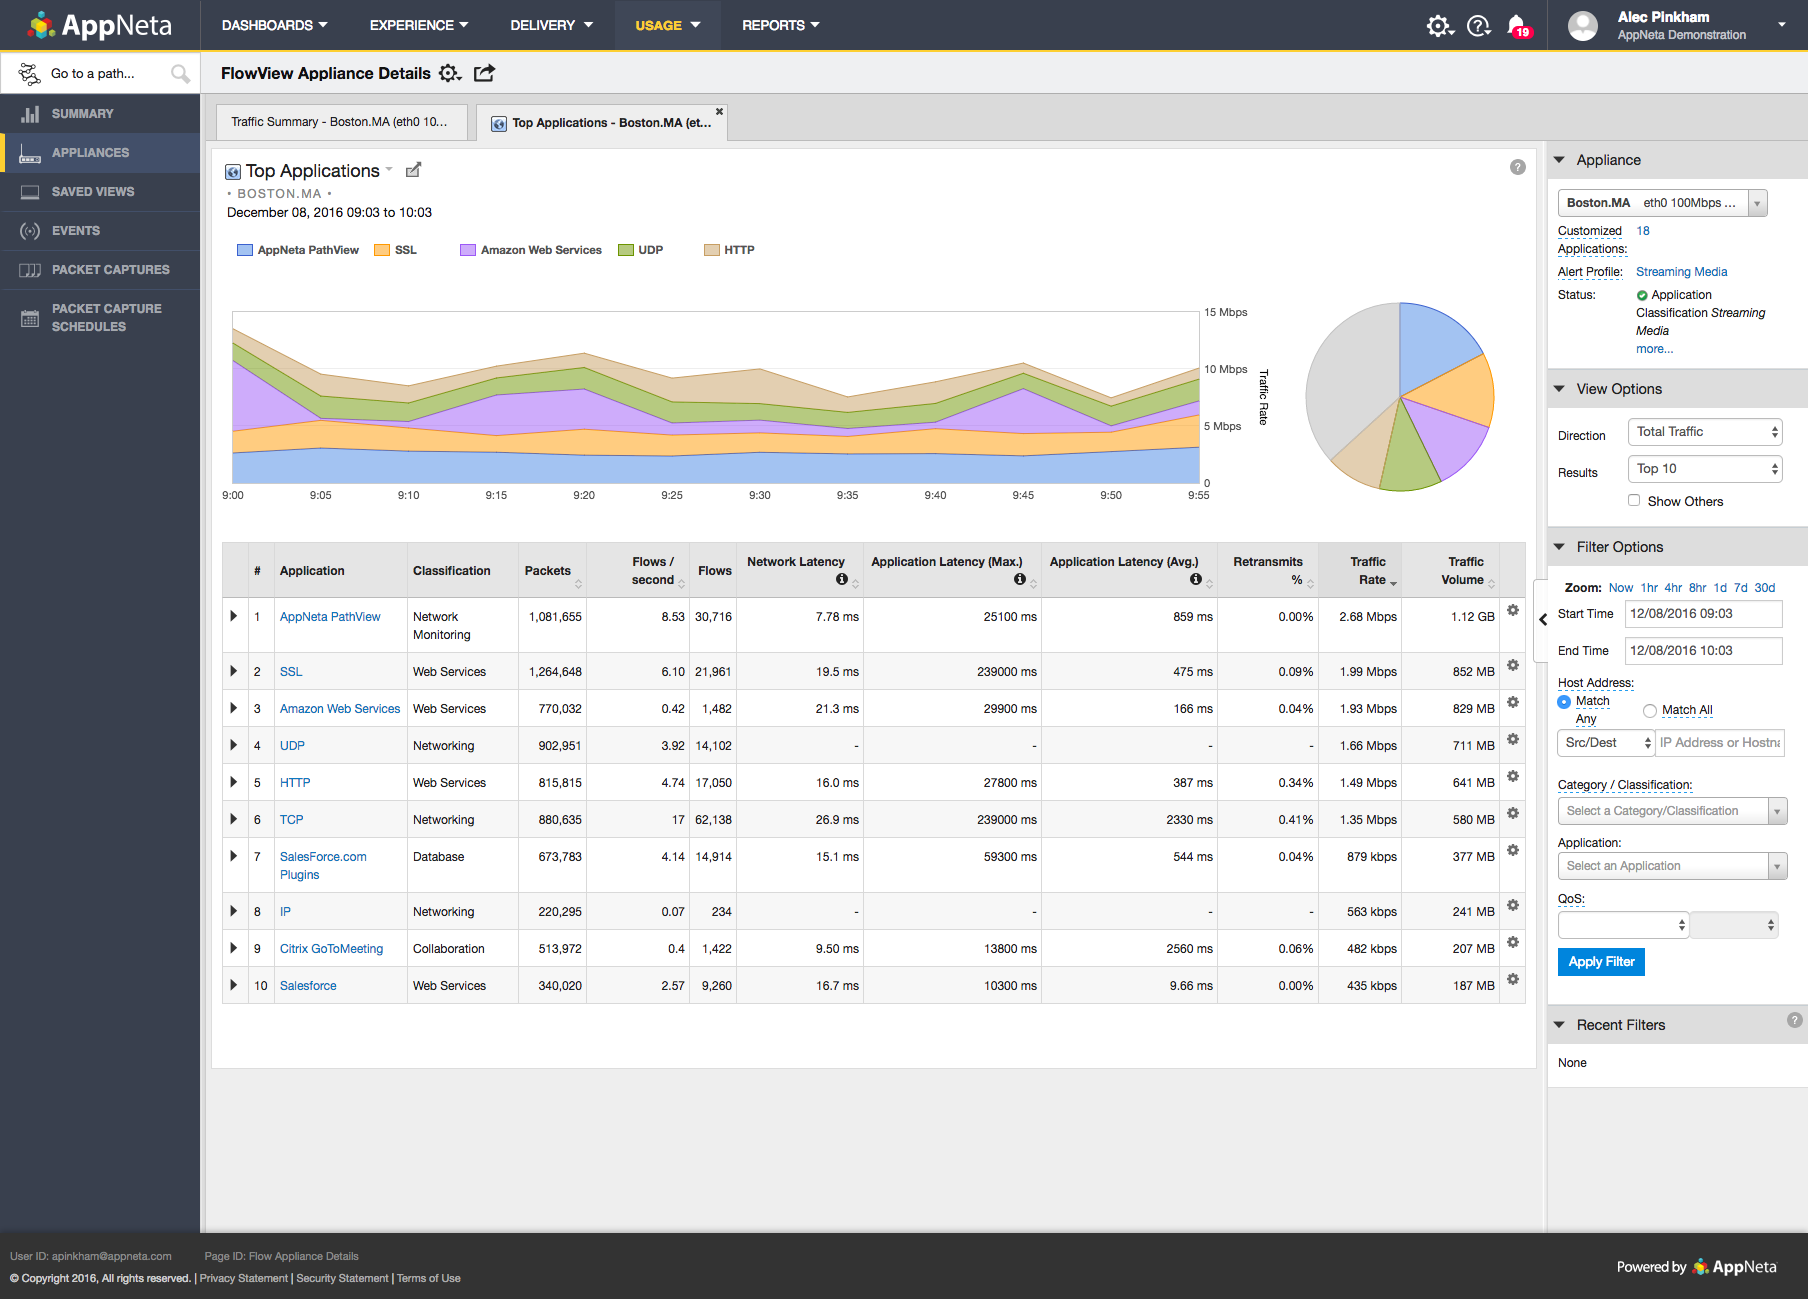  |