ConnectWise PSA (formerly Manage) is a business management platform for companies that sell, service, and support technology. The platform is cloud-based and integrates automation, help desk and customer service, sales, marketing, project management, and business analytics. It is the hub of the ConnectWise suite.
$35
Per Tech Per Month
Vizlib
Score 1.0 out of 10
N/A
Vizlib builds value-added products for Qlik Sense. Their solutions aim to empower data-driven organisations to extend their analytics capabilities. Simplicity that supports data literacy and helps data users and consumers uncover meaningful insights independently – unlocking the true potential of data. Leveraging its capabilities, the vendor states organisations go from mere data reporting to data storytelling in seconds, close the analytics loop, and significantly boost their time-to…
N/A
Pricing
ConnectWise PSA
Vizlib
Editions & Modules
Subscription
$35.00
Per Tech Per Month
No answers on this topic
Offerings
Pricing Offerings
ConnectWise PSA
Vizlib
Free Trial
No
Yes
Free/Freemium Version
No
Yes
Premium Consulting/Integration Services
No
No
Entry-level Setup Fee
No setup fee
No setup fee
Additional Details
—
—
More Pricing Information
Community Pulse
ConnectWise PSA
Vizlib
Features
ConnectWise PSA
Vizlib
Incident and problem management
Comparison of Incident and problem management features of Product A and Product B
ConnectWise PSA
8.7
88 Ratings
6% above category average
Vizlib
-
Ratings
Organize and prioritize service tickets
9.388 Ratings
00 Ratings
Expert directory
6.950 Ratings
00 Ratings
Subscription-based notifications
8.361 Ratings
00 Ratings
ITSM collaboration and documentation
8.168 Ratings
00 Ratings
Ticket creation and submission
9.888 Ratings
00 Ratings
Ticket response
9.687 Ratings
00 Ratings
Self Help Community
Comparison of Self Help Community features of Product A and Product B
ConnectWise PSA
8.1
82 Ratings
1% above category average
Vizlib
-
Ratings
External knowledge base
8.467 Ratings
00 Ratings
Internal knowledge base
7.877 Ratings
00 Ratings
Multi-Channel Help
Comparison of Multi-Channel Help features of Product A and Product B
ConnectWise PSA
9.2
85 Ratings
14% above category average
Vizlib
-
Ratings
Customer portal
8.080 Ratings
00 Ratings
IVR
10.021 Ratings
00 Ratings
Social integration
10.028 Ratings
00 Ratings
Email support
9.580 Ratings
00 Ratings
Help Desk CRM integration
8.575 Ratings
00 Ratings
BI Standard Reporting
Comparison of BI Standard Reporting features of Product A and Product B
ConnectWise PSA
-
Ratings
Vizlib
9.3
1 Ratings
14% above category average
Pixel Perfect reports
00 Ratings
10.01 Ratings
Customizable dashboards
00 Ratings
10.01 Ratings
Report Formatting Templates
00 Ratings
8.01 Ratings
Ad-hoc Reporting
Comparison of Ad-hoc Reporting features of Product A and Product B
ConnectWise PSA
-
Ratings
Vizlib
7.0
2 Ratings
11% below category average
Drill-down analysis
00 Ratings
10.01 Ratings
Formatting capabilities
00 Ratings
10.01 Ratings
Report sharing and collaboration
00 Ratings
1.02 Ratings
Report Output and Scheduling
Comparison of Report Output and Scheduling features of Product A and Product B
ConnectWise PSA
-
Ratings
Vizlib
10.0
1 Ratings
20% above category average
Publish to PDF
00 Ratings
10.01 Ratings
Data Discovery and Visualization
Comparison of Data Discovery and Visualization features of Product A and Product B
BrightGauge lets us know when we have critical issues that need solving. A massive influx of tickets all at the same time triggers an investigation. Usually, it is tied to a server going down, which we can address. It would not be helpful for a small MSP or IT department with just a few daily tickets. The stats are better used to track a large amount of clients.
I have read reviews where Vizlib is performing well. That was not our experience integrating Vizlib with Qlik Sense cloud as a write back capability. So, my experience is that integrating Vizlib with Qlik Sense cloud as a write back capability is probably not an area where they perform well
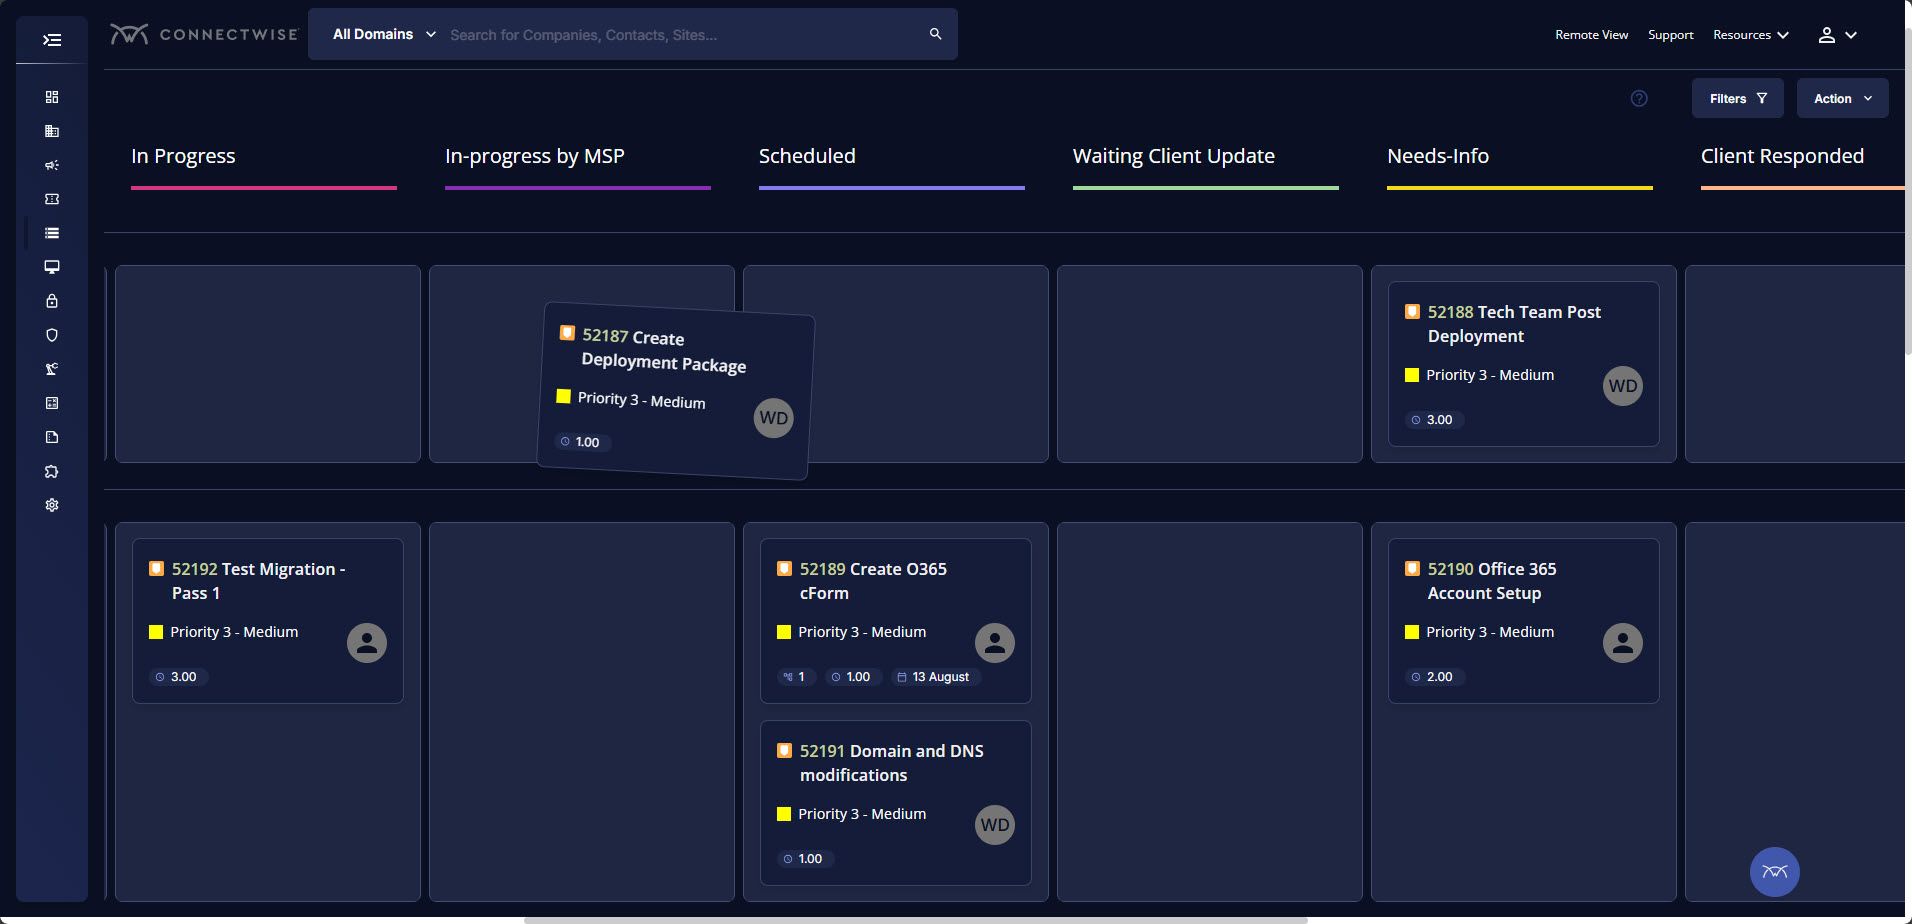
Tickets- Customers can email and a ticket is generated and falls under their profile for historical records. You can save documents and select if they are customer facing or only internal facing. The option as well to have communication in tickets whether its internal facing or customer facing is nice to have when you're trying to keep a record or important details for just internal means and the customer doesn't have to see all the jargon.
Procurement - It's great to have this integrate with Quosal Sell. Quotes being processed into opportunities and then into a sales order which connects to a ticket or project is pretty easy to use. It does have a learning curve but once you get the hang of it, it's straightforward. Everything is pretty connected, whether keeping track of products customers have purchased historically through us, to knowing what ticket is associated to an RMA.
Annual or more than annualized data is desperately needed for MSPs to show trends, current limitation is previous 240 days for ConnectWise tickets
Alerts when datasets do not sync properly, I have to rely on my team to notice vs get an automated alert from BrightGauge
Small thing, but it would be nice to have more options on the report scheduler to enable a start date. If you wish to do it quarterly, you have to start the schedule exactly 3 months from the next run.
Vizlib promised a writeback capability that it just was not able to deliver. We bought additional developer licenses for QlikSense that were not planned in the initial Vizlib discussions, but even with they were not able to implement a writeback capability.
I feel Support was horrible... very slow, and with inadequate expertise.
ConnectWise has uniquely positioned themselves with the Modern Office Suite to have direct integration with a nearly full suite of tools for MSPs. Although each tool may not necessarily be the absolute best tool on the market, the efficiencies leveraged through direct integration make the entire suite an obvious choice for most companies.
I have been using ConnectWise since 2004 and I am impressed with the progress they have made. However, there are still bugs that don't work quite like they should. If I were to run reports and get consistent answers along with a couple other annoyances, then I would score CW as a 10
We have figured out how to use Vizlib features on our own on many occasions. Whenever we do run into questions, the support team is very helpful and able to help us figure out how to do things quickly. I feel features are more advanced, but we know the depth is there when we’re ready to use it
We use the cloud version of ConnectWise and in the last 5 years it has never been down for us during business hours. I can only recall 1 time when it was not available during off hours when we wanted to use it.
Some tab for certain areas load speeds could be better. Dashboards can load slowly when they reference multiple reports. Some reports can load slowly based on the tables and views they are accessing. At times the SQL queries being performed in the background can actually timeout and a tab or screen will fail to load.
The front line support techs are wildly inconsistent when it comes to the level of support. Sometimes you get someone who just wants to throw links to University documentation at you, sometimes you get someone who truly tries to understand your issue and confers with peers and managers to find an answer, and sometimes you get someone who just wants to create a ticket and escalate immediately. If you ask three different techs the same question you will probably get three different answers, one of them being, "That's not possible."
Vizlib support is awesome! We have quick turnaround times and regular updates when we open cases. It’s so good we often ask them Qlik Sense questions, rather than going to Qlik support
We are a telecoms company. Whilst CW were very happy to sell us their product and tell us how good it is for telecoms. All the training material is geared towards IT MSP's. The on-line training material was virtually useless. We found the implementation a bit of a joke. They tried telling us 12 hours of implementation time would be sufficient to launch the product. We erred on the side of caution and paid for 24 hours. This was quickly eaten away and we were nowhere near ready to go-live. I find the on-line chat facility is of much more use for us.
Rather than letting them sell you a block of time for implementation, create a list of things that must be completed do declare the implementation complete. The implementer will have the discretion on what they set up and in what order. They will be trying to end their services in as little time as possible and may not get things set up right. You are best advised to hire a third-party wizard that has done many of these setups. Record the audio and video of all of your implementation sessions.
Everyone but dynamics had holes in it. Dynamics is good, but it requires more development time. I spoke with some people that have CW and liked it. But when I inquired after our frustrations, I discovered they had a full time scheduling & logistics CW manager and the field people were using it purely like any other more simplistic ticket system. They said it would be impossible otherwise. The one big difference is the transparency of the sales effort. The other sales people were honest on the limitations or potential challenges and worked with us. They also worked with our agenda. At CW they don't have that option. The consulting time is eaten through a pre-formatted agenda which they communicate too you, not with you.
ConnectWise seems to have a good understanding of the IT service industry. During the required onboarding training, they even preach configuring only features that you need right now, as you can always scale up later. The feature set for the most part takes into considerations all aspects of an IT business, whether small or enterprise, or growing from one to the next.
We have had a negative experience with Vizlib... we paid for a capability that wasn't delivered, and that cost us time that could have been better spend on other priorities. Negative ROI.