TrustRadius: an HG Insights company

Save this comparison

Save this comparison

Add Product

Recommended Comparisons

    Overview
    ProductRatingMost Used ByProduct SummaryStarting Price

    Colrows

    N/A
    Enterprise companies (1,001+ employees)
    Colrows builds and deploys data AI agents, analytics, reporting, migration, and pipeline root-cause-analysis agents, for enterprises operating on regulated or complex data. Delivery happens through forward-deployed engineering: a Colrows engineer builds the governed infrastructure and agents against the customer's real data, then hands the system over. Underneath is Colrows' own product, a deterministic semantic compiler that resolves natural language into…

    $16,000

    per year per installation

    Tableau Cloud

    Score8.1 out of 10
    N/ATableau Cloud (formerly Tableau Online) is a self-service analytics platform that is fully hosted in the cloud. Tableau Cloud enables users to publish dashboards and invite colleagues to explore hidden opportunities with interactive visualizations and accurate data, from any browser or mobile device.

    $15

    per month per user

    Pricing
    ColrowsTableau Cloud
    Editions & Modules
    No answers on this topic
    Tableau Viewer
    $15
    per month billed annually per user
    Enterprise Viewer
    $35
    per month billed annually per user
    Tableau Explorer
    $42
    per month billed annually per user
    Enterprise Explorer
    $70
    per month billed annually per user
    Tableau Creator
    $75
    per month billed annually per user
    Enterprise Creator
    $115
    per month billed annually per user
    Tableau+
    Contact Sales
    Offerings
    Pricing Offerings
    ColrowsTableau Cloud
    Free Trial
    NoNo
    Free/Freemium Version
    YesNo
    Premium Consulting/Integration Services
    YesNo
    Entry-level Setup FeeNo setup feeNo setup fee
    Additional Details——
    More Pricing Information
    Community Pulse
    ColrowsTableau Cloud
    Considered Both Products
    ALTERBASICS TECHNOLOGIES PRIVATE LIMITED
    No answer on this topic
    Tableau
    No answer on this topic
    Key User Insights
    Would buy again
    No answers on this topic
    96%
    Would buy again
    27 Answers
    Delivers good value for the price
    No answers on this topic
    92%
    Delivers good value for the price
    22 Answers
    Happy with the feature set
    No answers on this topic
    89%
    Happy with the feature set
    25 Answers
    Lived up to sales and marketing promises
    No answers on this topic
    100%
    Lived up to sales and marketing promises
    14 Answers
    Implementation went as expected
    No answers on this topic
    100%
    Implementation went as expected
    13 Answers
    Features
    ColrowsTableau Cloud
    BI Standard Reporting
    Comparison of BI Standard Reporting features of Colrows and Tableau Cloud
    Feature
    Colrows
    -
    Ratings
    Tableau Cloud
    7.6
    74 Ratings
    7% below category average
    Pixel Perfect reports00 Ratings7.656 Ratings
    Customizable dashboards00 Ratings8.774 Ratings
    Report Formatting Templates00 Ratings6.663 Ratings
    Ad-hoc Reporting
    Comparison of Ad-hoc Reporting features of Colrows and Tableau Cloud
    Feature
    Colrows
    -
    Ratings
    Tableau Cloud
    7.6
    74 Ratings
    5% below category average
    Drill-down analysis00 Ratings8.574 Ratings
    Formatting capabilities00 Ratings7.371 Ratings
    Integration with R or other statistical packages00 Ratings6.147 Ratings
    Report sharing and collaboration00 Ratings8.672 Ratings
    Report Output and Scheduling
    Comparison of Report Output and Scheduling features of Colrows and Tableau Cloud
    Feature
    Colrows
    -
    Ratings
    Tableau Cloud
    7.8
    72 Ratings
    5% below category average
    Publish to Web00 Ratings8.668 Ratings
    Publish to PDF00 Ratings7.567 Ratings
    Report Versioning00 Ratings7.655 Ratings
    Report Delivery Scheduling00 Ratings8.559 Ratings
    Delivery to Remote Servers00 Ratings6.738 Ratings
    Data Discovery and Visualization
    Comparison of Data Discovery and Visualization features of Colrows and Tableau Cloud
    Feature
    Colrows
    -
    Ratings
    Tableau Cloud
    7.9
    70 Ratings
    1% below category average
    Pre-built visualization formats (heatmaps, scatter plots etc.)00 Ratings8.267 Ratings
    Location Analytics / Geographic Visualization00 Ratings8.366 Ratings
    Predictive Analytics00 Ratings7.857 Ratings
    Pattern Recognition and Data Mining00 Ratings7.26 Ratings
    Access Control and Security
    Comparison of Access Control and Security features of Colrows and Tableau Cloud
    Feature
    Colrows
    -
    Ratings
    Tableau Cloud
    8.4
    69 Ratings
    1% below category average
    Multi-User Support (named login)00 Ratings8.363 Ratings
    Role-Based Security Model00 Ratings7.756 Ratings
    Multiple Access Permission Levels (Create, Read, Delete)00 Ratings8.659 Ratings
    Report-Level Access Control00 Ratings8.87 Ratings
    Single Sign-On (SSO)00 Ratings8.754 Ratings
    Mobile Capabilities
    Comparison of Mobile Capabilities features of Colrows and Tableau Cloud
    Feature
    Colrows
    -
    Ratings
    Tableau Cloud
    7.5
    59 Ratings
    3% below category average
    Responsive Design for Web Access00 Ratings7.457 Ratings
    Mobile Application00 Ratings7.744 Ratings
    Dashboard / Report / Visualization Interactivity on Mobile00 Ratings7.851 Ratings
    Application Program Interfaces (APIs) / Embedding
    Comparison of Application Program Interfaces (APIs) / Embedding features of Colrows and Tableau Cloud
    Feature
    Colrows
    -
    Ratings
    Tableau Cloud
    7.0
    41 Ratings
    10% below category average
    REST API00 Ratings8.136 Ratings
    Javascript API00 Ratings7.534 Ratings
    iFrames00 Ratings6.833 Ratings
    Java API00 Ratings5.729 Ratings
    Themeable User Interface (UI)00 Ratings6.735 Ratings
    Customizable Platform (Open Source)00 Ratings7.232 Ratings
    Best Alternatives
    ColrowsTableau Cloud
    Small Businesses
    No answers on this topic
    Cyfe
    Score4 out of 10
    Medium-sized Companies
    Toad Data Point
    Score8.4 out of 10
    Qlik Cloud Analytics (Qlik Sense)
    Score8.1 out of 10
    Enterprises
    Datameer
    Score8.4 out of 10
    Jaspersoft Community Edition
    Score7 out of 10
    All AlternativesView all alternativesView all alternatives
    User Ratings
    ColrowsTableau Cloud
    Likelihood to Recommend
    -
    (0 ratings)
    8.9
    (76 ratings)
    Usability
    -
    (0 ratings)
    8.6
    (29 ratings)
    Support Rating
    -
    (0 ratings)
    8.7
    (20 ratings)
    Data Sharing and Collaboration
    -
    (0 ratings)
    8.0
    (49 ratings)
    Data Sources
    -
    (0 ratings)
    8.3
    (49 ratings)
    User Testimonials
    ColrowsTableau Cloud
    Likelihood to Recommend
    ALTERBASICS TECHNOLOGIES PRIVATE LIMITED
    No answers on this topic
    Tableau
    If you're using Tableau as the primary BI tool, then Tableau Cloud is well suited to publish and share the results with a wide(r) audience. It is well suited for various degrees of self-service proficiency, from pure consumers of analytical work to more advanced users who can use web editing for smaller or larger adjustments, and even for desktop power users who will publish their work to Tableau Cloud. It has many good ways to organize the content and make it easily accessible via search, favorites, folders, collections ("playlists for your data"), or history ("recents"). It might not be ideally suited if there are many on-prem sources to be used (even though there are options to connect them) or if you have very special requirements regarding custom server setup, which is limited in a shared cloud environment like Tableau Cloud.
    Incentivized
    Read full review
    Pros
    ALTERBASICS TECHNOLOGIES PRIVATE LIMITED
    No answers on this topic
    Tableau
    • Tableau Online is completely cloud based and that's why the reports and dashboards are accessible even on the go. One doesn't always need to access the office laptop to access the reports.
    • The visualizations are interactive and one can quickly change the level at which they want to view the information. For example, one person might be more interested in looking at the country level performances rather than client level. This is intuitive and one doesn't need to create multiple reports for the same.
    • The feature to ask questions in plain vanilla English language is great and helpful. For quick adhoc fact checks one can simply type what they are looking for and the Natural Language Programming algorithms under the hood parse the query, interpret it and then fetch the results accordingly in a visual form.
    Incentivized
    Read full review
    Cons
    ALTERBASICS TECHNOLOGIES PRIVATE LIMITED
    No answers on this topic
    Tableau
    • Can be a steep learning curve for new users
    • Modeling and building algorithms aren't always intuitive and take some testing/retesting to ensure it's working as it should
    • Inability to integrate easily with our HRIS platform. Reports are pulled from HRIS at various intervals and uploaded into Tableau
    Incentivized
    Read full review
    Usability
    ALTERBASICS TECHNOLOGIES PRIVATE LIMITED
    No answers on this topic
    Tableau
    Based on comments from our clients, I awarded it this grade. Non-technical customers frequently compliment us on the ease with which they can utilize Tableau Online. Usability is rarely a source of contention amongst our customers. Few complaints have come from me as a user of our internal products.
    Incentivized
    Read full review
    Support Rating
    ALTERBASICS TECHNOLOGIES PRIVATE LIMITED
    No answers on this topic
    Tableau
    I have not had any issues that require customer support from Tableau at this time, which speaks well to Tableau. I have taken an online course with Tableau and it was very professional and well done, so based on that I would assume a similar level of quality for their customer service.
    Incentivized
    Read full review
    Alternatives Considered
    ALTERBASICS TECHNOLOGIES PRIVATE LIMITED
    No answers on this topic
    Tableau
    In determining whether to go with Tableau Online versus Alteryx, two important factors stood out in determining our go-to solution. First, while Alteryx is an impressive tool for data cleansing, it did not stack up in terms of data visualization capabilities. Tableau, on the other hand, provided us everything we needed in terms of visualizing our data and analytics. The second factor is cost. Well neither solution would be considered cheap, Tableau was the more cost effective solution for our needs.
    Incentivized
    Read full review
    Return on Investment
    ALTERBASICS TECHNOLOGIES PRIVATE LIMITED
    No answers on this topic
    Tableau
    • When we release new products, we are now able to quickly see data and toggle between current periods and previous to see performance
    • Generating new reports requires less IT time to build
    • Data can be shared across many different device types
    • We now have integration where our customers can extract data from our software more easily-this was a big ask from our customers
    Incentivized
    Read full review
    ScreenShots

    Colrows Screenshots

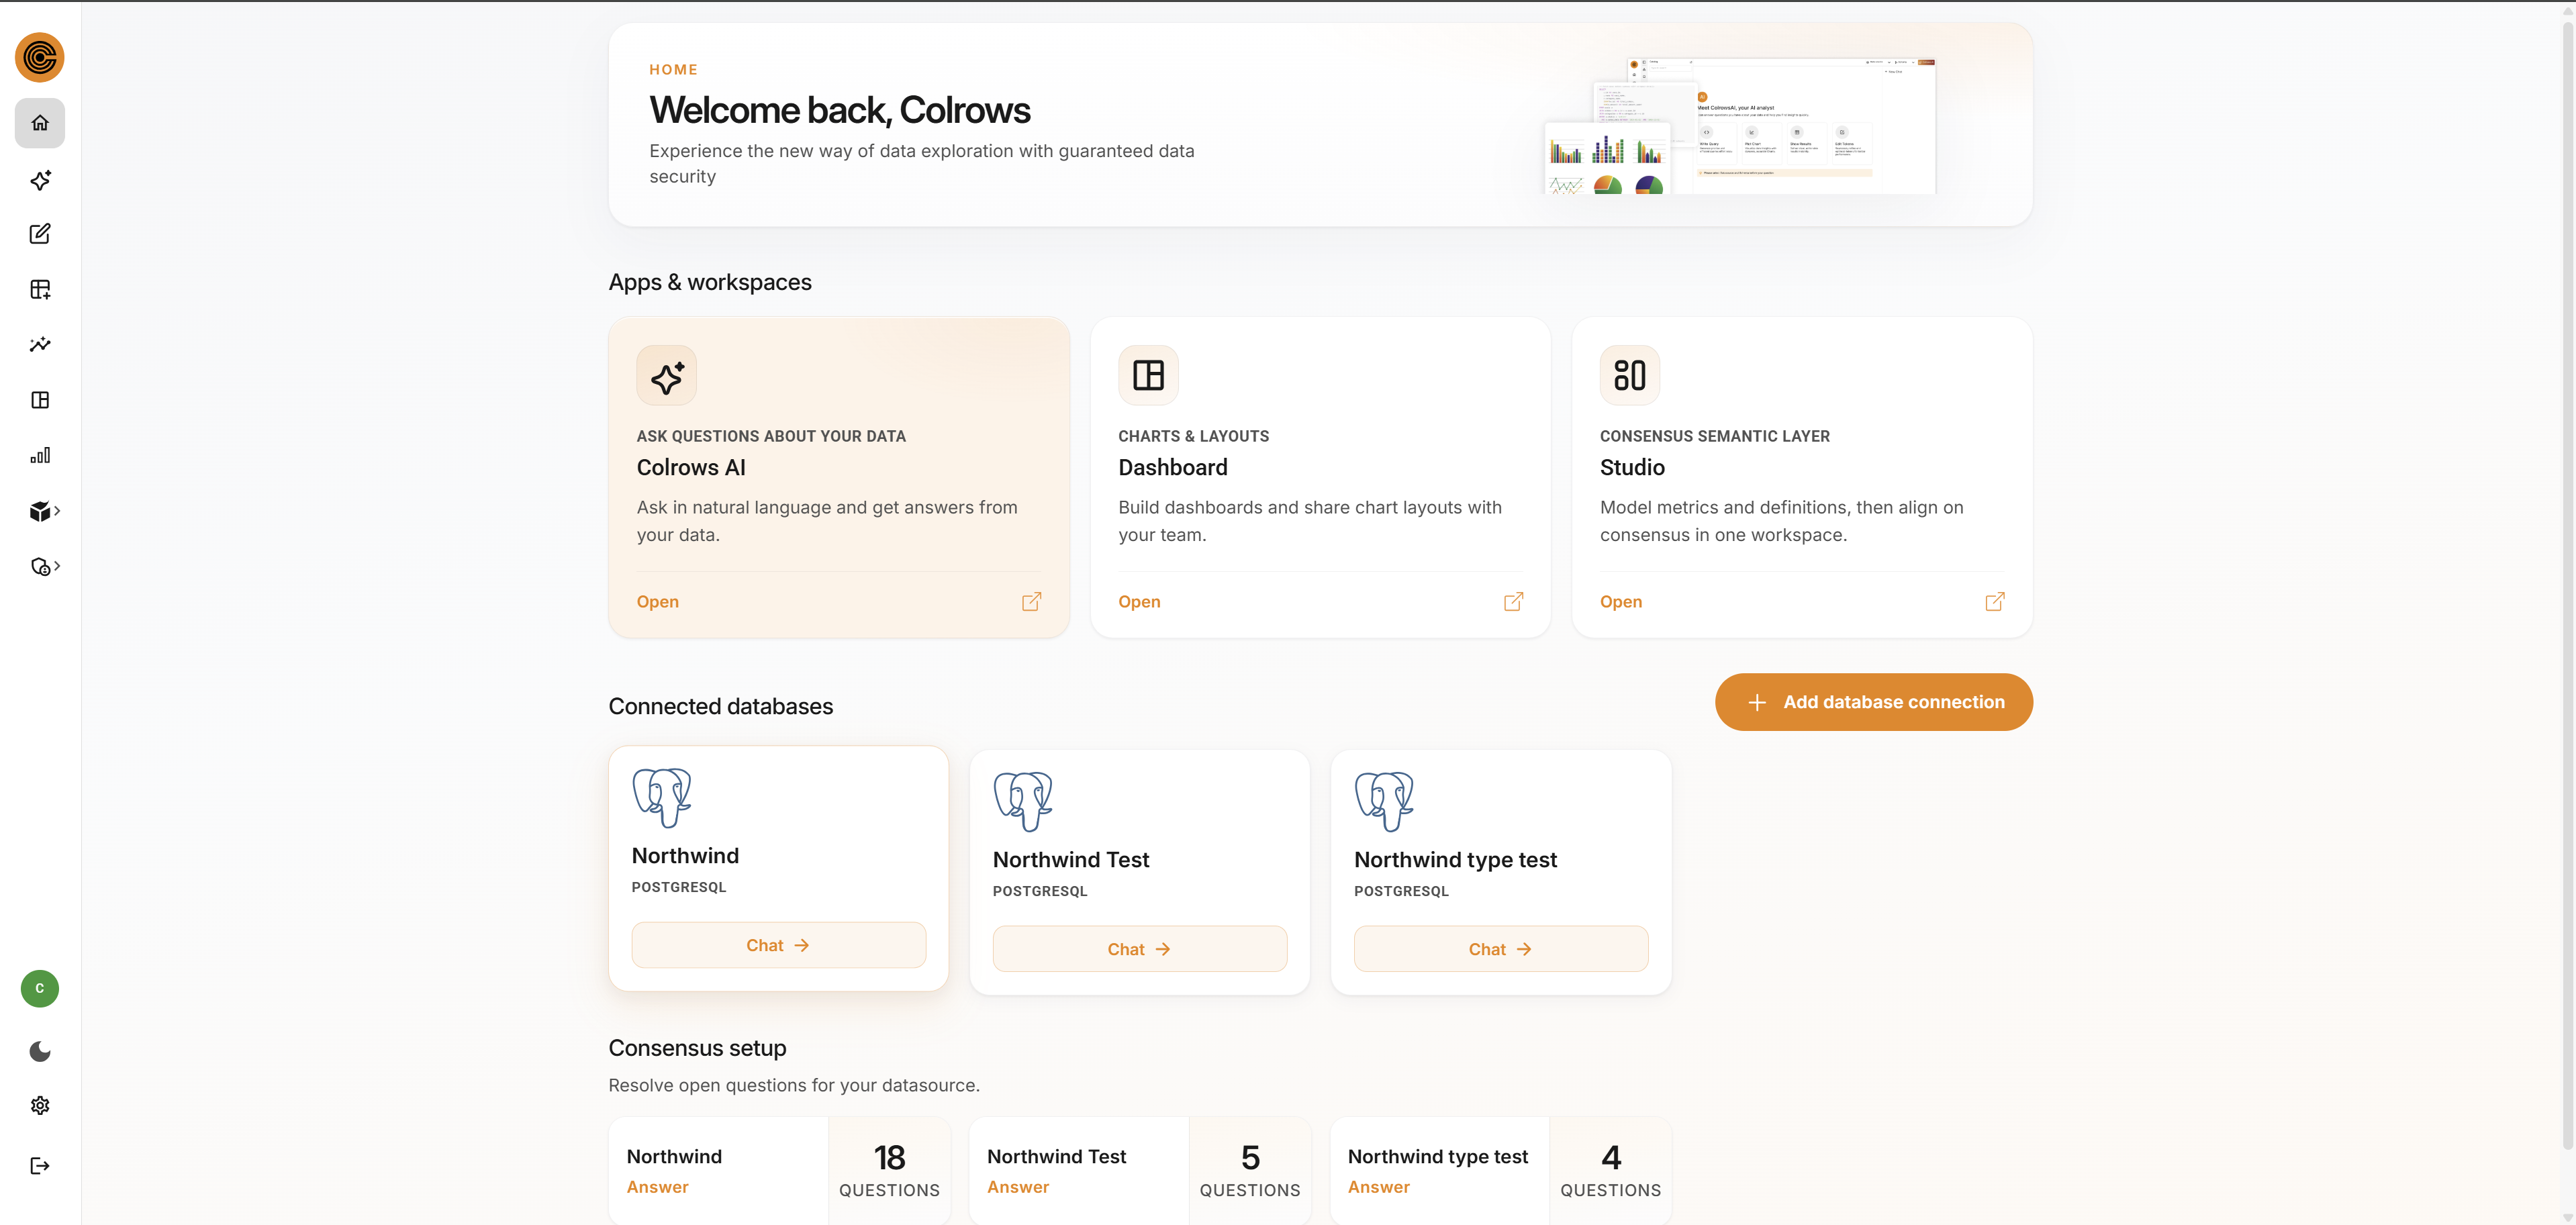
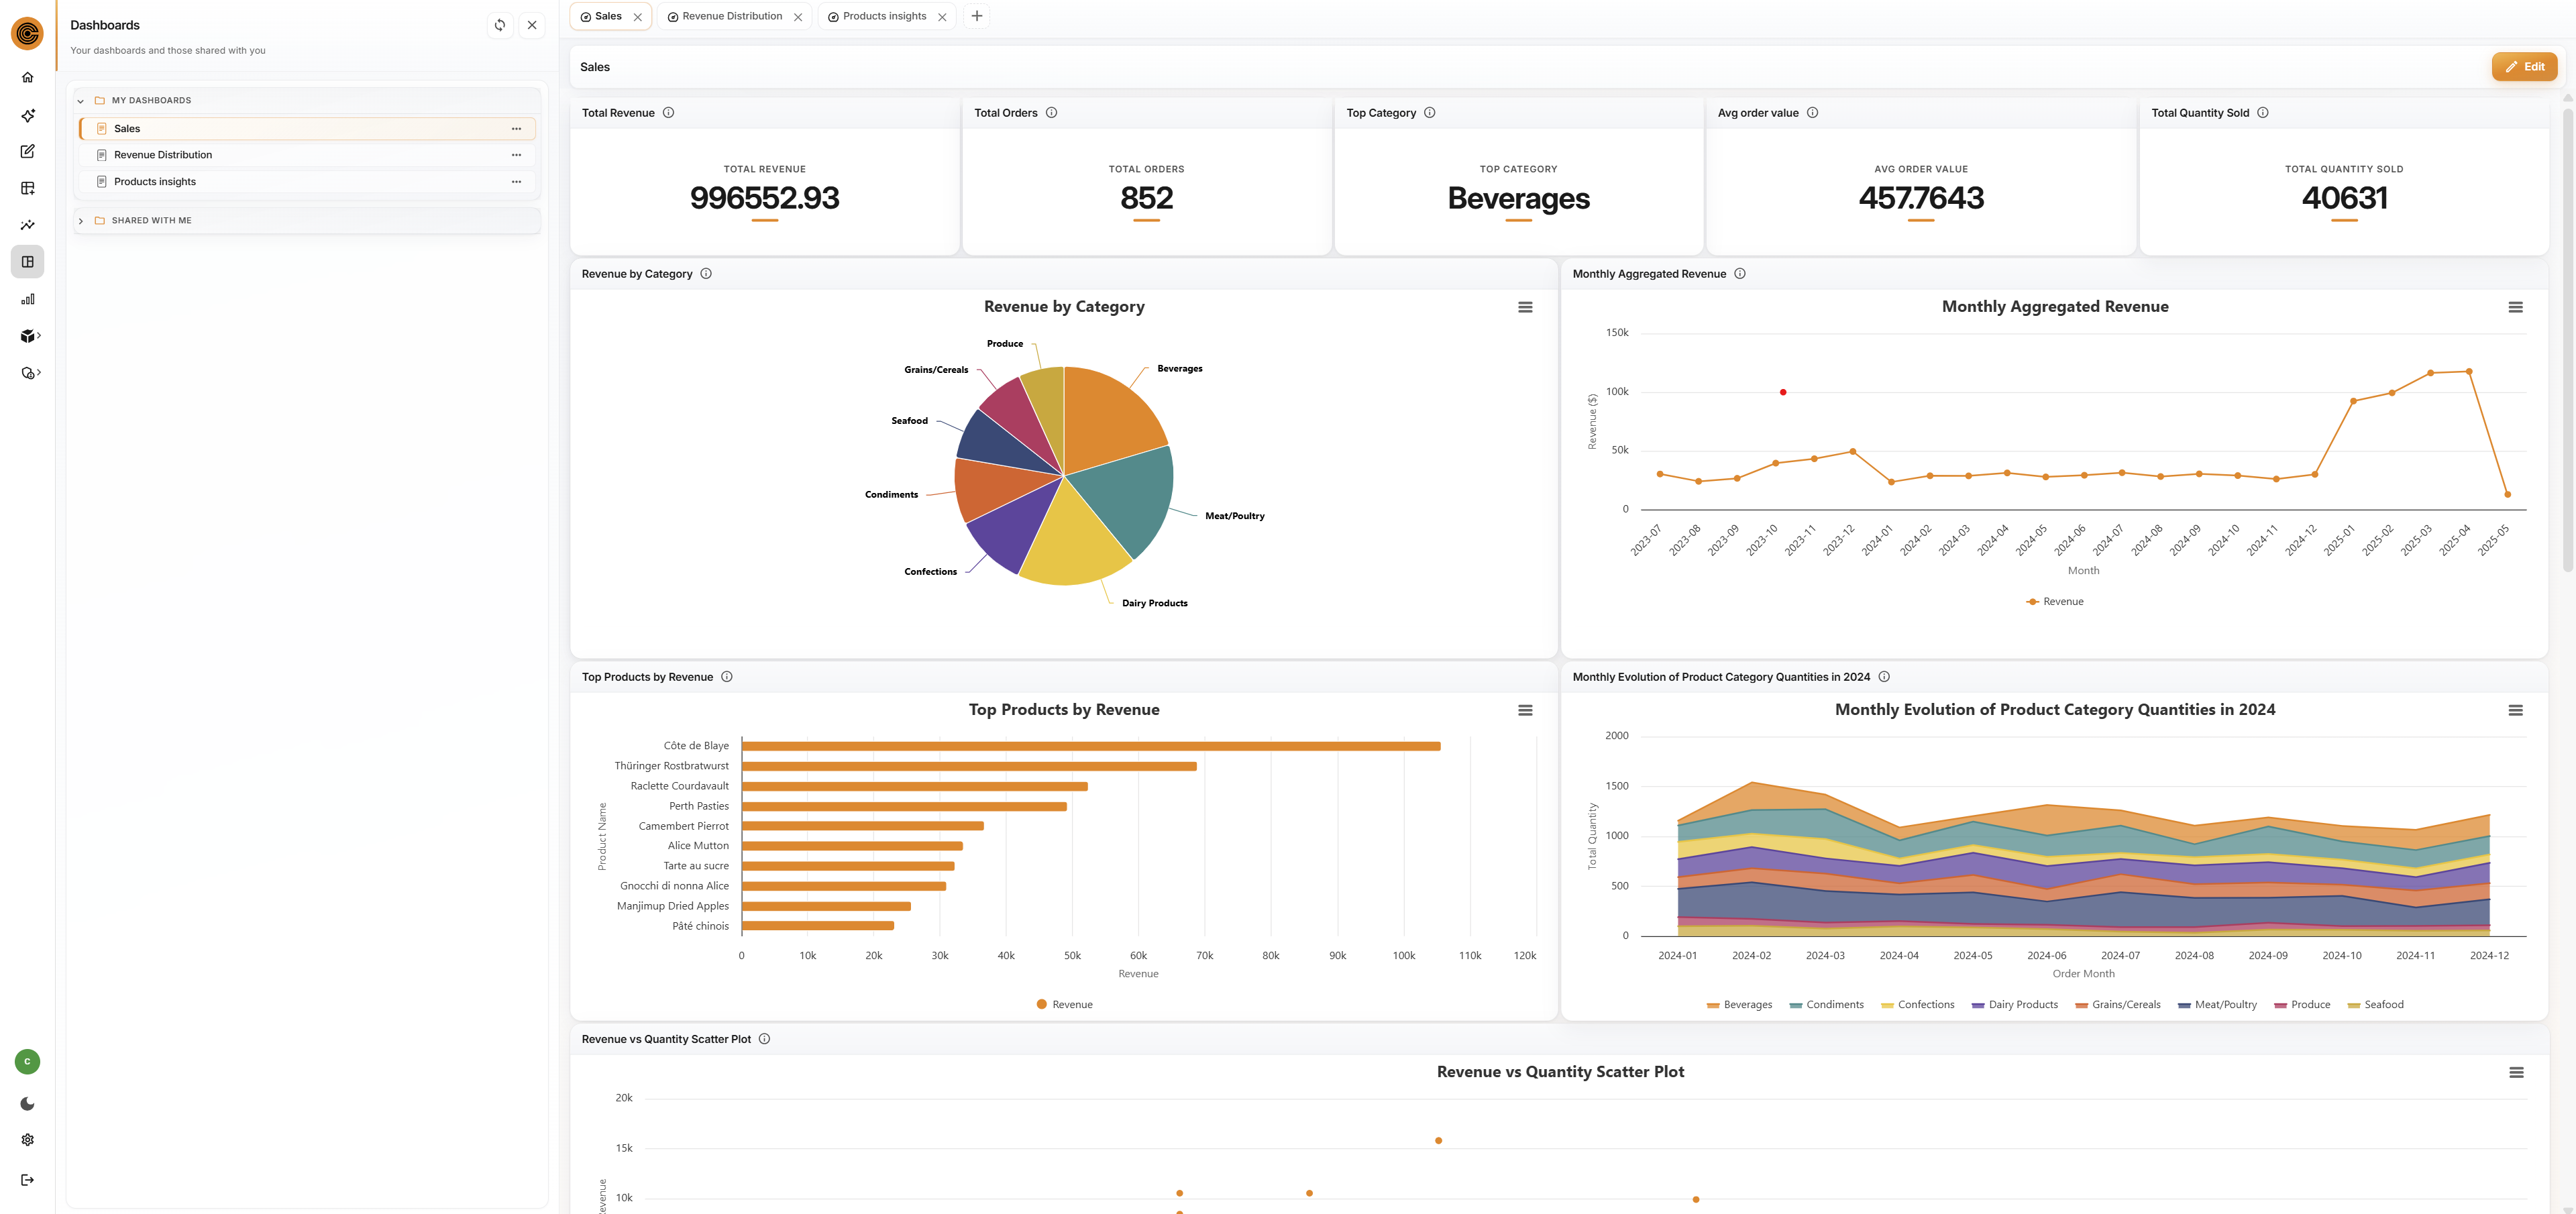
    Screenshot of The Colrows dashboard, which features an AI chat analyst for conversational analytics, letting users query connected databases in plain language, track answered questions per data source, and monitor progress through a governed, secured setup tracking dashboard.Screenshot of The AI Analyst. It turns plain-language request into an auto-generated line chart plotting 2024 monthly net revenue against month-over-month growth, with the underlying SQL, sources, and a 95 percent confidence score shown alongside the visualization.Screenshot of The AI Analyst answering a natural-language question with a governed, sortable data table ranking top customers by lifetime revenue and revenue per active day, backed by a visible SQL query, source attribution, and a 95 percent confidence score.Screenshot of The Colrows Dashboards workspace, which shows saved reports like Sales, with governed KPI cards, revenue-by-category charts, monthly trends, top products, and scatter plots, all built on shared metric definitions instead of separate, conflicting reports.Screenshot of Semantiq Studio. This visualizes the Colrows semantic graph: searchable metrics, an interactive node map showing how Net Revenue derives from Gross Revenue and Discount Amount, plus full metric detail including expression, aggregation, synonyms, and lineage.