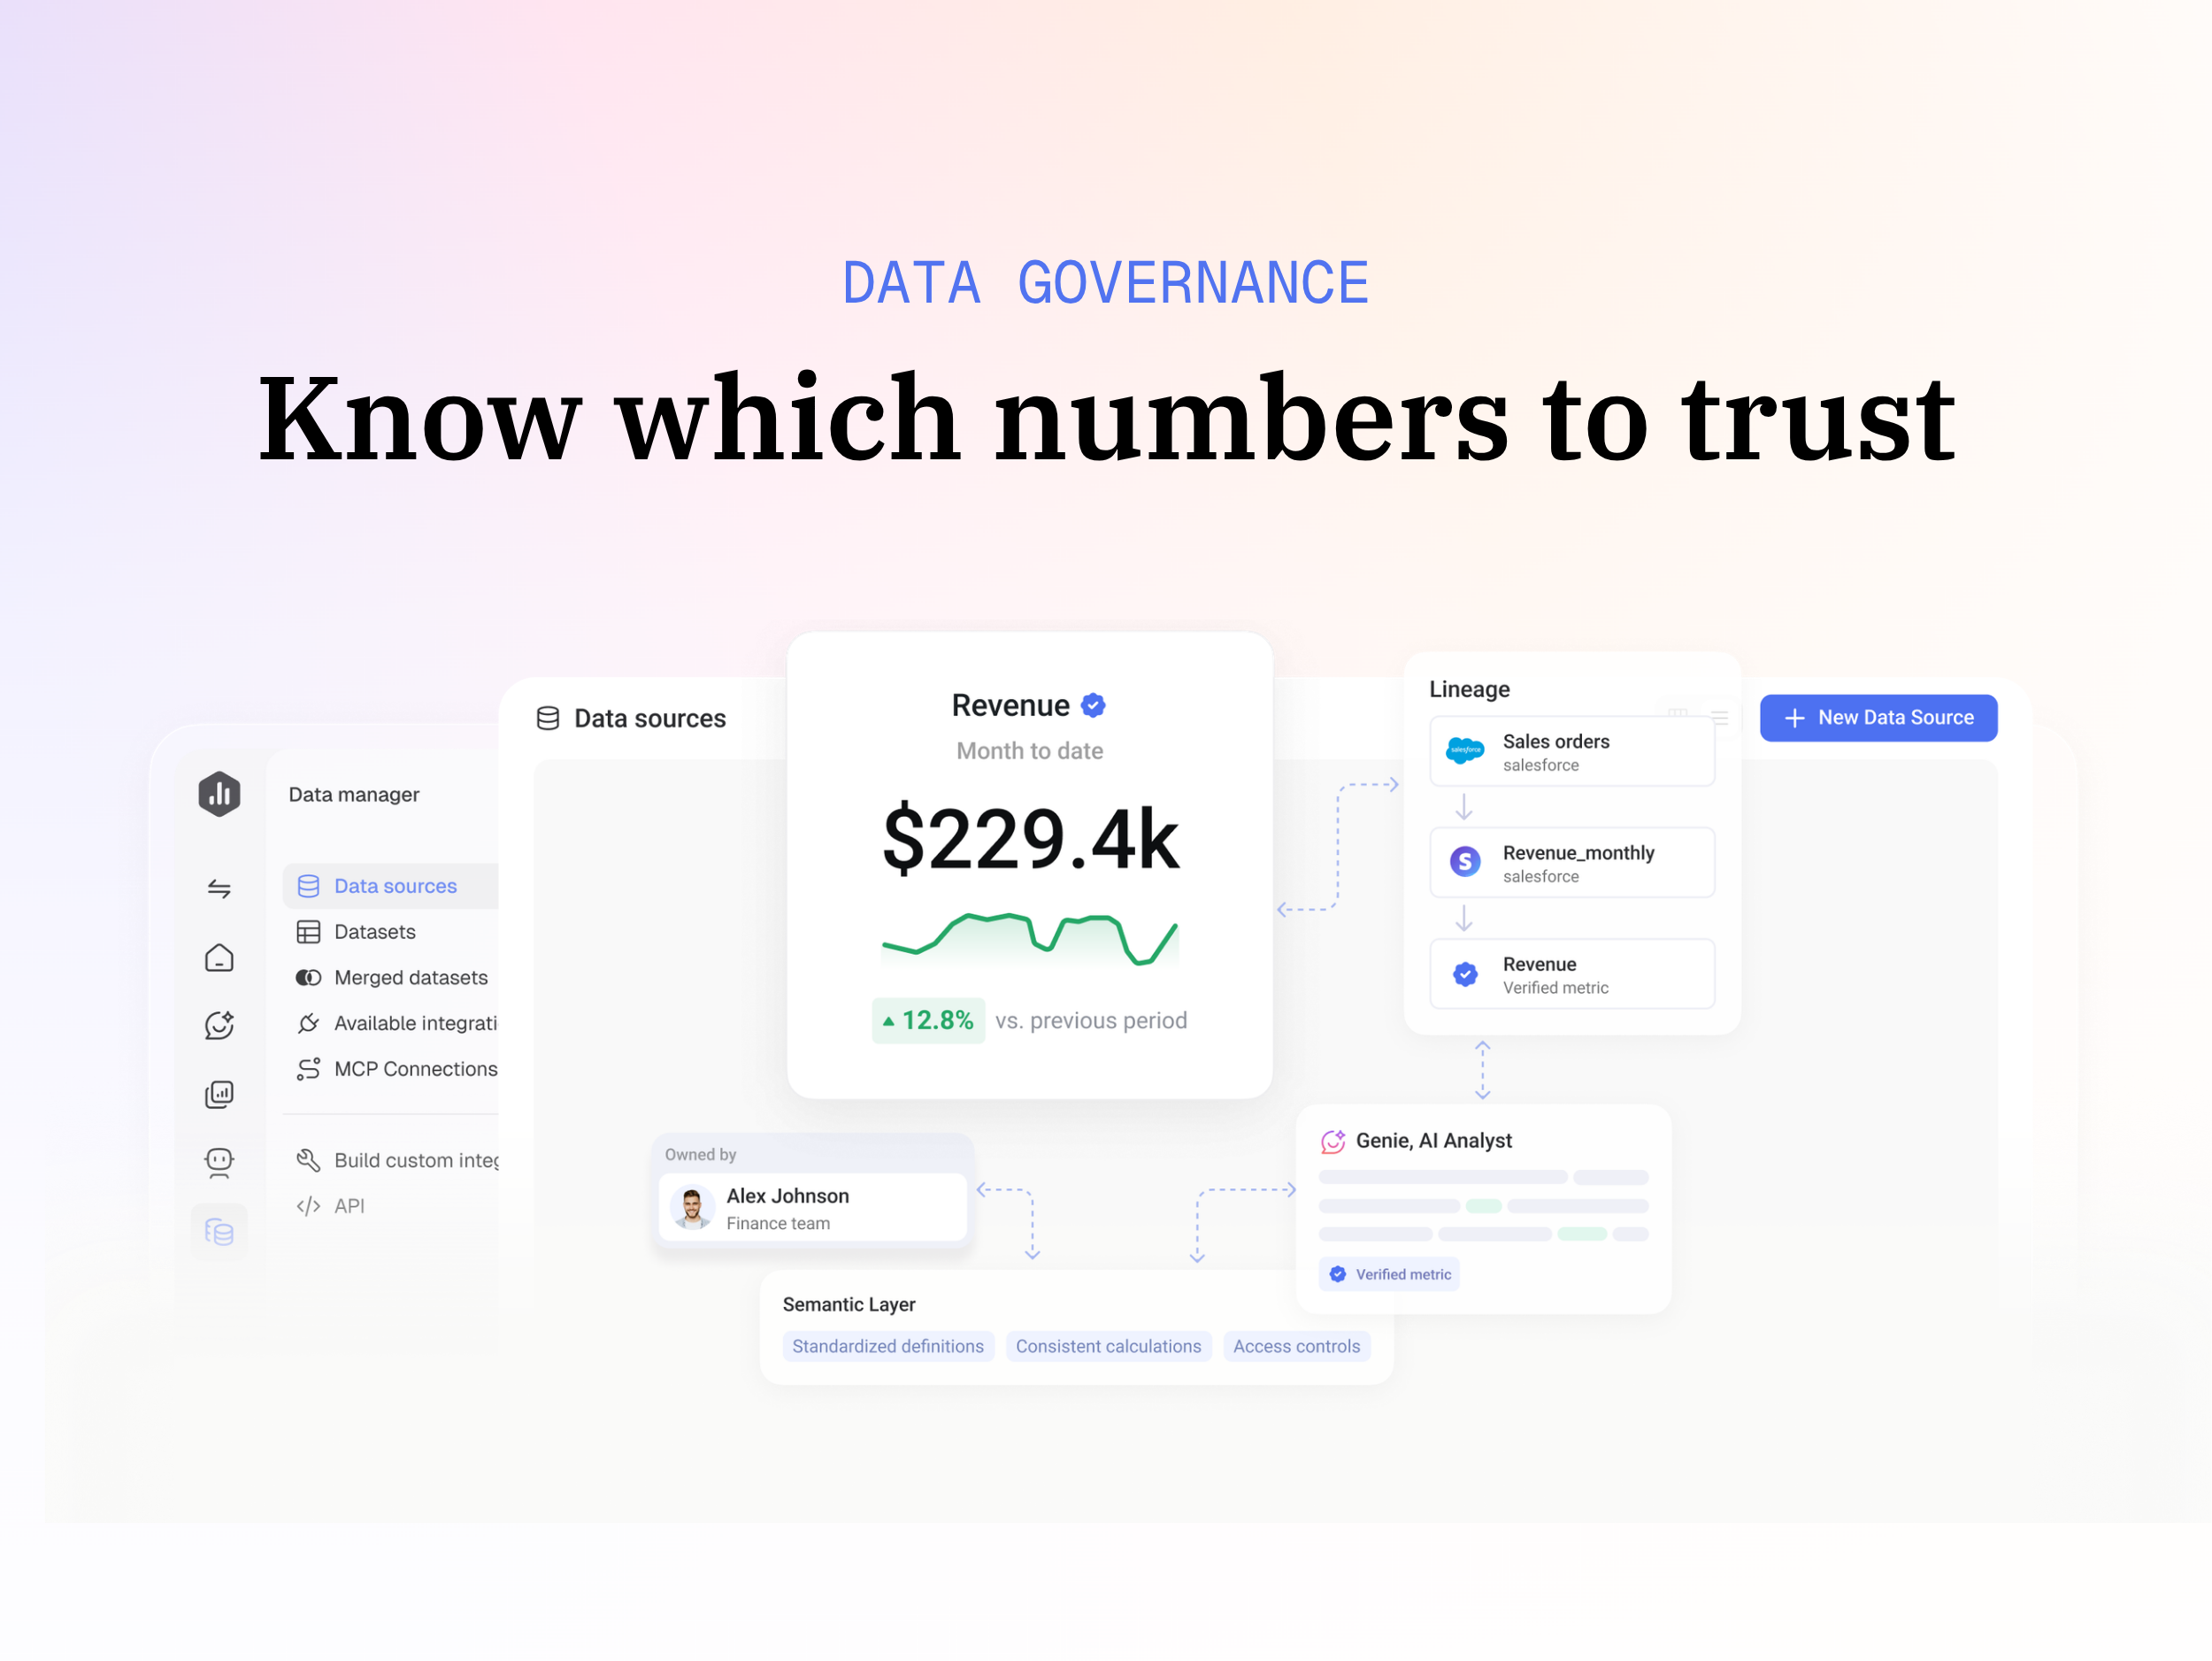
Databox is business intelligence software built for teams that need fast, actionable insights.
$79
per month
OpenText Magellan BI & Reporting
Score7.3 out of 10
N/A
The OpenText Magellan BI & Reporting (formerly OpenText Information Hub (iHub)) component of OpenText™ Magellan™ Analytics Suite is a scalable analytics and data visualization platform that enables IT leaders and their teams to design, deploy, and manage secure, interactive web applications, reports, and dashboards fed by multiple data sources. Magellan BI & Reporting supports high volumes of users, and its integration APIs enable embedded analytic content in any app, displayed on any…
N/A
Pricing
Databox
OpenText Magellan BI & Reporting
Editions & Modules
Free
$0
1 user, 3 data sources & 50 AI credits/mo included
Analyst
$89
per month 1 user, 5 data sources & 150 AI credits/mo included
Team
$249
per month 3 users, 10 data sources & 500 AI credits/mo included
Agency
Starting at $99
per month 4 clients, unlimited users, 20 data sources & 300 AI credits/mo included
Custom
Contact us
More users, More data sources, More AI credits/mo, We optimize it as your needs
No answers on this topic
Offerings
Pricing Offerings
Databox
OpenText Magellan BI & Reporting
Free Trial
Yes
No
Free/Freemium Version
Yes
No
Premium Consulting/Integration Services
Yes
No
Entry-level Setup Fee
No setup fee
No setup fee
Additional Details
20% discount for annual pricing.
—
More Pricing Information
Features
Databox
OpenText Magellan BI & Reporting
BI Standard Reporting
Comparison of BI Standard Reporting features of Databox and OpenText Magellan BI & Reporting
Feature
Databox
9.3
8 Ratings
13% above category average
OpenText Magellan BI & Reporting
5.0
1 Ratings
36% below category average
Pixel Perfect reports
10.05 Ratings
7.01 Ratings
Customizable dashboards
8.98 Ratings
2.01 Ratings
Report Formatting Templates
8.98 Ratings
6.01 Ratings
Ad-hoc Reporting
Comparison of Ad-hoc Reporting features of Databox and OpenText Magellan BI & Reporting
Feature
Databox
8.6
8 Ratings
7% above category average
OpenText Magellan BI & Reporting
7.7
1 Ratings
1% below category average
Drill-down analysis
8.06 Ratings
6.01 Ratings
Formatting capabilities
8.98 Ratings
9.01 Ratings
Integration with R or other statistical packages
7.93 Ratings
00 Ratings
Report sharing and collaboration
9.48 Ratings
8.01 Ratings
Report Output and Scheduling
Comparison of Report Output and Scheduling features of Databox and OpenText Magellan BI & Reporting
Feature
Databox
8.3
8 Ratings
1% above category average
OpenText Magellan BI & Reporting
-
Ratings
Publish to Web
8.96 Ratings
00 Ratings
Publish to PDF
8.97 Ratings
00 Ratings
Report Versioning
7.74 Ratings
00 Ratings
Report Delivery Scheduling
8.98 Ratings
00 Ratings
Delivery to Remote Servers
7.13 Ratings
00 Ratings
Data Discovery and Visualization
Comparison of Data Discovery and Visualization features of Databox and OpenText Magellan BI & Reporting
I believe Databox can be an asset for any company. We are a small company, but I can see the value for large companies too. Databox is a great fit for departments or organizations that need to put their data into a readable form without needing a ton of reports. Databox allows you to save time and put together a nice report without having to do too much extra work. Once it is set up, it basically runs on its own at the frequency you set. I personally receive a daily report and have it sent to the respective people on the day of our meeting so we can quickly review it.
A de minimis incentive was given to thank the reviewer for their time. The incentive was not used to bias or drive a particular response, nor was the incentive contingent on a positive endorsement. More Info
iHub is a decent enough environment that it serves our needs. We can have unlimited users and it can tie into AD although we do not use that feature currently. It is a decent place to store all of the reports in one location, even though for us it is not visually appealing to the end users. iHub is not a place where you want to create robust/interactive dashboards for end users to drill through and follow a "story".
A de minimis incentive was given to thank the reviewer for their time. The incentive was not used to bias or drive a particular response, nor was the incentive contingent on a positive endorsement. More Info
A de minimis incentive was given to thank the reviewer for their time. The incentive was not used to bias or drive a particular response, nor was the incentive contingent on a positive endorsement. More Info
A de minimis incentive was given to thank the reviewer for their time. The incentive was not used to bias or drive a particular response, nor was the incentive contingent on a positive endorsement. More Info
Some types of data can only be reported on for 1-2 months back. Unless I'm misunderstanding the function of the software this seems really weird. I can't figure out how to report on Activities more than 2 months ago
A de minimis incentive was given to thank the reviewer for their time. The incentive was not used to bias or drive a particular response, nor was the incentive contingent on a positive endorsement. More Info
Setting up a "dashboard" is extremely lacking in functionality. The different chart widgets you place on the page do not interact with each other. When you select an item from one do not expect it to highlight or filter another.
The speed and stability are not great, but maybe that is just our environment not being up to snuff...even though we are above the "recommended" settings.
The main GUI for a user is TERRIBLE. You log into a File Tree format where you have to navigate folders to reach the correct dashboard. There are ways around this, but it would either require an expensive payment to the Professional Services team to revamp to UI or another option they gave us was to create the "Default Dashboard" and provide that link to users and in that Dashboard, you use a new tab to include the navigation back to the main screen so that at least on the initial load the user is taken to a friendly looking dashboard instead of a file tree.
A de minimis incentive was given to thank the reviewer for their time. The incentive was not used to bias or drive a particular response, nor was the incentive contingent on a positive endorsement. More Info
Databox is an intuitive, well-designed platform that can be used by non-technical marketers. It is easy to learn, and while set up takes time, usability is high and the team has enjoyed creating custom dashboards and clients have also given us great feedback regarding its usability and value. While other BI tools are much more complex to navigate, Databox is a breeze.
A de minimis incentive was given to thank the reviewer for their time. The incentive was not used to bias or drive a particular response, nor was the incentive contingent on a positive endorsement. More Info
I have really enjoyed using Databox and have seen the value of it in many ways. They also continue to improve the functions of it and grow their integrations and templates. I look forward to continuing to use Databox in the future, potentially even finding ways to incorporate it into other departments to help them with reporting as well.
A de minimis incentive was given to thank the reviewer for their time. The incentive was not used to bias or drive a particular response, nor was the incentive contingent on a positive endorsement. More Info
Databox is unique in its ability to report from multiple data sources. Google Analytics is the standard when it comes to web metrics, but it's just one of the tools that integrates with Databox. Tableau is fantastic for data visualizations and reporting, but it's much more expensive than Databox, so it's not ideal for everyone. Tableau is also superior with customization
A de minimis incentive was given to thank the reviewer for their time. The incentive was not used to bias or drive a particular response, nor was the incentive contingent on a positive endorsement. More Info
Our instance of iHub does not stack up against the other larger BI tools out today. It is a good place to store reports in a central location that allows users to run very specific reports on demand, but it is not a place I would want to store all of my "dashboards". As far as holding individual reports that are specific to an individual need, it is a great tool. If you want to create a report that will be used as a Template for a Form or a Label, iHub is a good choice to store and schedule the report or call it via API to generate it and return it to your calling app.
A de minimis incentive was given to thank the reviewer for their time. The incentive was not used to bias or drive a particular response, nor was the incentive contingent on a positive endorsement. More Info
A de minimis incentive was given to thank the reviewer for their time. The incentive was not used to bias or drive a particular response, nor was the incentive contingent on a positive endorsement. More Info