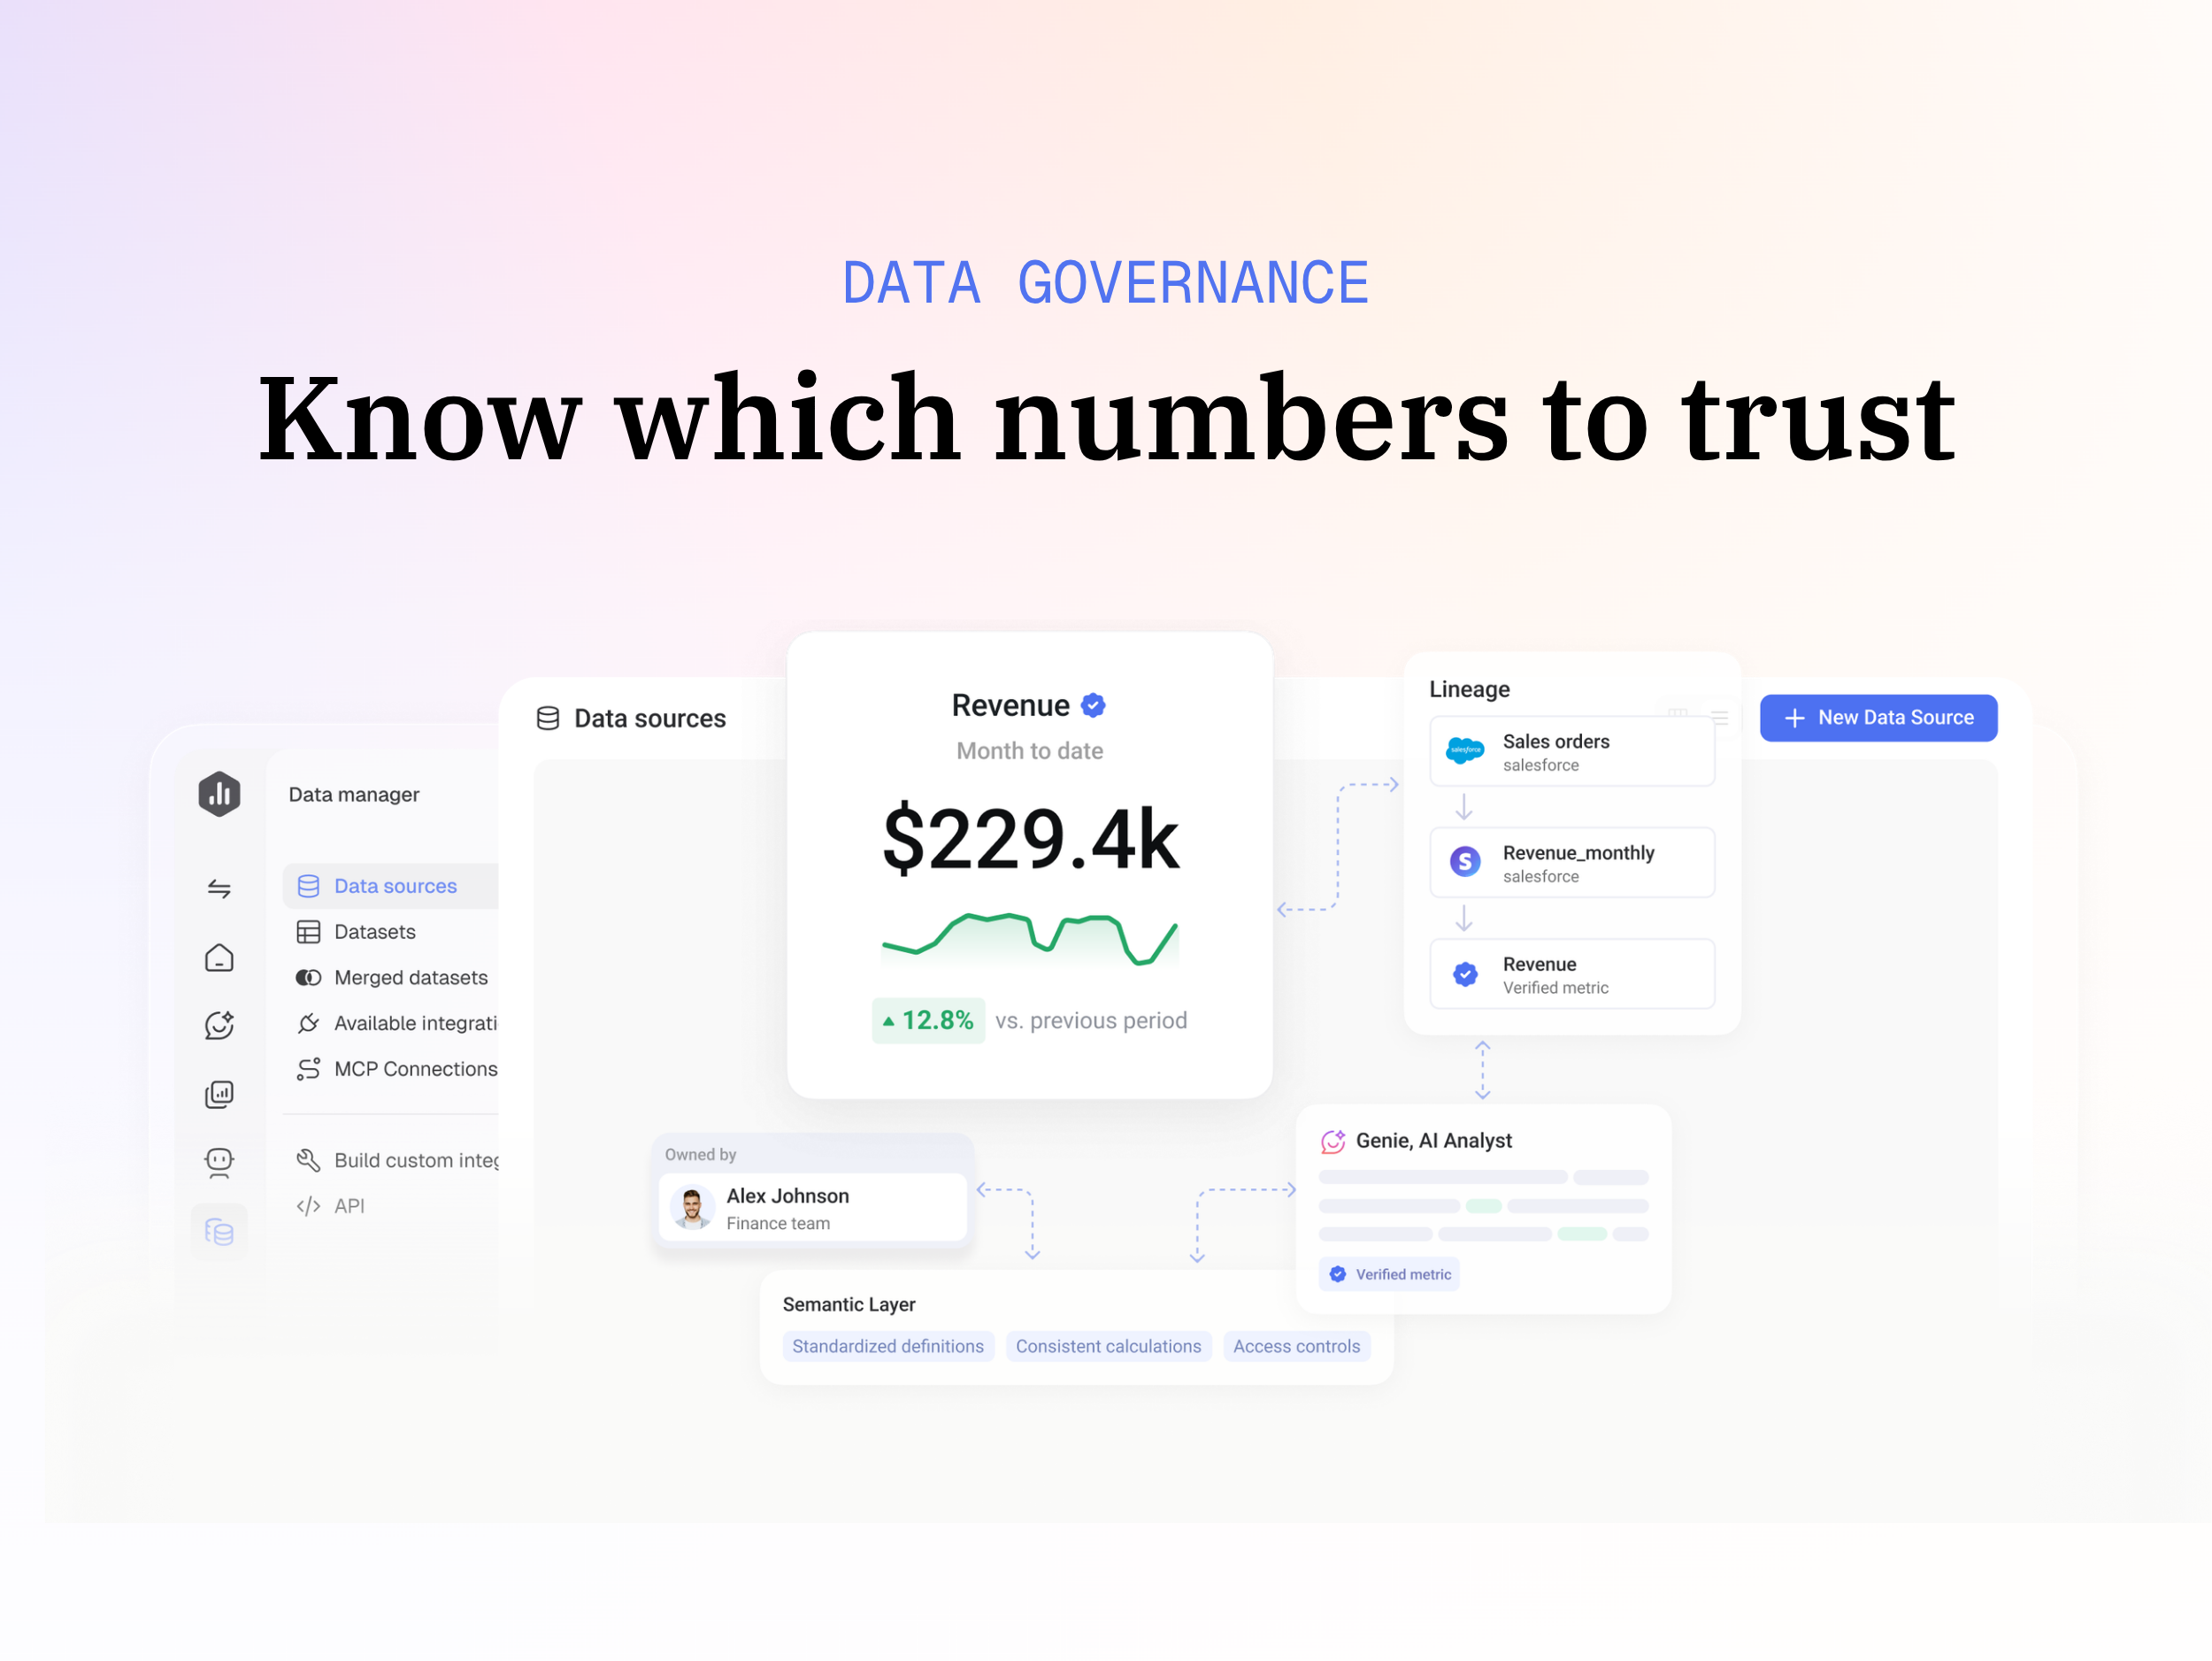
Databox is business intelligence software built for teams that need fast, actionable insights.
$79
per month
Visme
Score6.3 out of 10
N/A
Visme is an online platform with a mission to allow anyone to visualize their ideas into engaging presentations, infographics, animations, and product demonstrations.
$29
per month
Pricing
Databox
Visme
Editions & Modules
Free
$0
1 user, 3 data sources & 50 AI credits/mo included
Analyst
$89
per month 1 user, 5 data sources & 150 AI credits/mo included
Team
$249
per month 3 users, 10 data sources & 500 AI credits/mo included
Agency
Starting at $99
per month 4 clients, unlimited users, 20 data sources & 300 AI credits/mo included
Custom
Contact us
More users, More data sources, More AI credits/mo, We optimize it as your needs
I believe Databox can be an asset for any company. We are a small company, but I can see the value for large companies too. Databox is a great fit for departments or organizations that need to put their data into a readable form without needing a ton of reports. Databox allows you to save time and put together a nice report without having to do too much extra work. Once it is set up, it basically runs on its own at the frequency you set. I personally receive a daily report and have it sent to the respective people on the day of our meeting so we can quickly review it.
A de minimis incentive was given to thank the reviewer for their time. The incentive was not used to bias or drive a particular response, nor was the incentive contingent on a positive endorsement. More Info
As a tourism business, it is fundamental for us to produce more engaging and vibrant promotional materials for the clients as they can easily perceive the actual offering of the project/ product. Visme exactly does the same as expected by the organization. It saves time and bring more efficiency in the process or operations. It doesn't require any technical expertise for making the designs. It just requires a command with information and background designs.
A de minimis incentive was given to thank the reviewer for their time. The incentive was not used to bias or drive a particular response, nor was the incentive contingent on a positive endorsement. More Info
A de minimis incentive was given to thank the reviewer for their time. The incentive was not used to bias or drive a particular response, nor was the incentive contingent on a positive endorsement. More Info
A de minimis incentive was given to thank the reviewer for their time. The incentive was not used to bias or drive a particular response, nor was the incentive contingent on a positive endorsement. More Info
Some types of data can only be reported on for 1-2 months back. Unless I'm misunderstanding the function of the software this seems really weird. I can't figure out how to report on Activities more than 2 months ago
A de minimis incentive was given to thank the reviewer for their time. The incentive was not used to bias or drive a particular response, nor was the incentive contingent on a positive endorsement. More Info
A de minimis incentive was given to thank the reviewer for their time. The incentive was not used to bias or drive a particular response, nor was the incentive contingent on a positive endorsement. More Info
Databox is an intuitive, well-designed platform that can be used by non-technical marketers. It is easy to learn, and while set up takes time, usability is high and the team has enjoyed creating custom dashboards and clients have also given us great feedback regarding its usability and value. While other BI tools are much more complex to navigate, Databox is a breeze.
A de minimis incentive was given to thank the reviewer for their time. The incentive was not used to bias or drive a particular response, nor was the incentive contingent on a positive endorsement. More Info
I have really enjoyed using Databox and have seen the value of it in many ways. They also continue to improve the functions of it and grow their integrations and templates. I look forward to continuing to use Databox in the future, potentially even finding ways to incorporate it into other departments to help them with reporting as well.
A de minimis incentive was given to thank the reviewer for their time. The incentive was not used to bias or drive a particular response, nor was the incentive contingent on a positive endorsement. More Info
Databox is unique in its ability to report from multiple data sources. Google Analytics is the standard when it comes to web metrics, but it's just one of the tools that integrates with Databox. Tableau is fantastic for data visualizations and reporting, but it's much more expensive than Databox, so it's not ideal for everyone. Tableau is also superior with customization
A de minimis incentive was given to thank the reviewer for their time. The incentive was not used to bias or drive a particular response, nor was the incentive contingent on a positive endorsement. More Info
PowerPoint has fewer templates when compared to Visme, PowerPoint has limited editor options, and both offer transitions and animations. Visme has the ability to share files and folders privately, while PowerPoint can only share files privately. Visme helps format the statistics and performance analytics for your company and helps in lead generation. Visme helps in graphics, presentations, charts, and infographics, while PowerPoint is only used for presentations.
A de minimis incentive was given to thank the reviewer for their time. The incentive was not used to bias or drive a particular response, nor was the incentive contingent on a positive endorsement. More Info
A de minimis incentive was given to thank the reviewer for their time. The incentive was not used to bias or drive a particular response, nor was the incentive contingent on a positive endorsement. More Info
A de minimis incentive was given to thank the reviewer for their time. The incentive was not used to bias or drive a particular response, nor was the incentive contingent on a positive endorsement. More Info