TrustRadius: an HG Insights company

Save this comparison

Save this comparison

Add Product

Recommended Comparisons

    Overview
    ProductRatingMost Used ByProduct SummaryStarting Price

    Databox

    Score10 out of 10
    N/ADatabox is business intelligence software built for teams that need fast, actionable insights.

    $79

    per month

    Watershed LRS

    Score9 out of 10
    N/AWatershed LRS is a learning management software solution built to help employers identify skills and competencies.

    $0

    Pricing
    DataboxWatershed LRS
    Editions & Modules
    Free
    $0
    1 user, 3 data sources & 50 AI credits/mo included
    Analyst
    $89
    per month 1 user, 5 data sources & 150 AI credits/mo included
    Team
    $249
    per month 3 users, 10 data sources & 500 AI credits/mo included
    Agency
    Starting at $99
    per month 4 clients, unlimited users, 20 data sources & 300 AI credits/mo included
    Custom
    Contact us
    More users, More data sources, More AI credits/mo, We optimize it as your needs
    Essentials
    $0
    Watershed
    Custom Pricing
    Watershed Enterprise
    Custom Pricing
    Offerings
    Pricing Offerings
    DataboxWatershed LRS
    Free Trial
    YesNo
    Free/Freemium Version
    YesYes
    Premium Consulting/Integration Services
    YesYes
    Entry-level Setup FeeNo setup feeOptional
    Additional Details20% discount for annual pricing.—
    More Pricing Information
    Features
    DataboxWatershed LRS
    BI Standard Reporting
    Comparison of BI Standard Reporting features of Databox and Watershed LRS
    Feature
    Databox
    9.3
    8 Ratings
    13% above category average
    Watershed LRS
    9.3
    1 Ratings
    13% above category average
    Pixel Perfect reports10.05 Ratings10.01 Ratings
    Customizable dashboards8.98 Ratings8.01 Ratings
    Report Formatting Templates8.98 Ratings10.01 Ratings
    Ad-hoc Reporting
    Comparison of Ad-hoc Reporting features of Databox and Watershed LRS
    Feature
    Databox
    8.6
    8 Ratings
    7% above category average
    Watershed LRS
    9.3
    1 Ratings
    15% above category average
    Drill-down analysis8.06 Ratings10.01 Ratings
    Formatting capabilities8.98 Ratings10.01 Ratings
    Integration with R or other statistical packages7.93 Ratings8.01 Ratings
    Report sharing and collaboration9.48 Ratings9.01 Ratings
    Report Output and Scheduling
    Comparison of Report Output and Scheduling features of Databox and Watershed LRS
    Feature
    Databox
    8.3
    8 Ratings
    1% above category average
    Watershed LRS
    8.8
    1 Ratings
    7% above category average
    Publish to Web8.96 Ratings9.01 Ratings
    Publish to PDF8.97 Ratings9.01 Ratings
    Report Versioning7.74 Ratings8.01 Ratings
    Report Delivery Scheduling8.98 Ratings9.01 Ratings
    Delivery to Remote Servers7.13 Ratings9.01 Ratings
    Data Discovery and Visualization
    Comparison of Data Discovery and Visualization features of Databox and Watershed LRS
    Feature
    Databox
    7.7
    7 Ratings
    4% below category average
    Watershed LRS
    9.3
    1 Ratings
    15% above category average
    Pre-built visualization formats (heatmaps, scatter plots etc.)8.36 Ratings10.01 Ratings
    Location Analytics / Geographic Visualization7.04 Ratings8.01 Ratings
    Predictive Analytics7.95 Ratings10.01 Ratings
    Access Control and Security
    Comparison of Access Control and Security features of Databox and Watershed LRS
    Feature
    Databox
    -
    Ratings
    Watershed LRS
    8.3
    1 Ratings
    2% below category average
    Multi-User Support (named login)00 Ratings9.01 Ratings
    Role-Based Security Model00 Ratings8.01 Ratings
    Multiple Access Permission Levels (Create, Read, Delete)00 Ratings6.01 Ratings
    Single Sign-On (SSO)00 Ratings10.01 Ratings
    Mobile Capabilities
    Comparison of Mobile Capabilities features of Databox and Watershed LRS
    Feature
    Databox
    -
    Ratings
    Watershed LRS
    9.0
    1 Ratings
    15% above category average
    Responsive Design for Web Access00 Ratings10.01 Ratings
    Mobile Application00 Ratings8.01 Ratings
    Dashboard / Report / Visualization Interactivity on Mobile00 Ratings9.01 Ratings
    Application Program Interfaces (APIs) / Embedding
    Comparison of Application Program Interfaces (APIs) / Embedding features of Databox and Watershed LRS
    Feature
    Databox
    -
    Ratings
    Watershed LRS
    9.0
    1 Ratings
    15% above category average
    REST API00 Ratings8.01 Ratings
    Javascript API00 Ratings10.01 Ratings
    iFrames00 Ratings10.01 Ratings
    Java API00 Ratings10.01 Ratings
    Themeable User Interface (UI)00 Ratings8.01 Ratings
    Customizable Platform (Open Source)00 Ratings8.01 Ratings
    Best Alternatives
    DataboxWatershed LRS
    Small Businesses
    Cyfe
    Score4 out of 10
    Cyfe
    Score4 out of 10
    Medium-sized Companies
    Qlik Cloud Analytics (Qlik Sense)
    Score8.1 out of 10
    Qlik Cloud Analytics (Qlik Sense)
    Score8.1 out of 10
    Enterprises
    Sisense
    Score6.9 out of 10
    Sisense
    Score6.9 out of 10
    All AlternativesView all alternativesView all alternatives
    User Ratings
    DataboxWatershed LRS
    Likelihood to Recommend
    8.0
    (8 ratings)
    9.0
    (1 ratings)
    Usability
    9.0
    (1 ratings)
    9.0
    (1 ratings)
    Support Rating
    9.8
    (3 ratings)
    10.0
    (1 ratings)
    User Testimonials
    DataboxWatershed LRS
    Likelihood to Recommend
    Databox
    I believe Databox can be an asset for any company. We are a small company, but I can see the value for large companies too. Databox is a great fit for departments or organizations that need to put their data into a readable form without needing a ton of reports. Databox allows you to save time and put together a nice report without having to do too much extra work. Once it is set up, it basically runs on its own at the frequency you set. I personally receive a daily report and have it sent to the respective people on the day of our meeting so we can quickly review it.
    Incentivized
    Read full review
    Watershed Systems, Inc
    Watershed is a great platform that helps you to understand the overall impact of learning programs on your business and where the improvements are needed.
    Incentivized
    Read full review
    Pros
    Databox
    • Create dashboards from a variety of data sources.
    • Set & track goals based on the data and metrics provided.
    • Send alerts and scorecard updates to Slack and email automatically.
    Incentivized
    Read full review
    Watershed Systems, Inc
    • Amazing Data Quality Control.
    • Master Data Management is very helpful.
    Incentivized
    Read full review
    Cons
    Databox
    • Some types of data can only be reported on for 1-2 months back. Unless I'm misunderstanding the function of the software this seems really weird. I can't figure out how to report on Activities more than 2 months ago
    Incentivized
    Read full review
    Watershed Systems, Inc
    • Scheduling performance can be improved.
    • Price is little bit high.
    Incentivized
    Read full review
    Usability
    Databox
    Databox is an intuitive, well-designed platform that can be used by non-technical marketers. It is easy to learn, and while set up takes time, usability is high and the team has enjoyed creating custom dashboards and clients have also given us great feedback regarding its usability and value. While other BI tools are much more complex to navigate, Databox is a breeze.
    Incentivized
    Read full review
    Watershed Systems, Inc
    It has all the features that we were trying to get from any other software for our business problems.
    Incentivized
    Read full review
    Support Rating
    Databox
    I have really enjoyed using Databox and have seen the value of it in many ways. They also continue to improve the functions of it and grow their integrations and templates. I look forward to continuing to use Databox in the future, potentially even finding ways to incorporate it into other departments to help them with reporting as well.
    Incentivized
    Read full review
    Watershed Systems, Inc
    Every time we got the proper support from Watershed.
    Incentivized
    Read full review
    Alternatives Considered
    Databox
    Databox is unique in its ability to report from multiple data sources. Google Analytics is the standard when it comes to web metrics, but it's just one of the tools that integrates with Databox. Tableau is fantastic for data visualizations and reporting, but it's much more expensive than Databox, so it's not ideal for everyone. Tableau is also superior with customization
    Incentivized
    Read full review
    Watershed Systems, Inc
    No answers on this topic
    Return on Investment
    Databox
    • It has helped us to show our value to clients
    • Easily digestible dashboards make it easy to understand what you're looking at
    Incentivized
    Read full review
    Watershed Systems, Inc
    • Nice Reporting & Statistics.
    • KPI Monitoring and Visual analytics.
    Incentivized
    Read full review
    ScreenShots

    Databox Screenshots

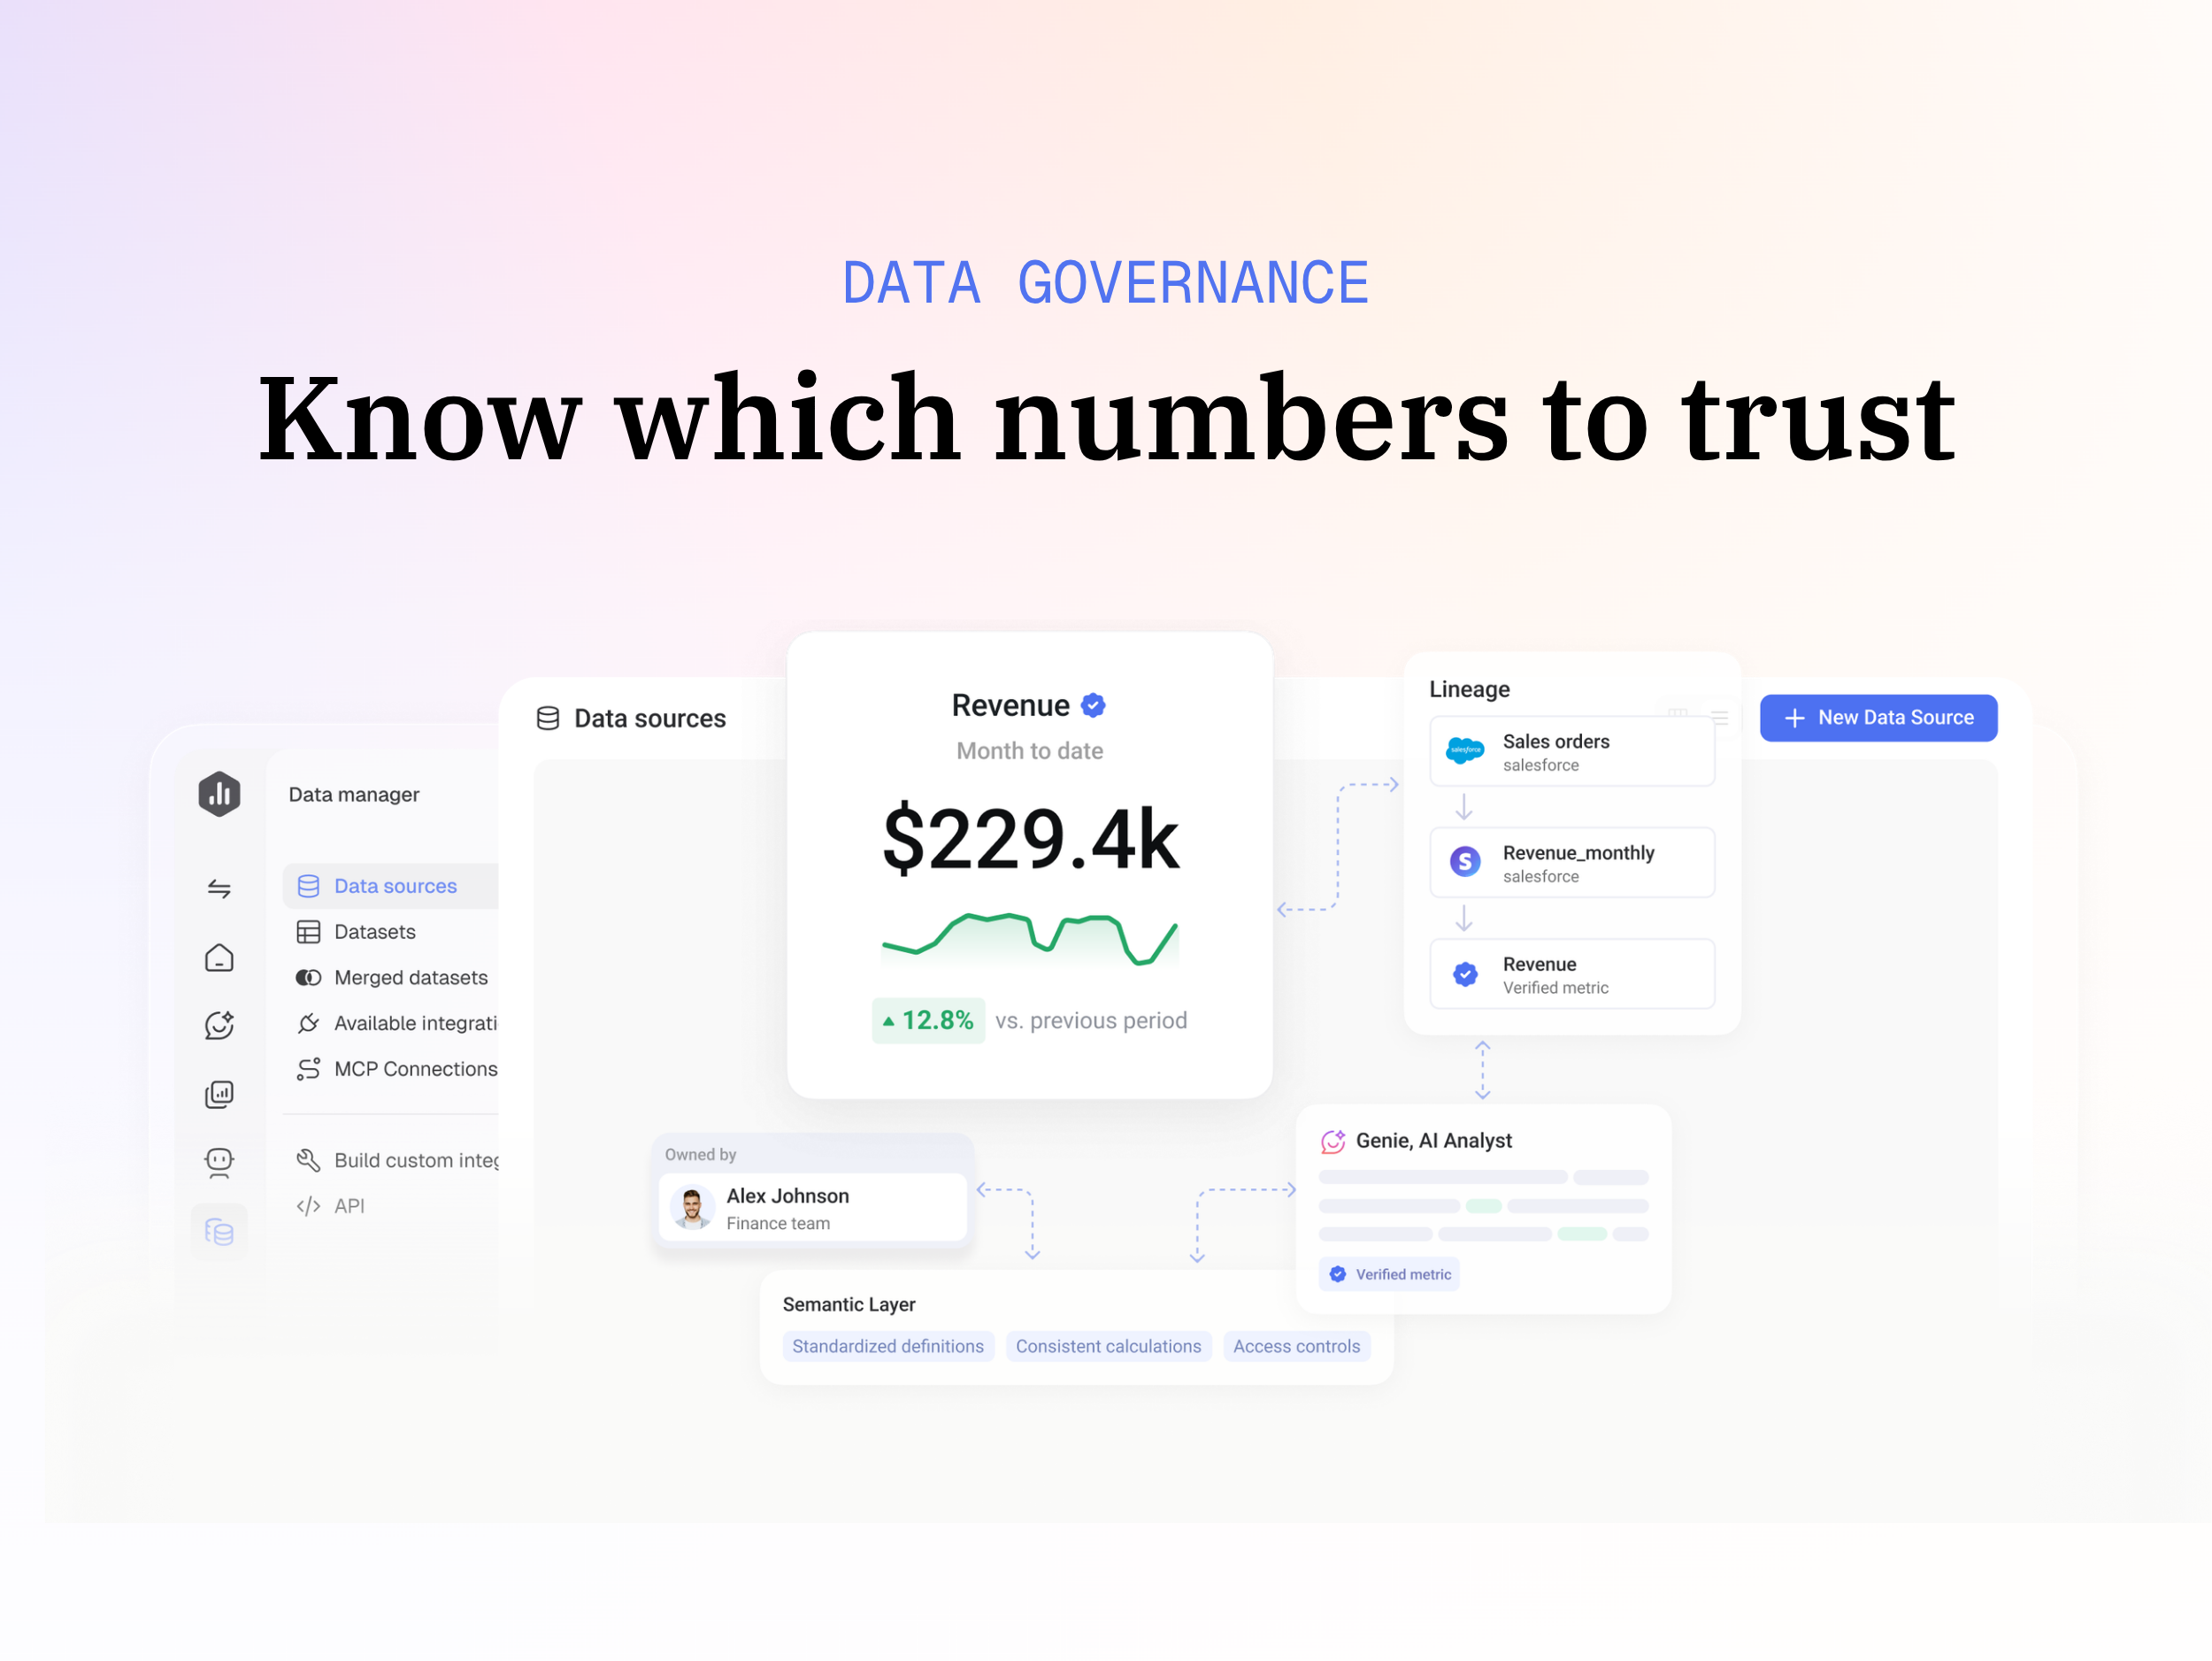
    Screenshot of Better-informed actions by you, your team, or agents.Screenshot of Combine your performance data with AI-powered analysis and workflows, so you can analyze, report, and take better-informed action faster.Screenshot of Use MCP connectors to bring trusted Databox data into your AI tools and get answers grounded in your business performance.Screenshot of Create clear dashboards and reports that keep everyone aligned on performance and the metrics that matter.Screenshot of Bring all your data together in one place, with consistent metrics you can confidently use to make decisions.Screenshot of Connect your favorite tools and bring all your data into one place for a complete view of your performance.

    Watershed LRS Screenshots

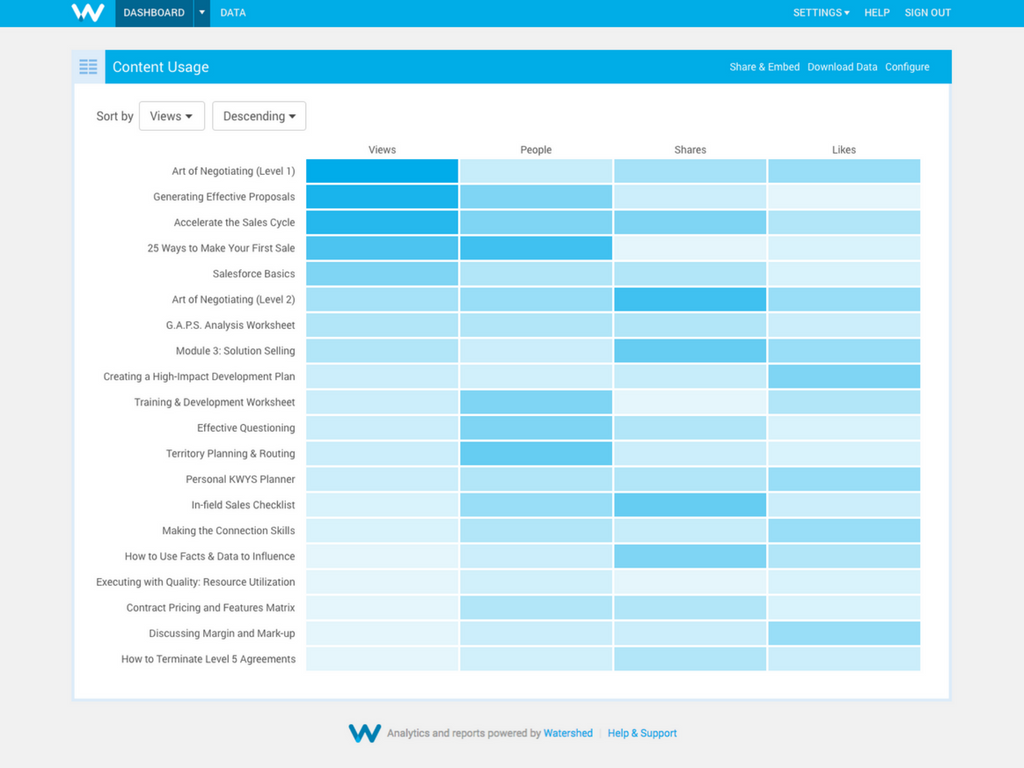
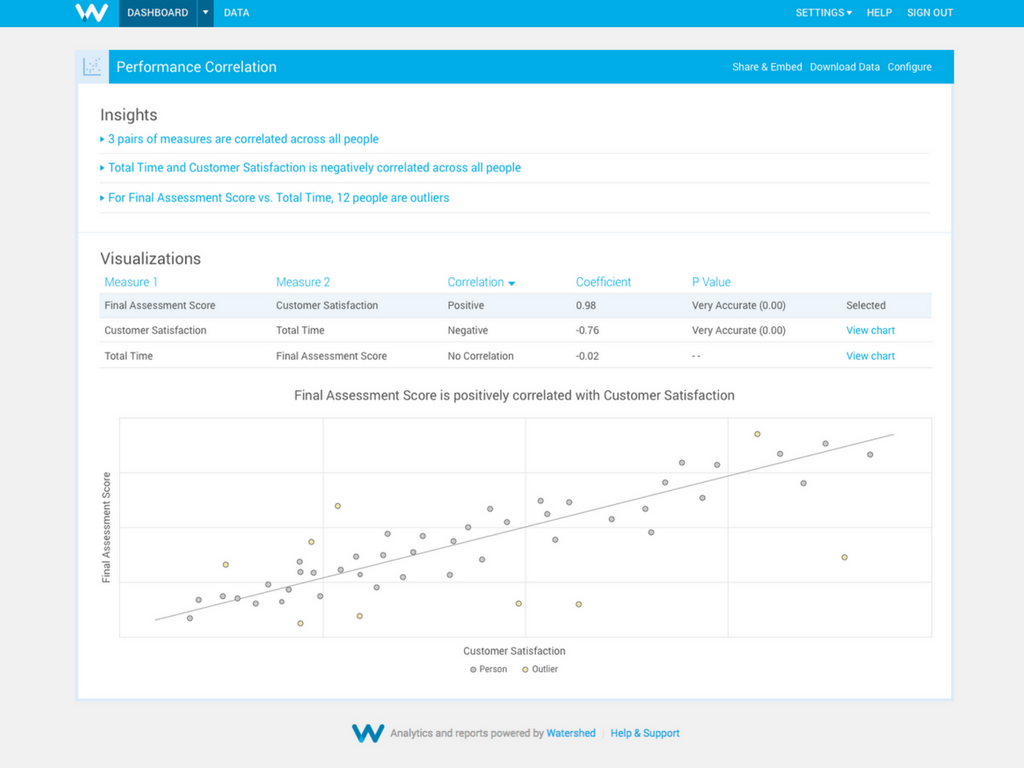
    Screenshot of Identify & Eliminate Scrap Learning: Stop wasting time and money on learning that isn’t used or applied on the job.Screenshot of Demonstrate Improvements: Show knowledge acquisition and performance improvements to ensure training effectiveness.Screenshot of Compare Groups & Cohorts: Break out results across your organizational hierarchy to identify patterns in learning performance.Screenshot of Correlate Training with Performance Outcomes: Find out if increased and/or improved training is indeed correlated with higher performance.Screenshot of Find Common Search Terms & Popular Topics: Find the topics people want to learn about to ensure you’re providing the most relevant and comprehensive resources.