Datadog vs. NetVizura NetFlow Analyzer
Datadog vs. NetVizura NetFlow Analyzer
| Product | Rating | Most Used By | Product Summary | Starting Price |
|---|---|---|---|---|
 Datadog | N/A | Datadog is a monitoring service for IT, Dev and Ops teams who write and run applications at scale, and want to turn the massive amounts of data produced by their apps, tools and services into actionable insight. | $18 per month per host | |
 NetVizura NetFlow Analyzer | Mid-Size Companies (51-1,000 employees) | NetVizura NetFlow Analyzer, from Soneco, is designed to help network admins with network traffic monitoring, analysis and reporting. The vendor says their solution enables users to do the following: Monitor network bandwidth on routers and interfaces Monitor custom traffic on IP subnets and IP subnets groups Monitor end user traffic (username based) Quickly get insight into traffic structure (top talkers) by hosts, services, protocols, conversations, QoS,… | N/A |
| Datadog | NetVizura NetFlow Analyzer | |||||||||||||||
|---|---|---|---|---|---|---|---|---|---|---|---|---|---|---|---|---|
| Editions & Modules |
| No answers on this topic | ||||||||||||||
| Offerings |
| |||||||||||||||
| Entry-level Setup Fee | Optional | No setup fee | ||||||||||||||
| Additional Details | Discount available for annual pricing. Multi-Year/Volume discounts available (500+ hosts/mo). | Price is based on the number of processed flows. No limitations on the number of user, interfaces etc. | ||||||||||||||
| More Pricing Information | ||||||||||||||||
| Datadog | NetVizura NetFlow Analyzer |
|---|
| Datadog | NetVizura NetFlow Analyzer | |
|---|---|---|
| Small Businesses |  InfluxDB Score 8.8 out of 10 |  NinjaOne Score 9.1 out of 10 |
| Medium-sized Companies |  Sumo Logic Score 8.8 out of 10 |  Intermapper Score 8.4 out of 10 |
| Enterprises |  NetBrain Technologies Score 8.8 out of 10 |  Cisco Meraki Dashboard Score 9.0 out of 10 |
| All Alternatives | View all alternatives | View all alternatives |
| Datadog | NetVizura NetFlow Analyzer | |
|---|---|---|
| Likelihood to Recommend | 9.4 (55 ratings) | 9.0 (2 ratings) |
| Usability | 9.2 (34 ratings) | - (0 ratings) |
| Support Rating | 8.9 (6 ratings) | - (0 ratings) |
| Datadog | NetVizura NetFlow Analyzer | |
|---|---|---|
| Likelihood to Recommend |  Datadog
| Soneco
|
| Pros | Datadog
| Soneco
 Milos Prastalo Network Engineer |
| Cons | Datadog
| Soneco
|
| Likelihood to Renew | Datadog
| Soneco No answers on this topic |
| Usability | Datadog
 Jeffrey van Santen Sr SWE | Soneco No answers on this topic |
| Support Rating | Datadog
| Soneco No answers on this topic |
| Implementation Rating | Datadog
| Soneco No answers on this topic |
| Alternatives Considered | Datadog
| Soneco
Milos Prastalo Network Engineer |
| Return on Investment | Datadog
| Soneco
|
| ScreenShots | Datadog Screenshots      | NetVizura NetFlow Analyzer Screenshots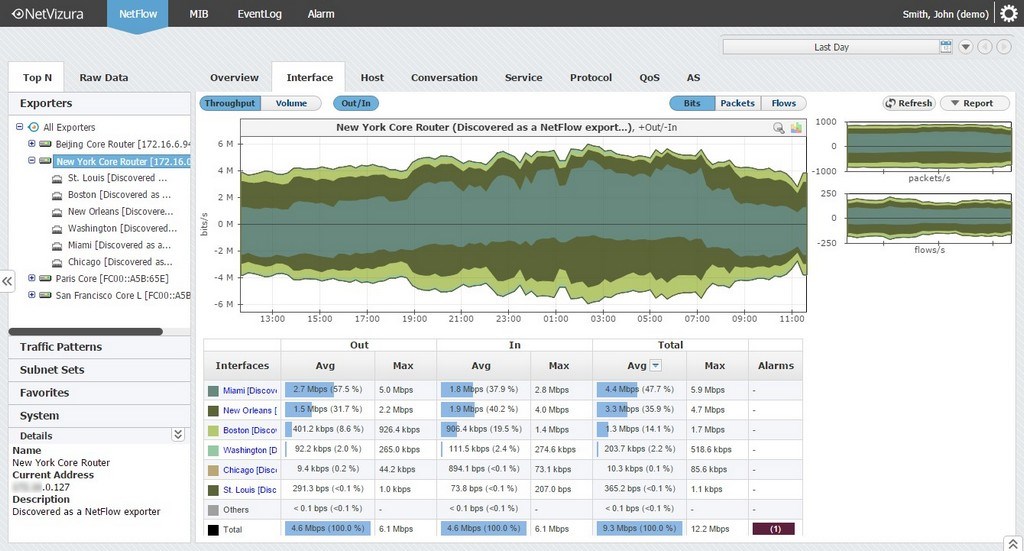     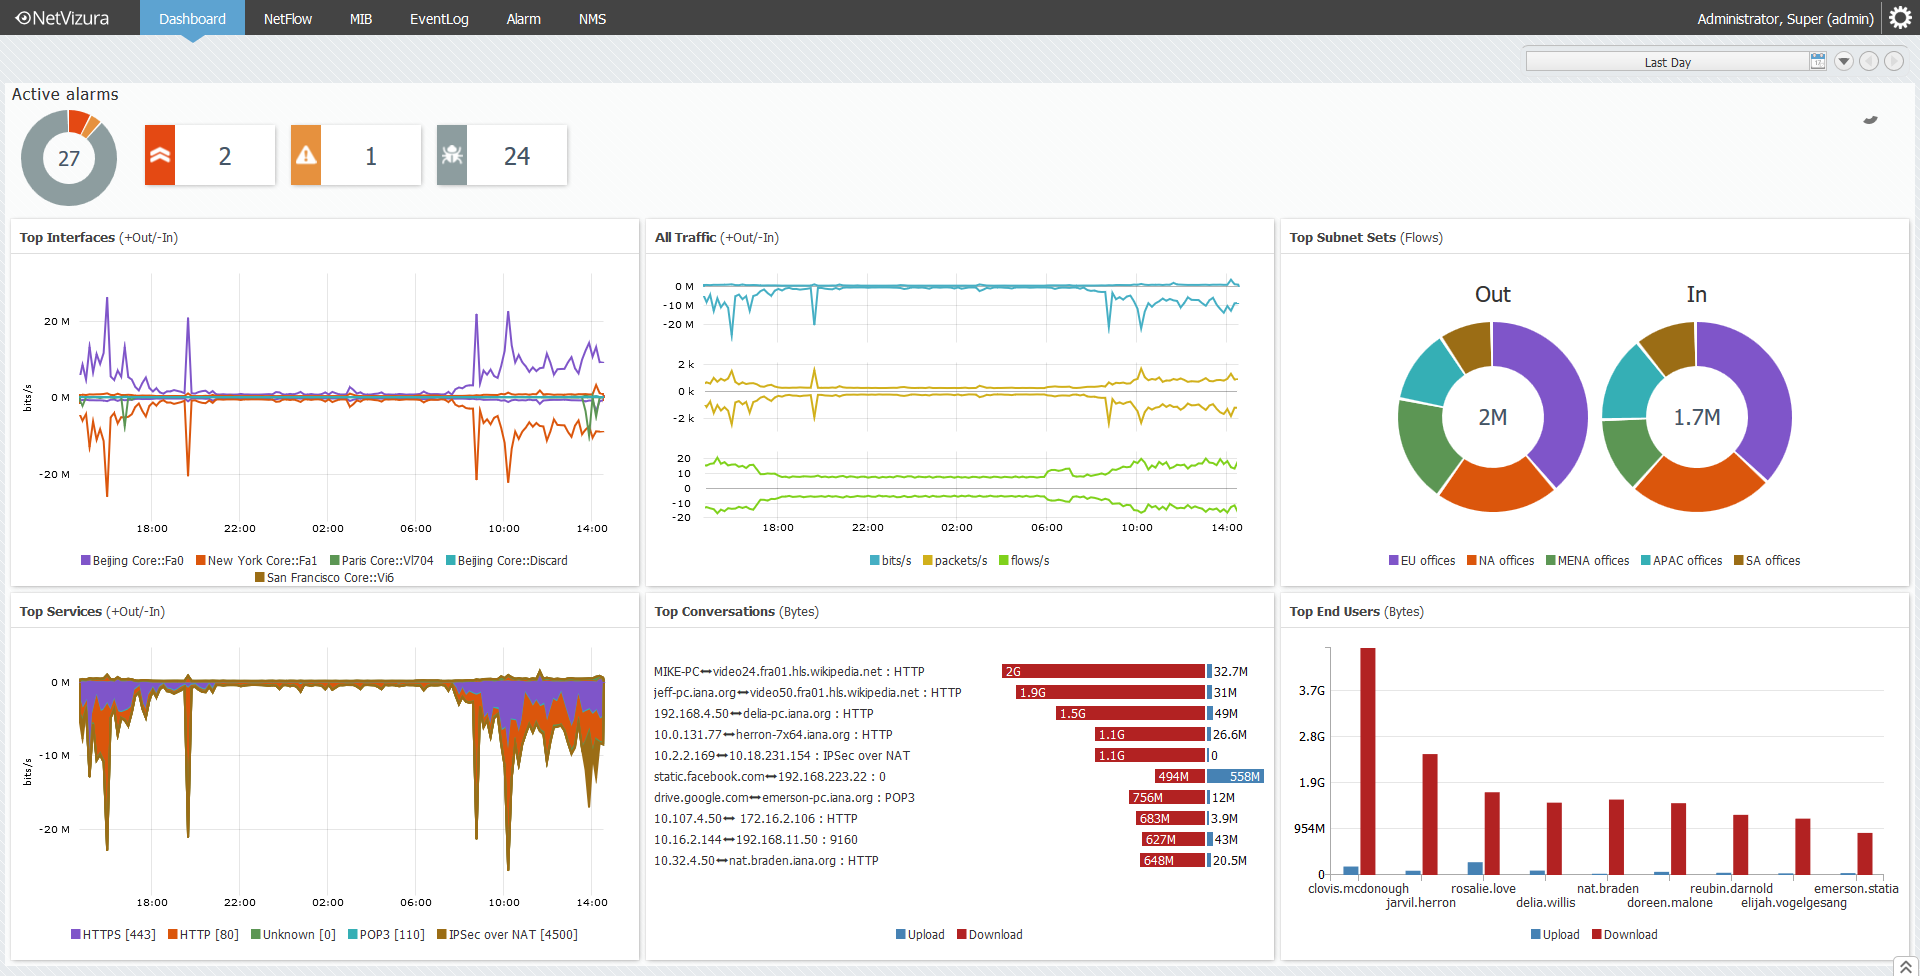 |