Datadog is a monitoring service for IT, Dev and Ops teams who write and run applications at scale, and want to turn the massive amounts of data produced by their apps, tools and services into actionable insight.
$18
per month per host
Redgate Monitor
Score 8.0 out of 10
N/A
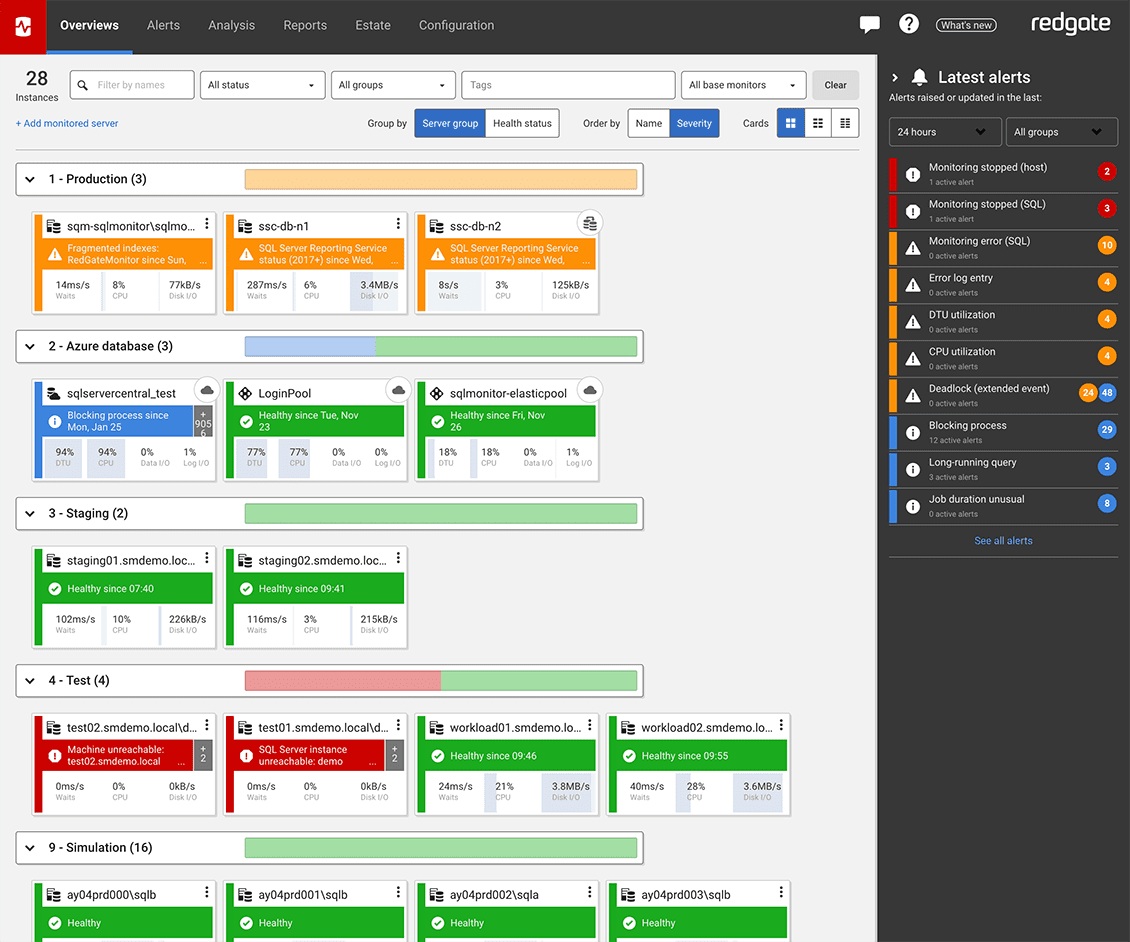
Redgate’s SQL Monitor helps teams looking after SQL servers be more proactive. SQL Monitor enables monitoring environments custom to the user’s SQL server to recognize issues before they impact users. It supports monitoring on-premises and cloud-based servers from a single interface.
$1,164
per year per server
Pricing
Datadog
Redgate Monitor
Editions & Modules
Log Management
$1.27
per month (billed annually) per host
Infrastructure
$15.00
per month (billed annually) per host
Standard
$18
per month per host
Enterprise
$27
per month per host
DevSecOps Pro
$27
per month per host
APM
$31.00
per month (billed annually) per host
DevSecOps Enterprise
$41
per month per host
No answers on this topic
Offerings
Pricing Offerings
Datadog
Redgate Monitor
Free Trial
Yes
Yes
Free/Freemium Version
Yes
No
Premium Consulting/Integration Services
No
Yes
Entry-level Setup Fee
Optional
Optional
Additional Details
Discount available for annual pricing. Multi-Year/Volume discounts available (500+ hosts/mo).
All prices are per server and include one year’s support and upgrades.
Datadog may be better suited for teams that have a more out-of-the-box infrastructure, on the primary platforms Datadog supports. You may also have better results if you have a bigger team dedicated to devops and/or a bigger budget. We found that trying to adapt it to our use case (small team, .NET on AWS Fargate) wasn't feasible. We continually ran into roadblocks that required us to dig through documentation (and at times, having to figure out some documentation was wrong), go back and forth with support, and in my opinion, waste money on excessive and unintended usages due to opaque pricing models and inaccurate usage reports, as well as broken/non-functional rate sampling controls.
With mission-critical SQL Server instances at multiple physical locations and in the cloud, it's critical for us to know immediately when there are performance issues or outages. The Redgate SQL Monitor provides an intuitive dashboard that allows for detailed resource monitoring. Perhaps not as useful in a 100% managed SQL environment.
The thing which Datadog does really well, one of them are its broad range of services integrations and features which makes it one step observability solution for all. We can monitor all types of our application, infrastructure, hosts, databases etc with Datadog.
Its custom dashboard feature which helps us to visualize the data in a better way . It supports different types of charts through those charts we can create our dashboard more attractive.
Its AI powered alerting capability though that we can easily identify the root cause and also it has a low noise alerting capability which means it correlated the similar type of issues.
Alert windows cause lag in notifications (e.g. if the alert window is X errors in 1 hour, we won't get alerted until the end of the 1 hour range)
I would appreciate more supportive examples for how to filter and view metrics in the explorer
I would like a more clear interface for metrics that are missing in a time frame, rather than only showing tags/etc. for metrics that were collected within the currently viewed time frame
Openness - They are too attached to their Intellectual Property to the detriment of usability, stability and reliability. So once its is installed and working leave it alone. Best run it on a VM as that can be restored quickly for when it breaks.
If they exposed an API/SDK that allowed you to leaver their products life would be far sweeter, it would feel less of a battle.
Add WebHooks to SQL Monitor to enhance integration to other subsystems.
Make it easy to install in default mode. So you are not forced to use TomCat Use as ASP.Core Selfl Hosting options.
There are so many features that it can be hard to figure out where you need to go for your own use case. For example, RUM monitoring us buried in a "Digital Experience" sidebar setting when this is one of our key use cases that I sometimes struggle to find in the application. It appears that ECS + Fargate monitoring was recently released which is great because we had to build a lambda reporting solution for ephemeral task monitoring. But this new feature was never on my radar until I starting clicking around the application.
In general, the Redgate dashboard is one of the most thorough yet intuitive products I've had the pleasure of using. Compared to other vendors in different verticals, the Redgate dashboard's deployment, configuration, monitoring, and reporting is second to none
The support team usually gets it right. We did have a rather complicate issue setting up monitoring on a domain controller. However, they are usually responsive and helpful over chat. The downside would be I don’t think they have any phone support. If that is important to you this might not be a good fit.
Our logs are very important, and Datadog manages them exceptionally well. We frequently use Datadog services for our investigations. Use case: Monitor your apps, infrastructure, APIs, and user experience.
Key features:
Logs, metrics, and APM (Application Performance Monitoring)
Real-time alerting and dashboards
Supports Kubernetes, AWS, GCP, and other integrations
RUM (Real User Monitoring) and Synthetics
✅ Best for backend, server, and distributed systems monitoring.