Datadog is a monitoring service for IT, Dev and Ops teams who write and run applications at scale, and want to turn the massive amounts of data produced by their apps, tools and services into actionable insight.
$18
per month per host
SolarWinds Network Configuration Manager (NCM)
Score 8.4 out of 10
N/A
SolarWinds Network Configuration Manager is network diagnostics and troubleshooting technology, from Austin-based SolarWinds.
N/A
Pricing
Datadog
SolarWinds Network Configuration Manager (NCM)
Editions & Modules
Log Management
$1.27
per month (billed annually) per host
Infrastructure
$15.00
per month (billed annually) per host
Standard
$18
per month per host
Enterprise
$27
per month per host
DevSecOps Pro
$27
per month per host
APM
$31.00
per month (billed annually) per host
DevSecOps Enterprise
$41
per month per host
No answers on this topic
Offerings
Pricing Offerings
Datadog
SolarWinds Network Configuration Manager (NCM)
Free Trial
Yes
Yes
Free/Freemium Version
Yes
No
Premium Consulting/Integration Services
No
No
Entry-level Setup Fee
Optional
Optional
Additional Details
Discount available for annual pricing. Multi-Year/Volume discounts available (500+ hosts/mo).
For NCM, there is no other tool that I know of that can work as well as SolarWinds does.
All other products that I have used are mainly used for application performance monitoring more than network configuration capture.
Datadog may be better suited for teams that have a more out-of-the-box infrastructure, on the primary platforms Datadog supports. You may also have better results if you have a bigger team dedicated to devops and/or a bigger budget. We found that trying to adapt it to our use case (small team, .NET on AWS Fargate) wasn't feasible. We continually ran into roadblocks that required us to dig through documentation (and at times, having to figure out some documentation was wrong), go back and forth with support, and in my opinion, waste money on excessive and unintended usages due to opaque pricing models and inaccurate usage reports, as well as broken/non-functional rate sampling controls.
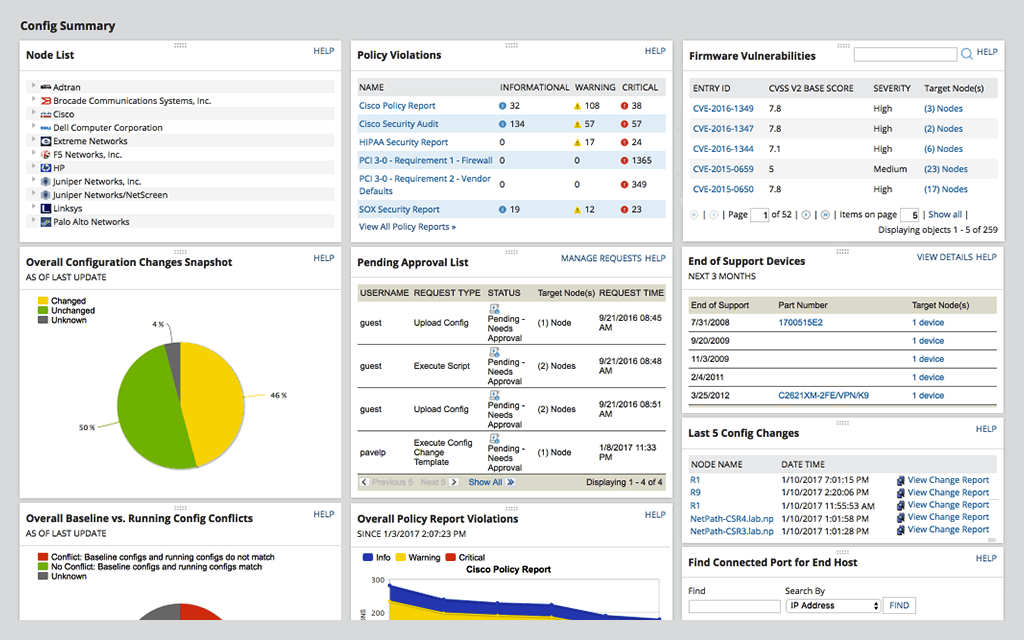
Network Configuration Manager is well suited for backing up configurations of all your devices. It also has a great comparison tool for seeing only the differences in config. Another great feature is it's ability to push a script to any number of devices. This is very handy for pushing changes to one, 10 or multiple devices. There are also some great reports that you can run against the devices in inventory
The thing which Datadog does really well, one of them are its broad range of services integrations and features which makes it one step observability solution for all. We can monitor all types of our application, infrastructure, hosts, databases etc with Datadog.
Its custom dashboard feature which helps us to visualize the data in a better way . It supports different types of charts through those charts we can create our dashboard more attractive.
Its AI powered alerting capability though that we can easily identify the root cause and also it has a low noise alerting capability which means it correlated the similar type of issues.
Alert windows cause lag in notifications (e.g. if the alert window is X errors in 1 hour, we won't get alerted until the end of the 1 hour range)
I would appreciate more supportive examples for how to filter and view metrics in the explorer
I would like a more clear interface for metrics that are missing in a time frame, rather than only showing tags/etc. for metrics that were collected within the currently viewed time frame
For our use case, it does everything great and some of the features we underutilize but I would like to be able to set a configuration baseline when initially adding a node instead of after the configuration is pulled but it's not a particularly big deal to let it pull the configuration then set it as the baseline.
Medium complexity to set up in the beginning if using any non-standard devices or configurations, else fairly easy (e.g. Cisco Nexus or IOS-based devices). Reports are fairly straightforward to set up. Updates to the platform are fairly straightforward and don't take a major effort. Easy to add or remove devices.
There are so many features that it can be hard to figure out where you need to go for your own use case. For example, RUM monitoring us buried in a "Digital Experience" sidebar setting when this is one of our key use cases that I sometimes struggle to find in the application. It appears that ECS + Fargate monitoring was recently released which is great because we had to build a lambda reporting solution for ephemeral task monitoring. But this new feature was never on my radar until I starting clicking around the application.
The user interface is lacking. It is difficult to navigate at times and things can be done multiple ways. Quite often I am confused by how their notification structure works. It is not very intuitive. They do offer a free Academy. They also offer a community of other technical folks. I have enjoyed both.
The support team usually gets it right. We did have a rather complicate issue setting up monitoring on a domain controller. However, they are usually responsive and helpful over chat. The downside would be I don’t think they have any phone support. If that is important to you this might not be a good fit.
To be fair, I have not had to involve Support in a number of years, but when I did, I was greeted with enthusiastic engineers who wanted to understand and solve the issue. It was a fairly complex scenario and I have discovered in my most recent implementation that engineering included that option as a standard now.
Solarwinds has actually produced new training since I last used it that is available on their site at any time. Their previous training was more than enough to get us started but now there is significantly more content. Since I'm comfortable with the Orion platform and the products we use I haven't checked the new training out yet but we have new staff go through portions of that training and they always come away with an understanding of the platform and ready to use it
it was a fairly easy implementation and everything was pretty straightforward. only challenge we had was getting all the snmp communities updated on the networking equipment
Our logs are very important, and Datadog manages them exceptionally well. We frequently use Datadog services for our investigations. Use case: Monitor your apps, infrastructure, APIs, and user experience.
Key features:
Logs, metrics, and APM (Application Performance Monitoring)
Real-time alerting and dashboards
Supports Kubernetes, AWS, GCP, and other integrations
RUM (Real User Monitoring) and Synthetics
✅ Best for backend, server, and distributed systems monitoring.
At the time SolarWinds was the biggest player in the space and their whole portfolio was very comprehensive. As time progressed and newer technologies came about (i.e. SDWAN) their products couldn't keep up with the consumer demands and changing market. Security became such a big focus that once Solarwinds got hacked we had to remove all their products from our environment
Saves 100s of hours a year in man hours over manual configuration.
Saved easily 50k in lost revenue when a switch rebooted with months old unsaved configuration. NCM let us quickly restore a snapshot of the running config from the previous day.
Saves us several man hours per week of config auditing by reducing all changes to a summary email.