Foglight is a database performance management suite from Quest, with modules to perform cloud analytics, network performance monitoring and virtualization management, scaling to a broad, cloud / virtualization focused IT infrastructure monitoring solution.
N/A
PingPlotter
Score 8.8 out of 10
N/A
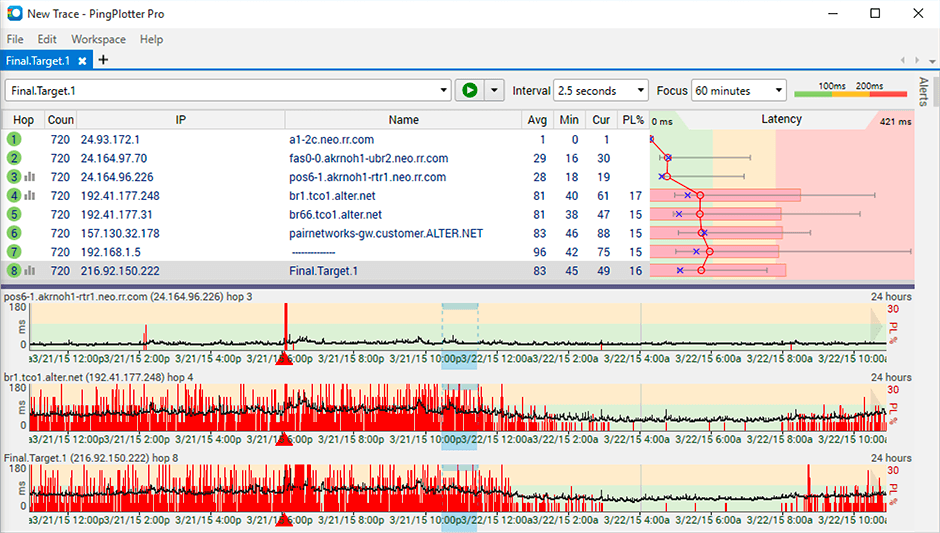
PingPlotter is a graphical traceroute and ping tool that visualizes network performance in a way that makes identifying the source of problems quicker and easier for everyone from online gamers and video streamers to VoIP admins and IT pros. Features for remote deployment, network monitoring, scripting, and a web interface are included along with several additional capabilities.
Foglight is a tool that allows productivity to advance quickly and safely, offering data monitoring and optimization, guaranteeing the success of our business. It is a solution that provides relevant data for strategy and data analysis without losing sight of the final …
Foglight was chosen years ago as a replacement for Groundwork. After 2.5 years of implementing Groundwork things were still not complete and the decision to go with a more formalized solution was made. Foglight installed easily and quickly nearly across the board and the full …
We selected Foglight almost 6 years ago for its advancements in the APM space, moving toward a single pane of glass and their SaaS development. They have since abandoned the APM and SaaS offerings to focus solely on Database and Compute monitoring. This is why we are migrating …
We were previously using Oracle to monitor resources across servers and networks. In general, that product was alright but the Foglight alerts are far superior to Oracle. The business goal of using Foglight is really to minimize business interruption costs so the faster and …
I used Ping.app and UptimeLog.app on the Mac. These both provided different aspects. These two had a menubar to show me green or red for multiple connections. UptimeLog showed me very clearly when my connectivity was on or off and for exactly how long.
I've tried more products that are not in the list but PingPlotter is the easiest to use and the better one so far because of the interface and function.
PingPlotter has better visualizations and a stronger ability to capture historical data than other tools I've used. This makes it easier to find the root cause by looking back in the log data to find where latency or packet loss occurred.
A balance of a generic tool vs a network equipment product is necessary when investigating network incidents or disruptions. Need to train the engineer to use both tools to perform their analysis and to dive down to the issues as fast as they can. Experience with the tools will …
PingPlotter stacks up very well to Solarwinds NPM and can provide many of the same benchmark tests that Solarwinds can. PingPlotter is most certianly much better at doing Traceroutes than NPM, and you can run a lot of the same reports.
PingPlotter is a basic version of Auvik, although it is easier to setup and there is less intrusion in the customers network. This allows us to use PingPlotter as a prospecting tool and allows to accurately gather network information very quickly. Basic troubleshooting is great …
I have tried a few free products and some paid ones but never really did what I wanted. I just needed a simple, always-on link monitor specifically with a traceroute element and this is what PingPlotter delivers. The others were either overly complex or too expensive, some just …
It really depends on why my colleague is evaluating Foglight. If it is for Database monitoring and management, I highly recommend it. If it is for anything else, I would encourage them to look at others in this space.
It is well suited for performing monitoring and testing from a single device. It is less appropriate if you have to monitor from multiple different endpoints. That type of deployment would be more of an enterprise application. If you are looking for an end user monitoring solution then PingPlotter is the one for you.
Foglight allows detecting and diagnosing performance problems simplifying hybrid environments, it is a solution that has perfect features which work in a flexible and intuitive way, it allows database performance in a safe and fast way. It works perfectly with nothing else to add.
Its a little confusing to see which targets are currently running pings and which ones are displayed in the plots.
Starting and stopping pings requires a right click and that would be better with a play/pause button I think.
Ability to drag and drop the graphs to reorder them.
more columns to show which targets are running and which are displayed. Currently this is done with symbols so you cant sort by just the running targets for example I've found.
I installed it and it just started working. I realized I could then tweak it to show what I needed but didn't have to spend a long time configuring it before use, editing YAML files etc. Maybe that's fine for a network professional, but I only need this software if something goes wrong, and then need it to work quickly out of the box.
I have not had much contact with the PingPlotter support, only one time have I went to them and it was a positive experience. The questions I had were answered quickly and professionally. I have no issue with the experience I had with the Support team. This was from before and after the purchase of the product.
Foglight was chosen years ago as a replacement for Groundwork. After 2.5 years of implementing Groundwork things were still not complete and the decision to go with a more formalized solution was made. Foglight installed easily and quickly nearly across the board and the full implementation for complex infrastructure was completed (with no Professional Services) by us in under 4 months. Nagios is a wonderful toolkit but you have to be ready to build what you need. It's flexibility and breadth are excellent features but with that comes the need to define things very tightly lest you embark on the project that never ends (see above about Groundwork). Dynatrace is an excellent APM tool and has advanced analytics but as a general infrastructure monitoring tool it is actually very expensive and to be honest does not have the same focus and full feature set that it does on it's APM (which to be fair is it's wheelhouse). vROPs (we also have) is a wonderful tool but focused (and rightly so) on satisfying the VMware engineers in the crowd and doesn't put itself out there too far to make things palatable for the non-engineering crowd.
I used Ping.app and UptimeLog.app on the Mac. These both provided different aspects. These two had a menubar to show me green or red for multiple connections. UptimeLog showed me very clearly when my connectivity was on or off and for exactly how long