Goliath Performance Monitor is an IT infrastructure monitoring platform from Goliath Technologies in Conshohocken, Pennsylvania.
N/A
Splunk Observability Cloud
Score8.5 out of 10
N/A
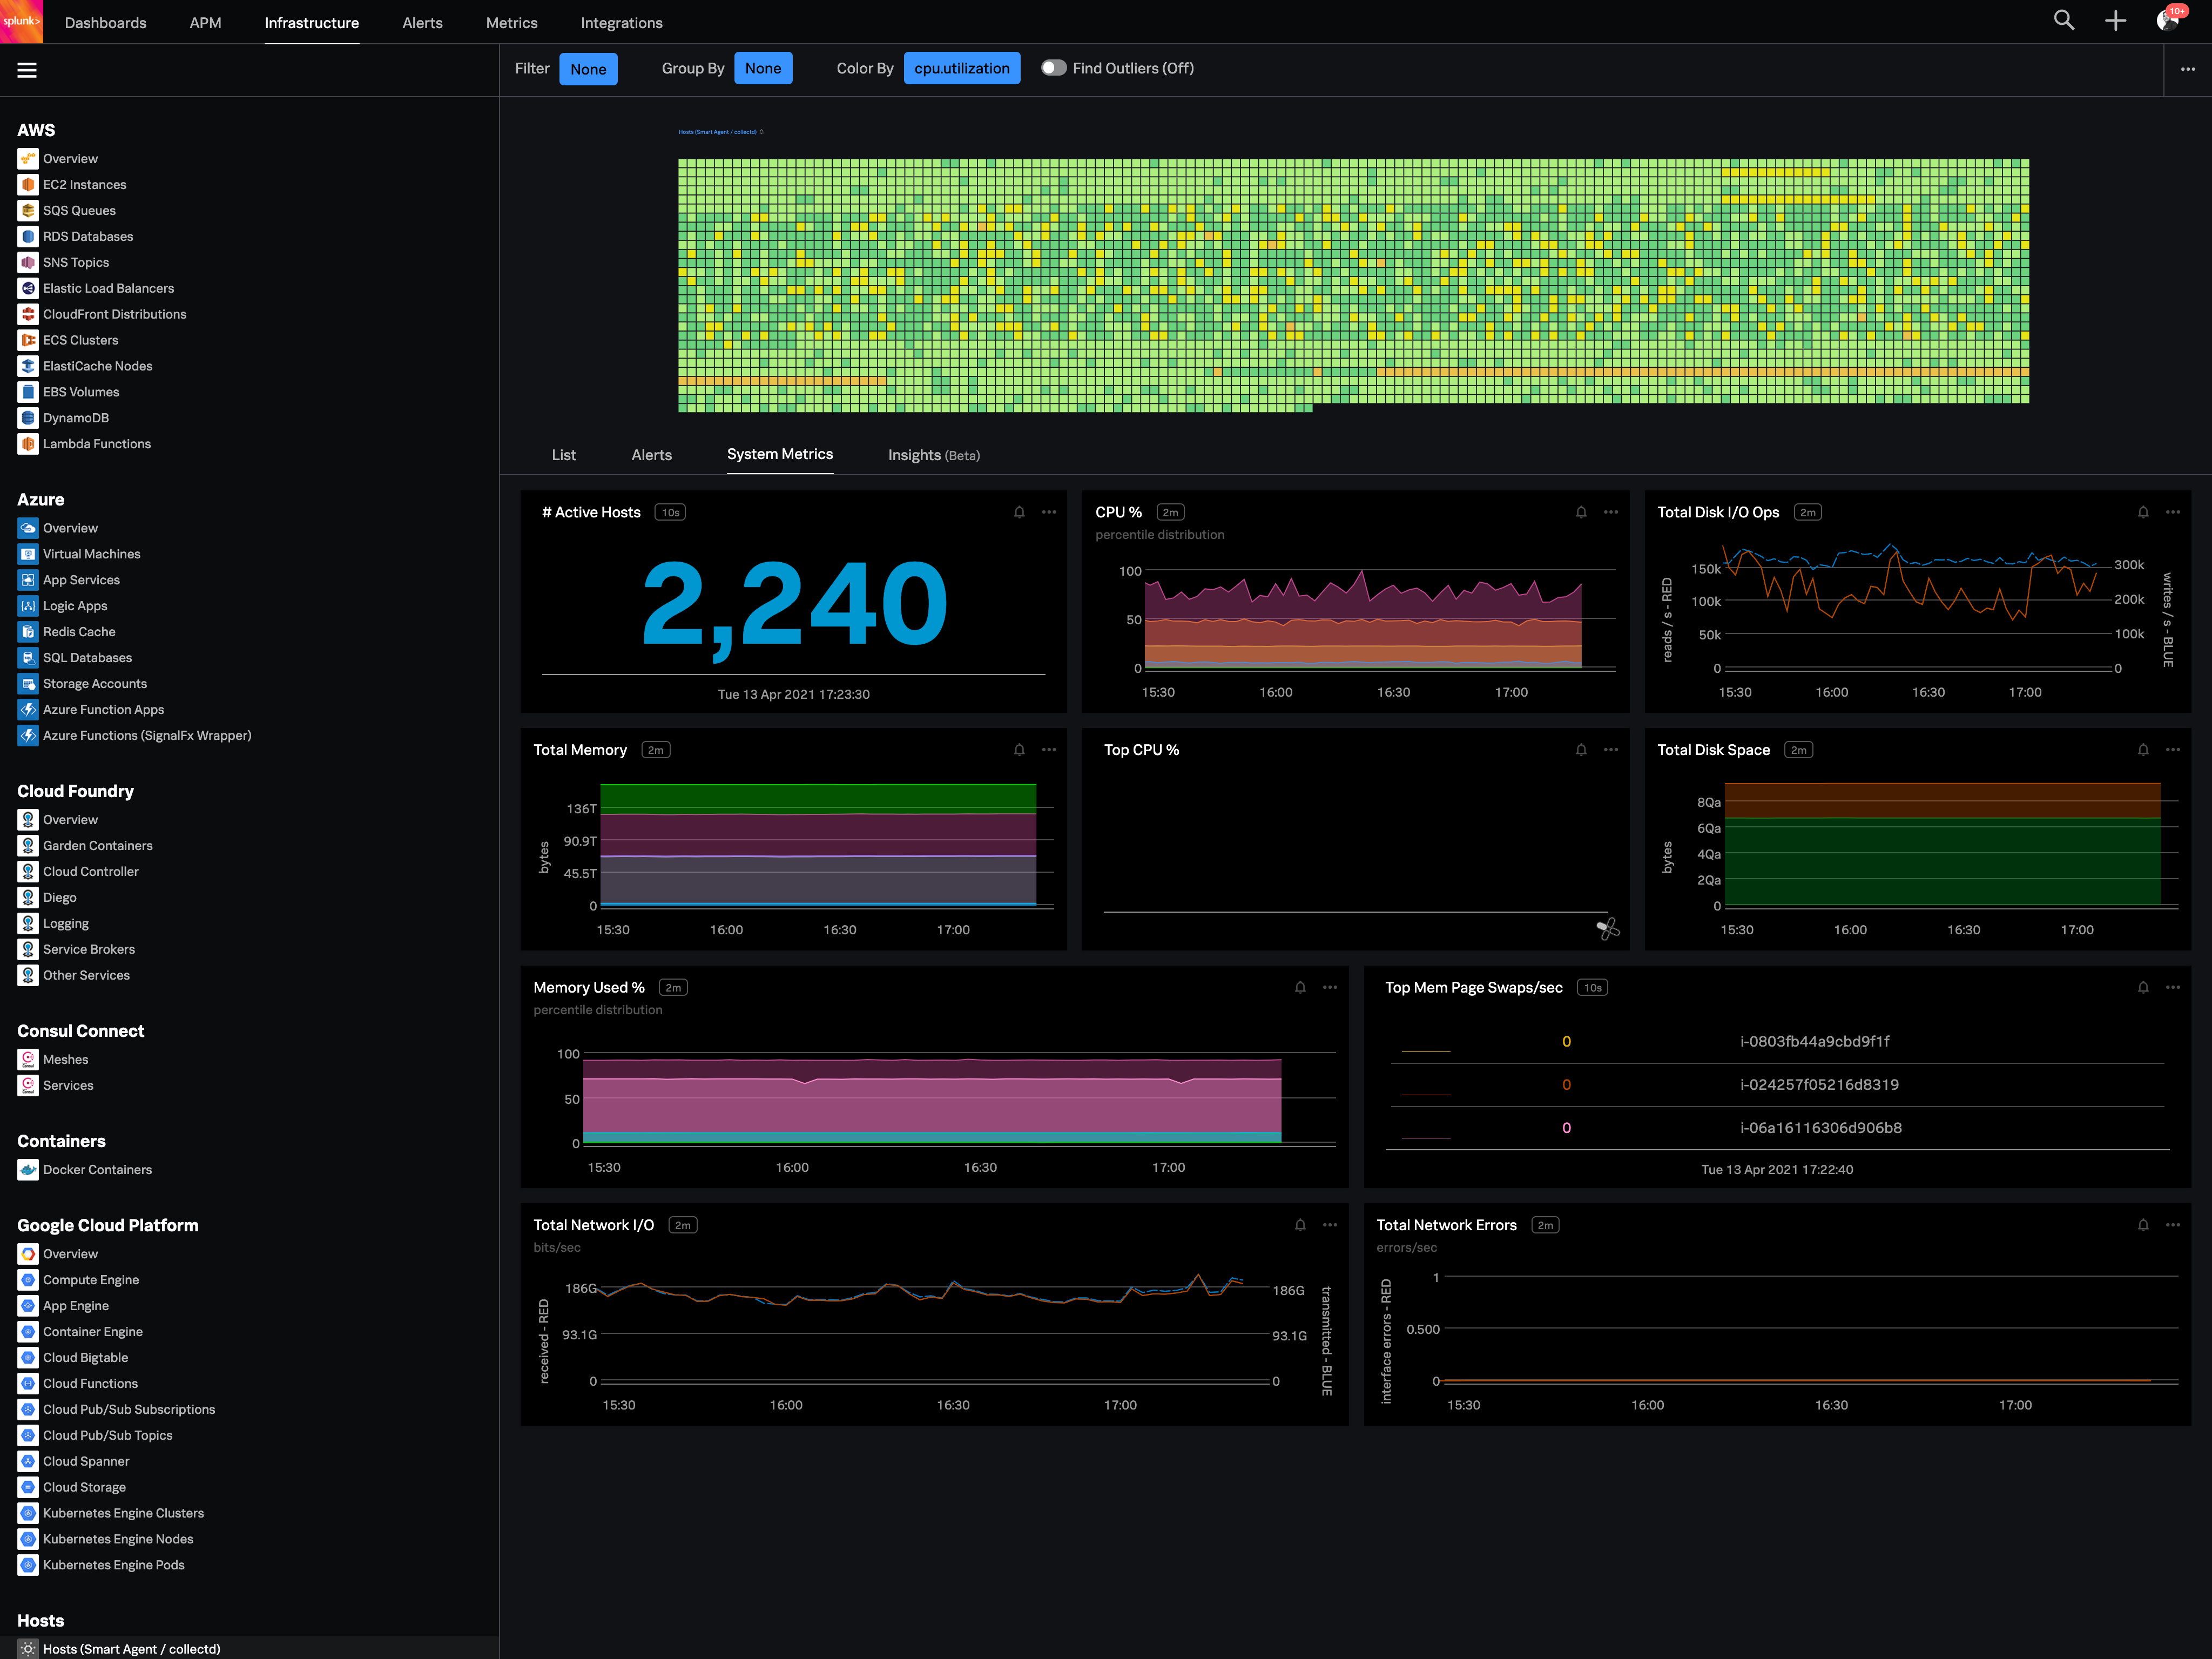
Splunk Observability Cloud aims to enable operational agility and better customer experience through real-time AI-driven streaming analytics allowing accurate alerts in seconds. It is designed to shorten MTTD and MTTR by providing real-time visibility into cloud infrastructure and services.
GPM is well suited to environments where there is a high volume of Citrix traffic coupled with a lot of different hardware infrastructure endpoints. Large scale multi-user operations where performance issue detection and resolution are key are the primary areas where GPM excels. Use of the GPM product is less appropriate when trying to monitor response times in a JVM application environment.
A de minimis incentive was given to thank the reviewer for their time. The incentive was not used to bias or drive a particular response, nor was the incentive contingent on a positive endorsement. More Info
Its great if you need real-time visibility across complex or regulated environments. Also strong for hybrid or multi-cloud setups where uptime, observability and fast IR are required. It’s probably overkill for smaller teams or environments that don’t have constant changes or compliance reporting needs. It's expensive and has a steep learning curve. Also, in my opinion, do not get yourself into a consumption based model. Costs can certainly get out of control quickly.
A de minimis incentive was given to thank the reviewer for their time. The incentive was not used to bias or drive a particular response, nor was the incentive contingent on a positive endorsement. TR verified that a representative sample of customers was invited. More Info
GPM does exceptionally well at gathering and presenting deep metrics from our Citrix servers and storing them in the GPM database server. This is a vital strength for any system monitoring tool and allows administrators to address almost any system related performance question.
The MonitorIT front end console does a great job of providing graphical views the summarize data from a multitude of locations. This is particularly important in that it allows administrators to focus in on the reasons for performance issues in a proactive manner before hearing from the end users, especially given the large volumes of detailed data captured by the system
The MonitorIT product is also very adept at gathering metrics across the processing continuum, providing metrics for system resources, service availability and end-to-end user activity. This is a great strength of the system and allows us to develop Tableau visualizations in addition to the extensive reports and dashboarding capabilities of the GPM product.
A de minimis incentive was given to thank the reviewer for their time. The incentive was not used to bias or drive a particular response, nor was the incentive contingent on a positive endorsement. More Info
The first one is its Kubernetes container monitoring.
I really like this features because as we know how much K8s is vast and to manually monitor each part of the Kubernetes it takes so much time but Splunk Observability Cloud makes it easier. And even once we integrate K8s with Splunk Observability Cloud it gives us some prebuilt dashboards which gives holistic view of our Cluster and its nodes, pods, etc.
The dashbaord feature of Splunk Observability Cloud, it gives us full flexibility to customize our dashboard with a wide range of predefined chart types.
Now it also supports OTEL, which is a plus point for observability. As now everyone is moving towards Otel and in current market there are only few tools who supports OTEL based integrations, Splunk Observability Cloud is one out of them.
A de minimis incentive was given to thank the reviewer for their time. The incentive was not used to bias or drive a particular response, nor was the incentive contingent on a positive endorsement. TR verified that a representative sample of customers was invited. More Info
From a purely personal level I would like to see MonitorIT be able to consume data from our clinical/operational databases instead of relying only on taking data in via the agent, log files and scripted sysoutput.
I think some improvements are possible in the area of custom monitoring of file systems, especially for the detection of missing file scenarios and file volume/rates. GPM only monitors traditional file system metrics like I/O, availability and space utilization, but custom scripting is possible within the design of the system.
Improvements in documenting the data model of the GPM database schema would also be very useful to advanced users of the system especially when additional external reporting tools are used to extend the GPM usefulness
A de minimis incentive was given to thank the reviewer for their time. The incentive was not used to bias or drive a particular response, nor was the incentive contingent on a positive endorsement. More Info
You can use table-like functionality to generate dashboards, but these queries are heavy on the system.
It could be easier to give insight into what type of line parsing is used for specific documents in a company-managed environment and/or show ways to gain the insights needed.
I would like to see ways to anonymize specific data for shared reports without pre-formatting this in a dashboard on which reports could be based.
A de minimis incentive was given to thank the reviewer for their time. The incentive was not used to bias or drive a particular response, nor was the incentive contingent on a positive endorsement. More Info
Good: Stable system with low error rate Easy to use for simple use cases Bad: UI is not very clear for complex usage Mobile view (when logged in from phone) is bad No library for .net
A de minimis incentive was given to thank the reviewer for their time. The incentive was not used to bias or drive a particular response, nor was the incentive contingent on a positive endorsement. More Info
When there is an issue, it’s a win if one can easily identify the root cause. To do the same, it should allow the user to dig deep with multiple data points and compare the data and identify the anomaly. In this use case, it’s good to drive from Splunk 011y.
A de minimis incentive was given to thank the reviewer for their time. The incentive was not used to bias or drive a particular response, nor was the incentive contingent on a positive endorsement. More Info
A de minimis incentive was given to thank the reviewer for their time. The incentive was not used to bias or drive a particular response, nor was the incentive contingent on a positive endorsement. More Info
A de minimis incentive was given to thank the reviewer for their time. The incentive was not used to bias or drive a particular response, nor was the incentive contingent on a positive endorsement. More Info
We eventually settled on GPM because of its very obvious strength and depth with Citrix monitoring. Our entire clinical system is deployed over a Citrix infrastructure so it was essential to choose a system whose key focus was Citrix monitoring. GPM's functionality is unrivaled when it comes to Citrix monitoring which is immediately apparent when one witnesses the deep internals of the Citrix platform being collected and reported on, in close to real-time.
A de minimis incentive was given to thank the reviewer for their time. The incentive was not used to bias or drive a particular response, nor was the incentive contingent on a positive endorsement. More Info
Splunk Infrastructure Monitoring provides far superior options for anybody using a complex hybrid multi-cloud environment and allows both your SOC and NOC to work together on the same data while driving their own insights. We found other products are still in the old world view of servers and agents residing together within a single data centre, but modern apps are no longer like this.
A de minimis incentive was given to thank the reviewer for their time. The incentive was not used to bias or drive a particular response, nor was the incentive contingent on a positive endorsement. More Info
GPM has had a decent positive ROI particularly in terms of identifying systemic issues and prevention of system downtimes or resource depletion etc. The GPM product shines a spotlight on configuration and design flaws and as a result makes the systems more stable and responsive, saving us time and effort in diagnosing and reporting on system problems. unfortunately these are quite intangible but nevertheless invaluable business objectives for us, but we can say that downtimes and slowness events have dropped consistently year on year since we deployed GPM.
Our overall objectives with the GPM project was to deploy a system that could be deployed centrally in our Corp datacenter while monitoring devices and users out in the facilities across the East, Central and West geographic regions. The cost of the endpoint agents was quite modest and provided great functionality at this price point. In this respect our business objectives are well satisfied and the system has been a complete success.
An important aspect of our business objective was to have a monitoring system that didn't require constant maintenance and babysitting, and as such the GPM system has worked out fantastically in that we only use 1-2 staff resources to monitor all the systems mentioned earlier in this review.
A de minimis incentive was given to thank the reviewer for their time. The incentive was not used to bias or drive a particular response, nor was the incentive contingent on a positive endorsement. More Info
A de minimis incentive was given to thank the reviewer for their time. The incentive was not used to bias or drive a particular response, nor was the incentive contingent on a positive endorsement. More Info