GoodData vs. Lightning Tools Data Viewer

Overview
ProductRatingMost Used ByProduct SummaryStarting Price
GoodData
Score 8.6 out of 10
N/A
GoodData is an analytics platform used by organizations to deliver real-time, governed insights, embedded into products, customized for users, and integrated into any data environment.N/A
Lightning Tools Data Viewer
Score 9.1 out of 10
Mid-Size Companies (51-1,000 employees)
The Data Viewer provides data visualization in the form of reports or charts that can be created and customized to suit a business's needs. Silos of data exist in most organizations and yet contain valuable insights into how well the organization is performing and where action is needed. Those silos often include Microsoft Excel workbooks, Microsoft SQL Azure databases, On-Premises data sources accessible through OData or Business Connectivity Services and even SharePoint Lists. These data…
$2,200
per year per installation
Pricing
GoodDataLightning Tools Data Viewer
Editions & Modules
No answers on this topic
Data Viewer OnPrem
$1,000
per year Per installation, 1 x WFE
Data Viewer Online
$2,200
per year per installation
Data Viewer OnPrem Enterprise Edition
POA
per year Per installation, 4+ WFE
Data Viewer Online Enterprise Edition
POA
per year per installation
Offerings
Pricing Offerings
GoodDataLightning Tools Data Viewer
Free Trial
YesYes
Free/Freemium Version
NoNo
Premium Consulting/Integration Services
YesYes
Entry-level Setup FeeOptionalNo setup fee
Additional DetailsPrices stated are minimum per installation for "stock" products. $2.20 per user / year on top of base price. Enterprise editions can be amended to suit business needs if deemed necessary, additional costs incurred and TBD. All packages include free technical support. Free upgrades available to latest versions of tool as they are released. (online version)
More Pricing Information
Community Pulse
GoodDataLightning Tools Data Viewer
Features
GoodDataLightning Tools Data Viewer
BI Standard Reporting
Comparison of BI Standard Reporting features of Product A and Product B
GoodData
8.0
70 Ratings
13% above category average
Lightning Tools Data Viewer
9.1
1 Ratings
12% above category average
Pixel Perfect reports8.053 Ratings00 Ratings
Customizable dashboards8.670 Ratings9.11 Ratings
Report Formatting Templates7.359 Ratings9.11 Ratings
Ad-hoc Reporting
Comparison of Ad-hoc Reporting features of Product A and Product B
GoodData
7.9
70 Ratings
2% above category average
Lightning Tools Data Viewer
8.2
1 Ratings
5% above category average
Drill-down analysis7.868 Ratings6.41 Ratings
Formatting capabilities7.470 Ratings9.11 Ratings
Report sharing and collaboration7.466 Ratings9.11 Ratings
Data Discovery and Visualization
Comparison of Data Discovery and Visualization features of Product A and Product B
GoodData
7.4
67 Ratings
2% below category average
Lightning Tools Data Viewer
3.6
1 Ratings
73% below category average
Pre-built visualization formats (heatmaps, scatter plots etc.)8.065 Ratings3.61 Ratings
Location Analytics / Geographic Visualization7.554 Ratings00 Ratings
Predictive Analytics6.739 Ratings00 Ratings
Pattern Recognition and Data Mining7.219 Ratings00 Ratings
Access Control and Security
Comparison of Access Control and Security features of Product A and Product B
GoodData
8.0
71 Ratings
6% above category average
Lightning Tools Data Viewer
-
Ratings
Multi-User Support (named login)8.470 Ratings00 Ratings
Role-Based Security Model7.863 Ratings00 Ratings
Multiple Access Permission Levels (Create, Read, Delete)8.069 Ratings00 Ratings
Single Sign-On (SSO)7.843 Ratings00 Ratings
Application Program Interfaces (APIs) / Embedding
Comparison of Application Program Interfaces (APIs) / Embedding features of Product A and Product B
GoodData
8.1
48 Ratings
8% above category average
Lightning Tools Data Viewer
-
Ratings
REST API8.241 Ratings00 Ratings
Javascript API8.136 Ratings00 Ratings
iFrames8.139 Ratings00 Ratings
Best Alternatives
GoodDataLightning Tools Data Viewer
Small Businesses
Yellowfin
Yellowfin
Score 8.8 out of 10
Supermetrics
Supermetrics
Score 9.9 out of 10
Medium-sized Companies
Reveal
Reveal
Score 10.0 out of 10
Supermetrics
Supermetrics
Score 9.9 out of 10
Enterprises
Infor Birst
Infor Birst
Score 6.3 out of 10
IBM Analytics Engine
Score 8.5 out of 10
All AlternativesView all alternativesView all alternatives
User Ratings
GoodDataLightning Tools Data Viewer
Likelihood to Recommend
8.6
(98 ratings)
9.1
(1 ratings)
Likelihood to Renew
9.0
(16 ratings)
-
(0 ratings)
Usability
8.0
(77 ratings)
-
(0 ratings)
Availability
10.0
(2 ratings)
-
(0 ratings)
Performance
10.0
(2 ratings)
-
(0 ratings)
Support Rating
9.9
(8 ratings)
-
(0 ratings)
In-Person Training
9.0
(1 ratings)
-
(0 ratings)
Online Training
8.0
(1 ratings)
-
(0 ratings)
Implementation Rating
6.0
(3 ratings)
-
(0 ratings)
Configurability
8.0
(1 ratings)
-
(0 ratings)
Ease of integration
7.2
(3 ratings)
-
(0 ratings)
Product Scalability
10.0
(1 ratings)
-
(0 ratings)
Vendor post-sale
10.0
(1 ratings)
-
(0 ratings)
Vendor pre-sale
8.0
(1 ratings)
-
(0 ratings)
User Testimonials
GoodDataLightning Tools Data Viewer
Likelihood to Recommend
GoodData
GoodData is well suited for classic business intelligence and data analytics solution involving visually driven content using charts and graphs. It's rich collection and drillable interactions make it perfect for embedded analytics where application workflow is tied to analytics. However, GoodData may not be ideal or appropriate for such solutions that require lot of textual content to be displayed with the help of tabular visuals, particularly in regulated industries where the key is in the details. This is all tied to the platform limits that force the default layout to pre-filter
Read full review
Lightning Tools
Lightning Tools Data Viewer is well suited for re-surfacing data and customizing its look and feel.
Read full review
Pros
GoodData
  • GoodData provides advanced analytics for predictive modeling. This assists in identifying potential issues before they arise, and making proactive decisions.
  • GoodData prioritizes data security and compliance, providing features that help IT firms like ours adhere to regulatory requirements.
  • GoodData gives high customization dashboards, allows us professionals to create tailored view of KPI.
Read full review
Lightning Tools
  • Shows Lists created on different sites to be seen and controlled on another site in a Tenant
  • Allows selection of layouts and coloring way beyond what other programs do.
  • Easy to learn and very functional.
Read full review
Cons
GoodData
  • Good Data is already have certain customizable options. However, having more flexibility in customizing reports and dashboards & control over the visual aspects would enhance the overall user experience.
  • To make Good Data even more powerful tool, improving the speed and responsiveness of the tool, especially during data-intensive tasks, would be a significantly helpful.
  • For new users, the interface can be made more user friendly which would promote easy navigation through features of tool.
Read full review
Lightning Tools
  • Data Viewer has a graph feature that is old school flat design. We loved the In House real 3D graph Lightning Tools program.
Read full review
Likelihood to Renew
GoodData
Because gooddata really helps us in processing data to make reports or dashboards. So we are very satisfied when we use it. What we like is the flexible use of charts. We change at will the use of charts to display in reports or dashboards. Thank you Gooddata for helping companies like us who need flexibility in usage
Read full review
Lightning Tools
No answers on this topic
Usability
GoodData
From a customer perspective it is incredibly usable. We have more users building their own reports that would normally need custom work from our support team. The back end can be daunting when trying to configure things like new data elements or push changes to a report to all existing customers.
Read full review
Lightning Tools
No answers on this topic
Reliability and Availability
GoodData
We are approximately one month since go-live. There has been one short outage.
Read full review
Lightning Tools
No answers on this topic
Performance
GoodData
I'm generally impressed with how fast it reflects so much data.
Read full review
Lightning Tools
No answers on this topic
Support Rating
GoodData
Support team has been highly responsive and helpful from our first initial deployment to present day. They engage and work with us. know when to escalate for more challenging problems. They also follow up. Overall have had a very good experience with support
Read full review
Lightning Tools
No answers on this topic
In-Person Training
GoodData
Petr was a rock star - patient, knowledgeable, clear and easy to work with.
Read full review
Lightning Tools
No answers on this topic
Online Training
GoodData
GoodData implementation team was professional and courteous
Read full review
Lightning Tools
No answers on this topic
Implementation Rating
GoodData
Implementations are hard and we had limited technical resources. We relied too heavily on GD care team. When we found technical gaps, they weren't simple to overcome
Read full review
Lightning Tools
No answers on this topic
Alternatives Considered
GoodData
GoodData comparing to other platform is very easy to use, customer support and on-boarding support. Set of features, speed of integration in our platform. Also great benefit for us was very competetive pricing.
Read full review
Lightning Tools
Lightning Tools Data Viewer is much easier and more powerful than Infowise similar viewer in their lineup. In this case, we use Data Viewer over the one offered by Infowise.
Read full review
Scalability
GoodData
We now have hundreds of customers on multiple product lines. It's very flexible and we can troubleshoot ourselves.
Read full review
Lightning Tools
No answers on this topic
Return on Investment
GoodData
  • GoodData helped me while making a decision of our marketing spend, next month we got 3X ROI back on a $100,000 a spend.
  • I initially was very dicey about the analytics and reports we see, but now I can make my every dollar investment decisions based on it.
  • Along with our growing data needs, it allow us to handle increased data volumes as well.
Read full review
Lightning Tools
  • It allows us to do things that would take a great deal more time to duplicate in SharePoint
  • It cuts down on ugly looking built in SP list layouts
  • Users find it easy to access, thus this product is more productive
Read full review
ScreenShots

GoodData Screenshots

Screenshot of Screenshot of Screenshot of Screenshot of Screenshot of Screenshot of

Lightning Tools Data Viewer Screenshots
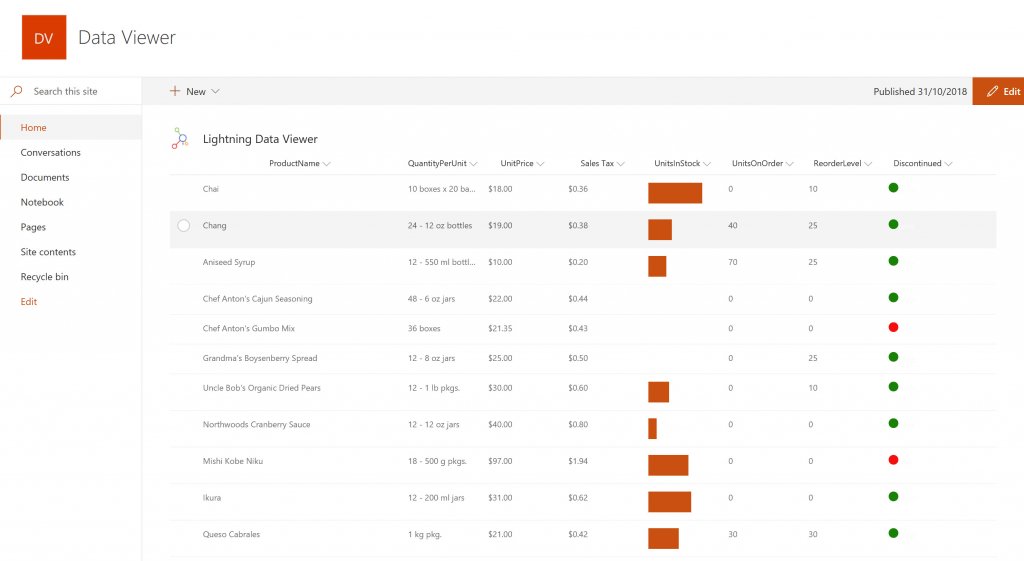
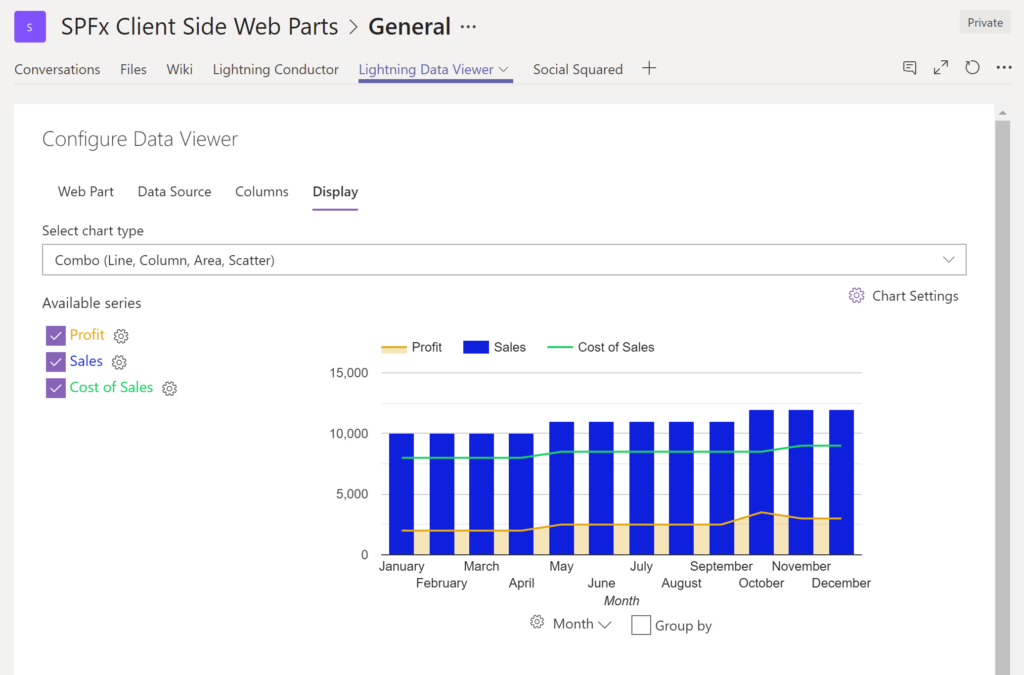
Screenshot of DISPLAYING EXTERNAL DATA WITHIN SHAREPOINT OR MICROSOFT TEAMS
The Data Viewer Client Side Web Part can be configured by Business Users within a few minutes to display Line of Business Data from Data Sources such as Excel,  SQL Azure, Business Connectivity Services, OData and SharePoint Lists.  Connections to an organizations data such as Customer Relationship Management Systems, Accounting Systems, or Custom Databases can be connected, giving business users a live up-to-date view of business information within the context of their SharePoint Team Sites or Microsoft Teams Tabs.Screenshot of HIGHLIGHTING KEY BUSINESS DATA (NO CODE)
Conditional formatting can be used to highlight key business data. Overdue Tasks, Low Stock, Currency Exchange Rates, Sales Revenue are examples of data to highlight visually allowing for a quick reaction time. Key Financial Indicators and Key Performance Indicators can be configured with a simple dialog and no need to write any code. Choose colours, icons or data bars to highlight key data.Screenshot of SELECTING AND STYLING ICONS
Icons can be chosen as part of the conditional formatting to make data stand out. The Office 365 Fabric icons can be selected and styled and applied to cell values. Pepper pots, Smileys, Envelopes and more icons are available. There are hundreds of options to choose from to highlight data that needs to be acted upon.Screenshot of DATA VIEWER CAN BE A GRID OF DATA OR A CHART IN SHAREPOINT OR MICROSOFT TEAMS
The Data Viewer can be used within Microsoft SharePoint Modern Sites or Microsoft Teams Tabs as a Grid of Data with styling or as a Chart which can be configured. The Charting Feature allows for Pie, Donut, Column, Line, Area, and Scatter Charts which can all be configured and displayed in 2D or 3D.Screenshot of TREEMAPS
summary information can be displayed within a TreeMap next to the detail. Users will be able to see trends, and how the business is performing  using the TreeMap view of data.Screenshot of CHARTS AND GAUGES
The Data Viewer is used to represent data in multiple ways using Gauges, TreeMaps, Multiple Series Charts, and Pie Charts.