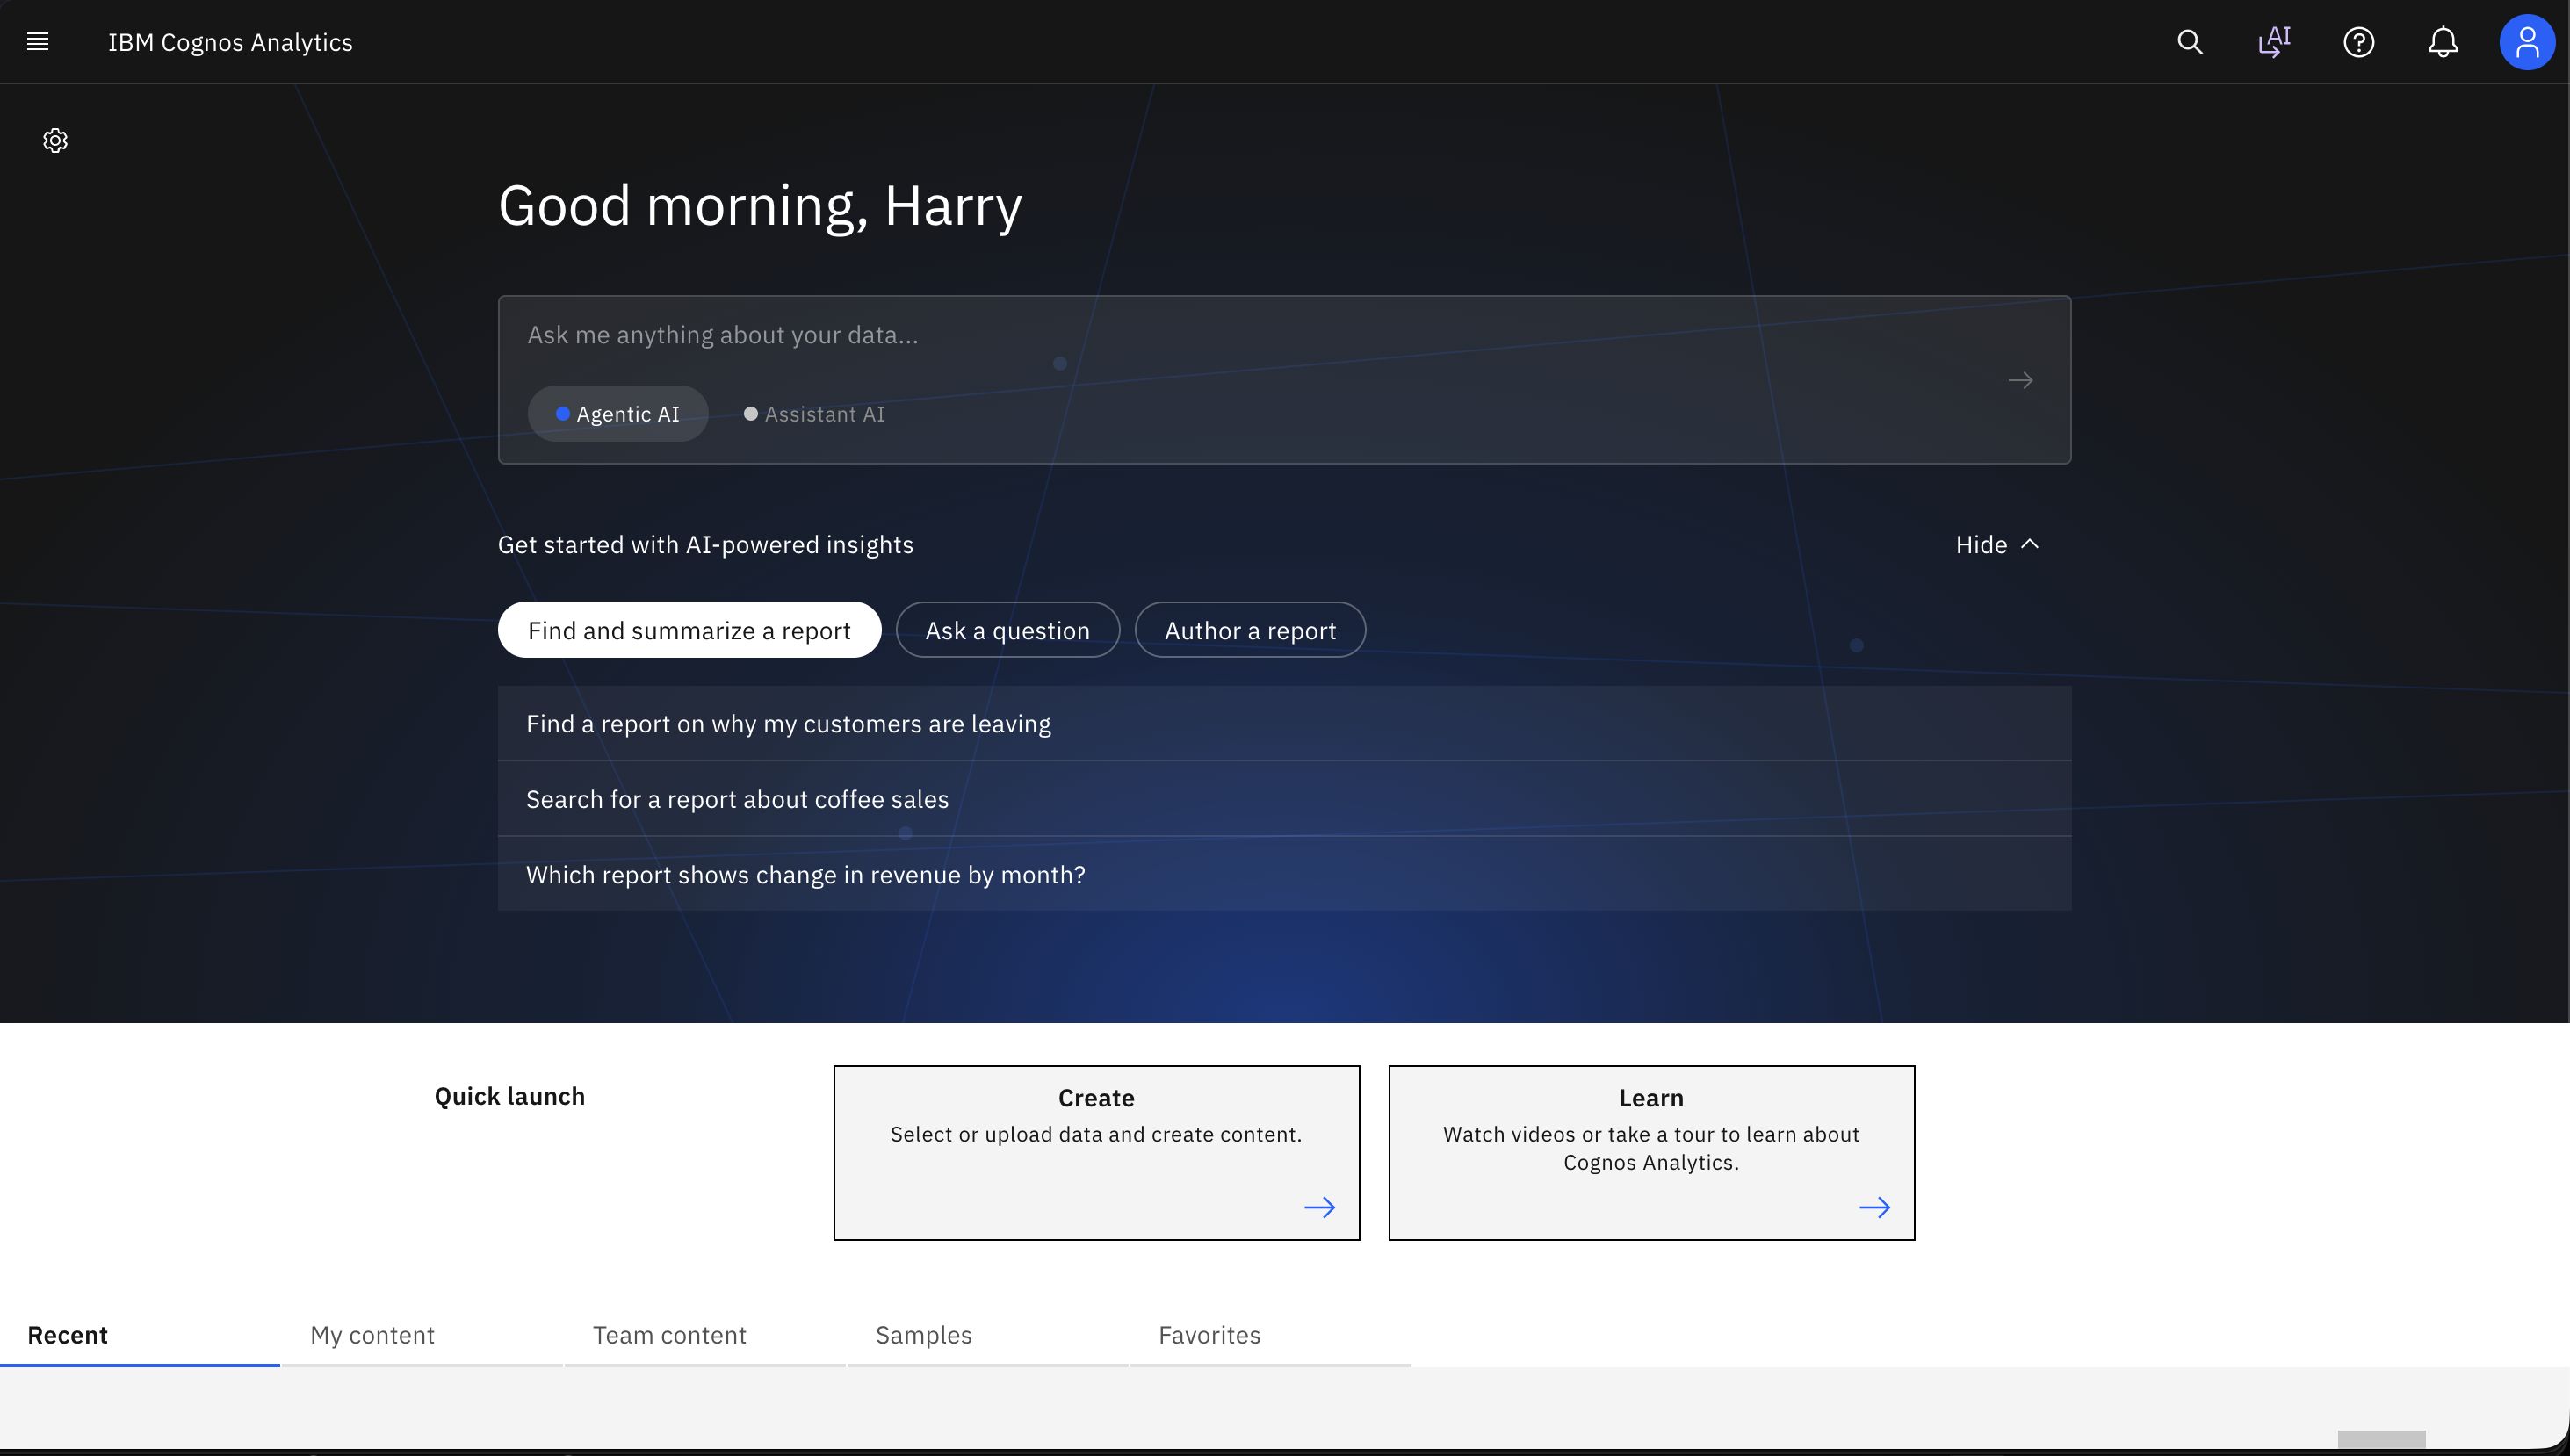
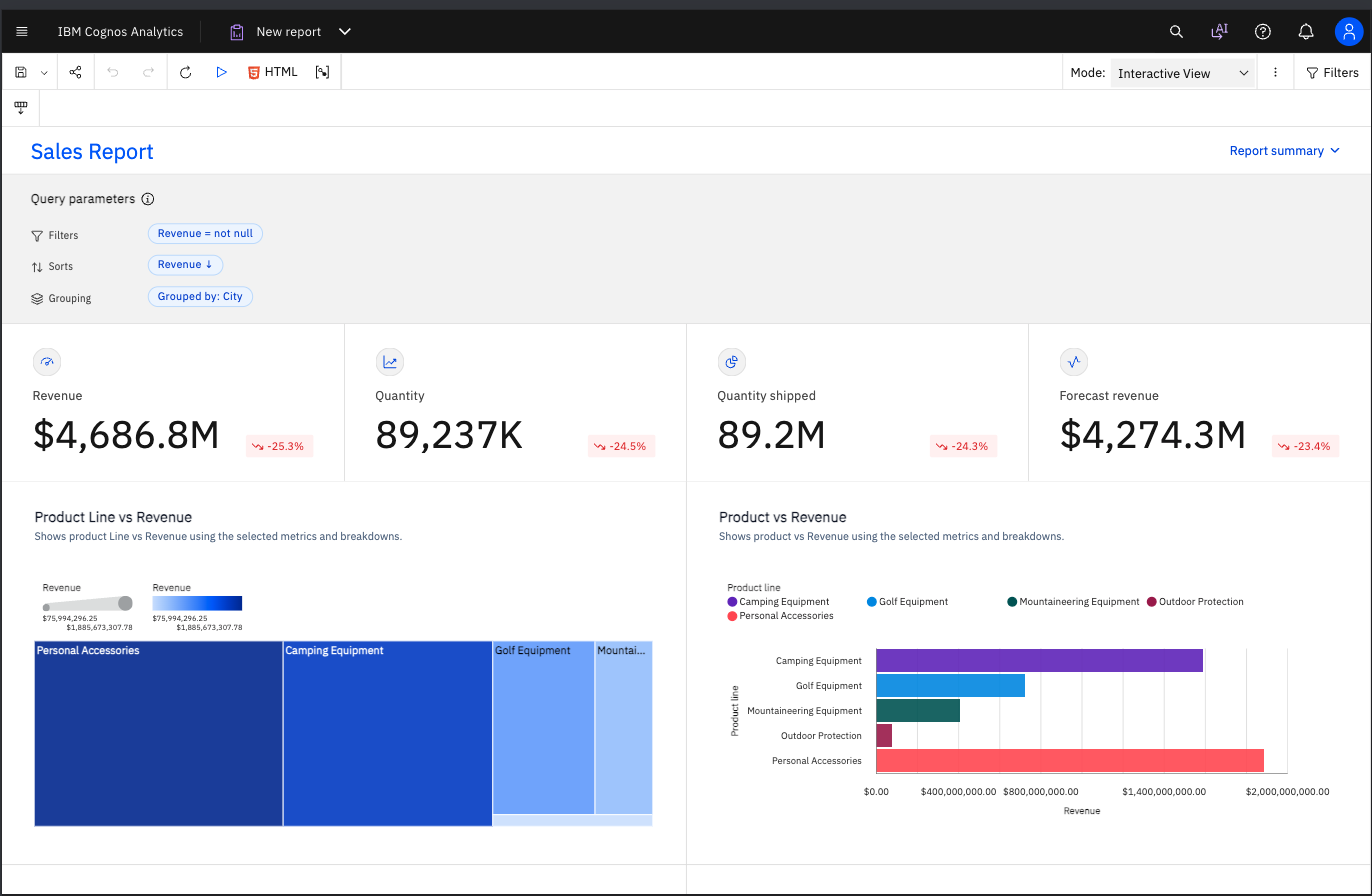
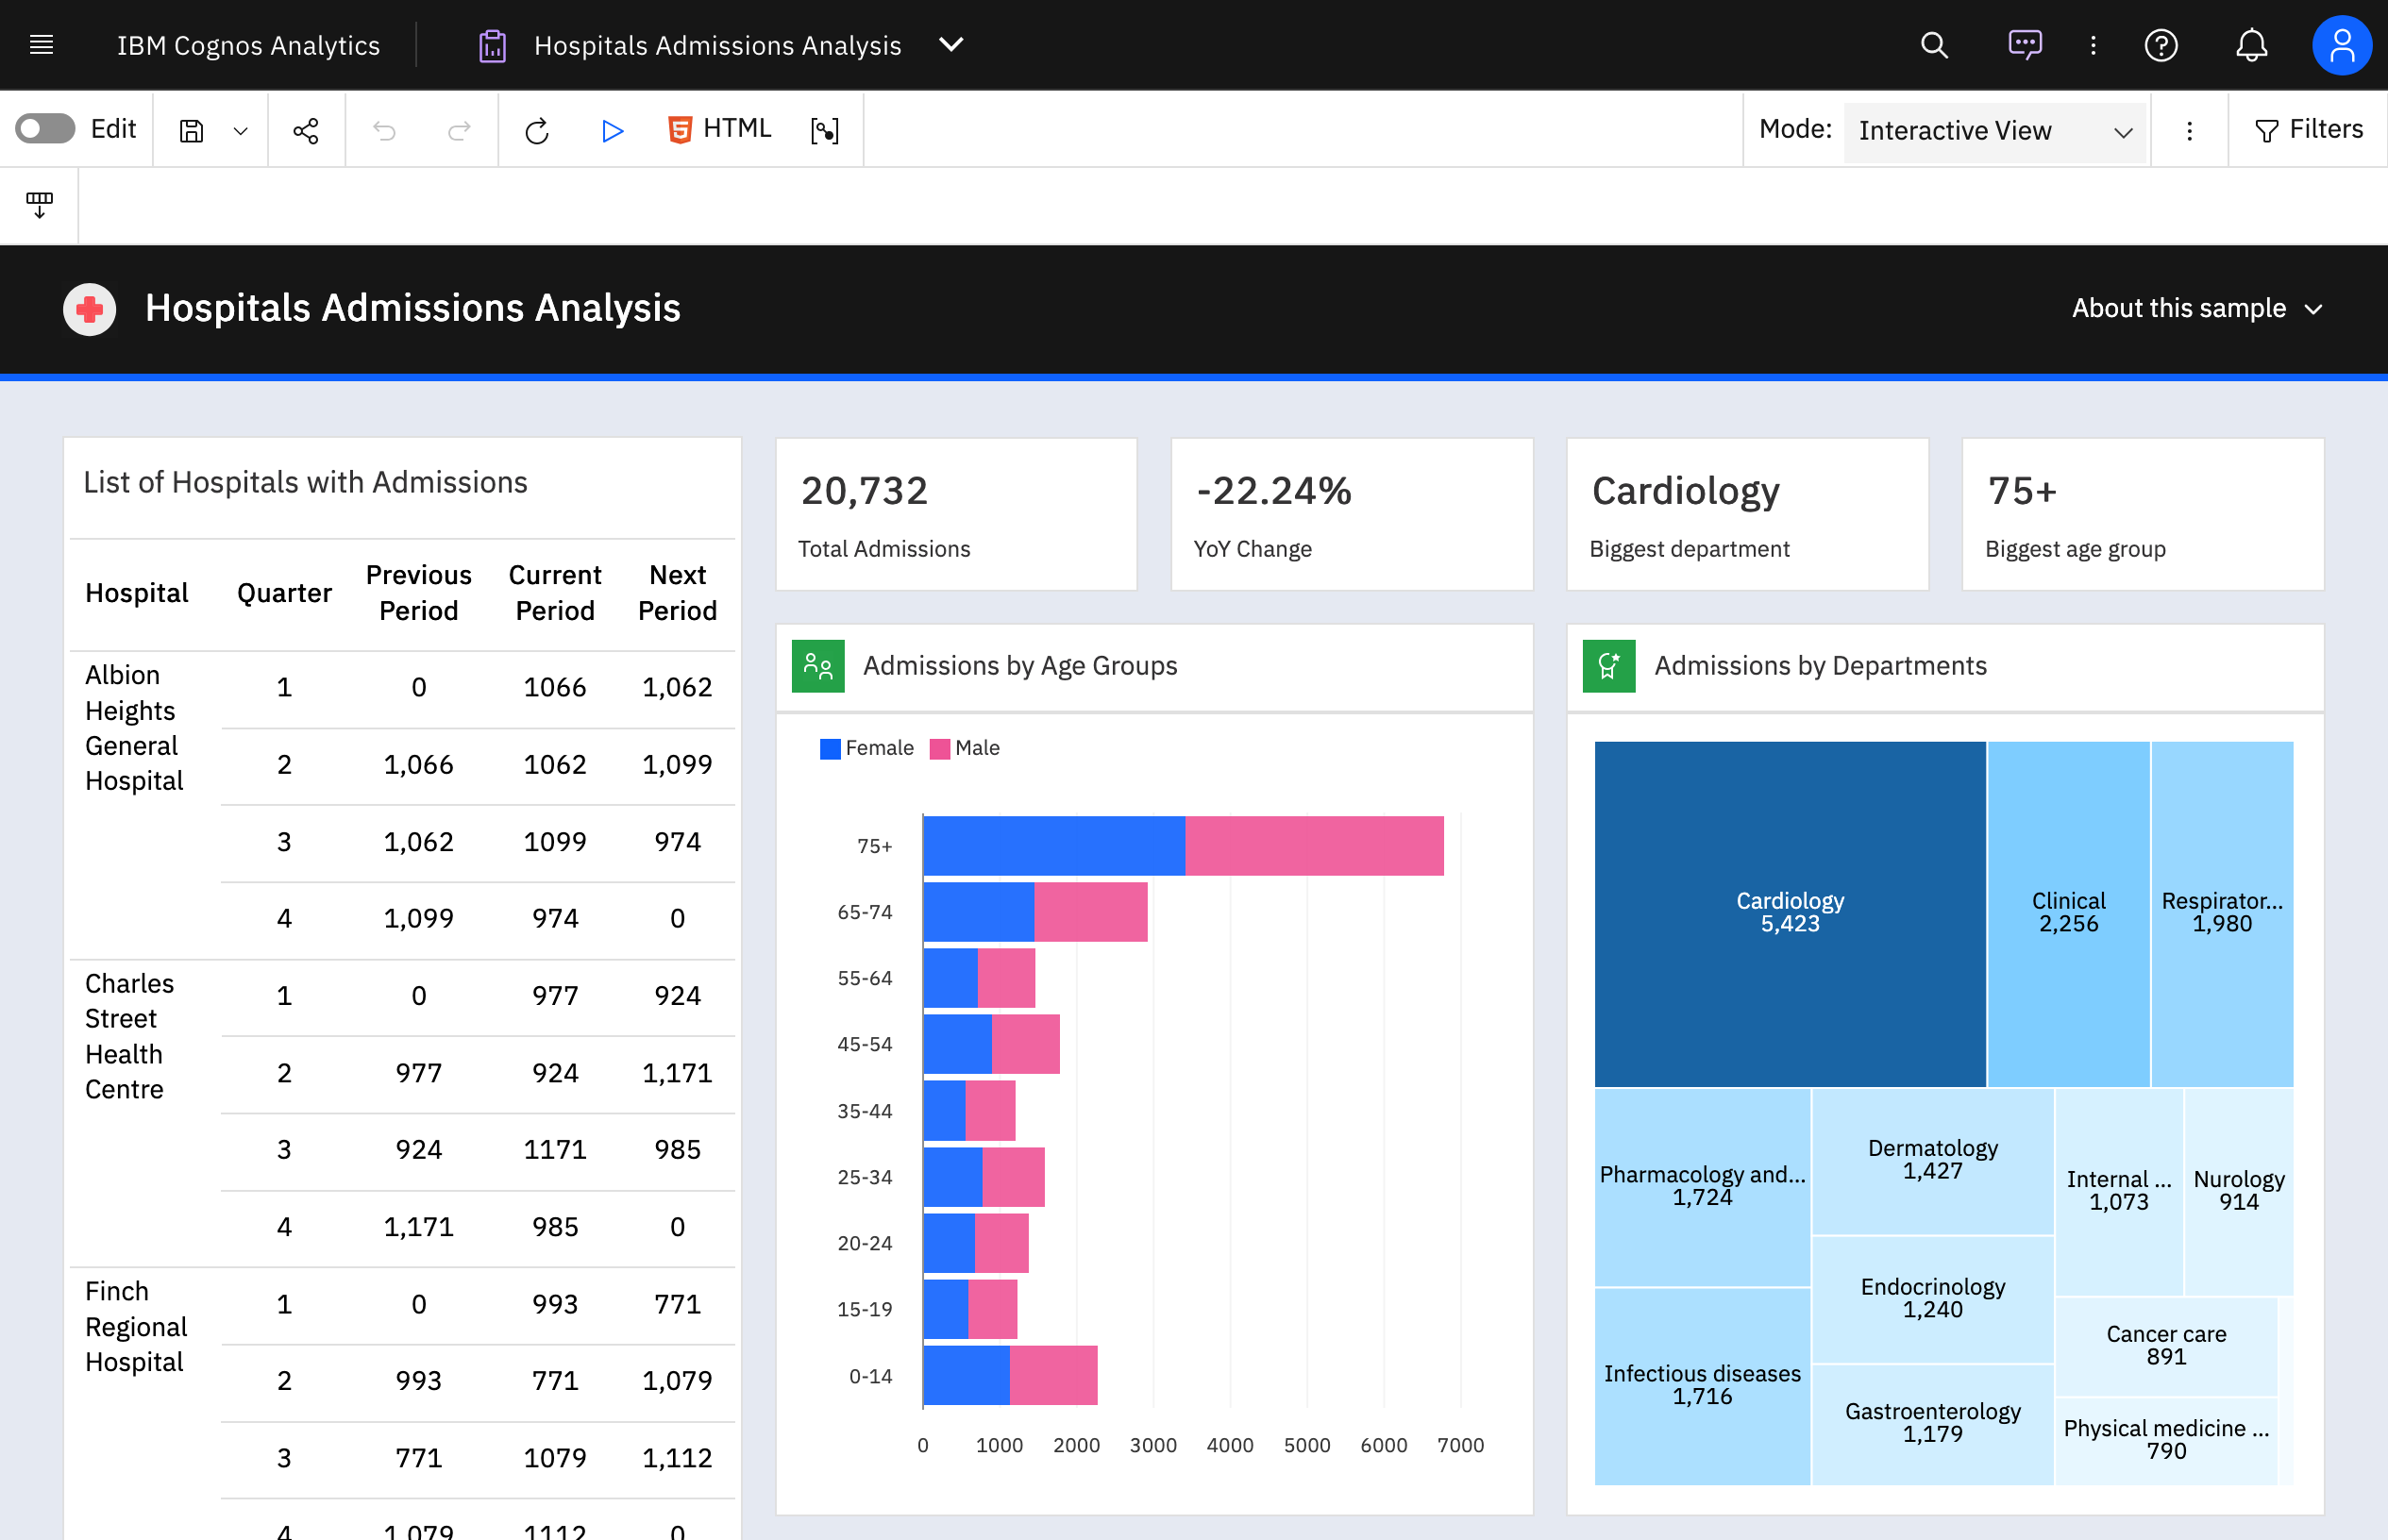
IBM Cognos is a full-featured business intelligence suite by IBM, designed for larger deployments. It comprises Query Studio, Reporting Studio, Analysis Studio and Event Studio, and Cognos Administration along with tools for Microsoft Office integration, full-text search, and dashboards.
$11.25
per month per user
IBM SPSS Statistics
Score8.1 out of 10
N/A
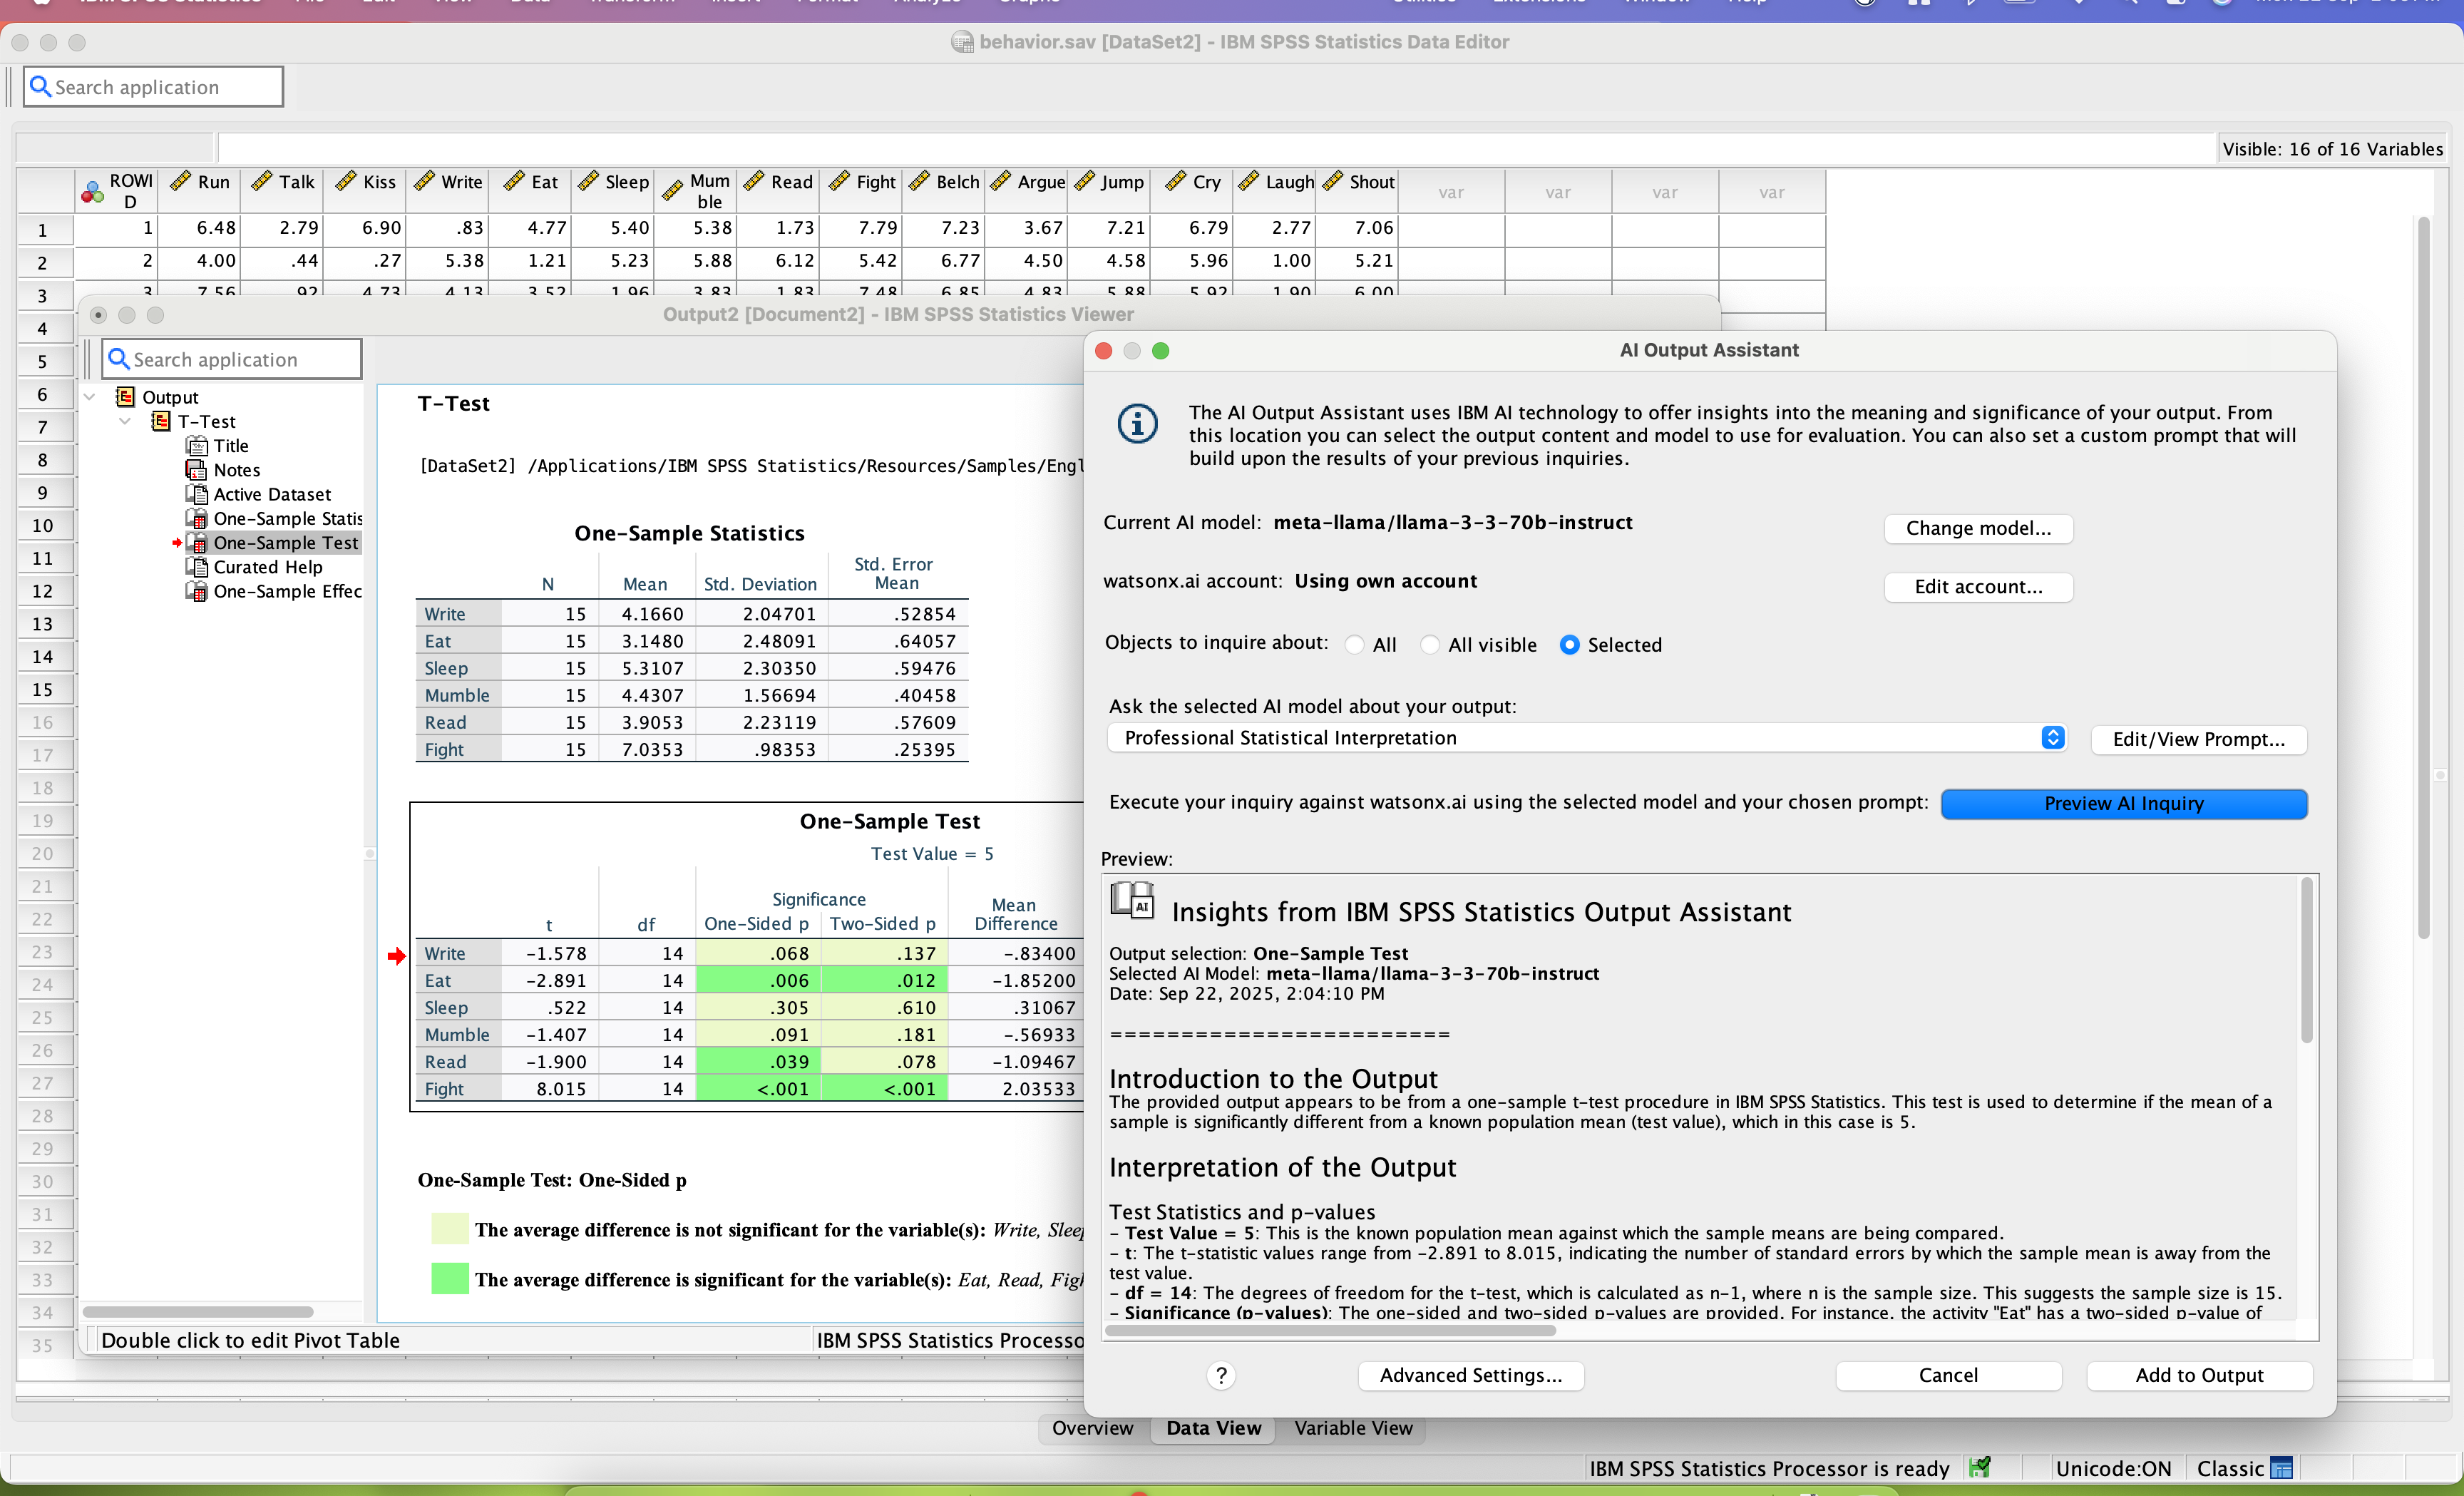
SPSS Statistics is a software package used for statistical analysis. It is now officially named "IBM SPSS Statistics". Companion products in the same family are used for survey authoring and deployment (IBM SPSS Data Collection), data mining (IBM SPSS Modeler), text analytics, and collaboration and deployment (batch and automated scoring services).
Data Analyst and Risk Assessor in Finance and Accounting at Banco Bci (Banking, 10,001+ employees)
Chose IBM Cognos Analytics
Tableau, Power BI, QlikView were the other options considered. Tableau lacked the following key components of business intelligence and analytics. Some other statistical functions that are available on the platform were not matched by Power BI. QlikView lacked robust …
A de minimis incentive was given to thank the reviewer for their time. The incentive was not used to bias or drive a particular response, nor was the incentive contingent on a positive endorsement. More Info
Verified User
Chose IBM Cognos Analytics
MS BI: A lot of times we meet customers who are dealing with an MS BI maintenance nightmare and we try to ease their pain by implementing Cognos BI and their reporting and analysis system. Cognos BI is better than MS BI from ease of implementation to production support and …
A de minimis incentive was given to thank the reviewer for their time. The incentive was not used to bias or drive a particular response, nor was the incentive contingent on a positive endorsement. More Info
President in Corporate at DataHub (Information Services, 11-50 employees)
Chose IBM SPSS Statistics
SAS is a very good product. SPSS provided our firm everythinbg we needed and was well within our budget. Also know that IBM is contunusely investing into SPSS. The roadmaps looks good.
A de minimis incentive was given to thank the reviewer for their time. The incentive was not used to bias or drive a particular response, nor was the incentive contingent on a positive endorsement. More Info
For Transaction monitoring, we build reports for executive management, providing insights into the number of alerts, the types or categories of detection scenarios, the risk profile, and a snapshot of high- or urgent-priority cases to be reported to AUSTRAC. Congos helps to build the report by ingesting alert data exported from SAS datasets. It joins with other data from Teradata and Customer Hub (Oracle).
A de minimis incentive was given to thank the reviewer for their time. The incentive was not used to bias or drive a particular response, nor was the incentive contingent on a positive endorsement. More Info
IBM SPSS Statistics is well suited for pretty much any data analytic scenario. It can handle extremely complex and large-scale datasets with ease. It especially shines if you have to do any kind of analyses that involve significance testing. Being able to do any number of significance tests (i.e., t-tests, chi-square, ANOVAs, etc.) right inside the tool is very valuable. The only scenario I would say it is less appropriate is if you need to work on a very small dataset and answer very simple questions, like frequencies or averages. In those cases, something like Excel could probably do the job just as easily.
A de minimis incentive was given to thank the reviewer for their time. The incentive was not used to bias or drive a particular response, nor was the incentive contingent on a positive endorsement. TR verified that a representative sample of customers was invited. More Info
Enterprise reporting - Create, customise, and run reports on sales trends, consumer sentiment, etc.
Dashboard creation and data exploration & analysis - Using drag and drop feature to create ad-hoc visualisation. Additionally, using AI powered natural language query feature for data analysis and dashboard input (formation of pie, bar, line charts). It's useful for no-technical person to put queries around the spreadsheet data to get quick answers.
Building insights for accurate decision making - Package reports with data backed insights for stakeholders in pdf, and Excel format to support business ad-hoc cases, forecasting and strategic recommendations on relevant asks.
A de minimis incentive was given to thank the reviewer for their time. The incentive was not used to bias or drive a particular response, nor was the incentive contingent on a positive endorsement. More Info
SPSS has been around for quite a while and has amassed a large suite of functionality. One of its longest-running features is the ability to automate SPSS via scripting, AKA "syntax." There is a very large community of practice on the internet who can help newbies to quickly scale up their automation abilities with SPSS. And SPSS allows users to save syntax scripting directly from GUI wizards and configuration windows, which can be a real life-saver if one is not an experienced coder.
Many statistics package users are doing scientific research with an eye to publish reproducible results. SPSS allows you to save datasets and syntax scripting in a common format, facilitating attempts by peer reviewers and other researchers to quickly and easily attempt to reproduce your results. It's very portable!
SPSS has both legacy and modern visualization suites baked into the base software, giving users an easily mountable learning curve when it comes to outputting charts and graphs. It's very easy to start with a canned look and feel of an exported chart, and then you can tweak a saved copy to change just about everything, from colors, legends, and axis scaling, to orientation, labels, and grid lines. And when you've got a chart or graph set up the way you like, you can export it as an image file, or create a template syntax to apply to new visualizations going forward.
SPSS makes it easy for even beginner-level users to create statistical coding fields to support multidimensional analysis, ensuring that you never need to destructively modify your dataset.
In closing, SPSS's long and successful tenure ensures that just about any question a new user may have about it can be answered with a modicum of Google-fu. There are even several fully-fledged tutorial websites out there for newbie perusal.
A de minimis incentive was given to thank the reviewer for their time. The incentive was not used to bias or drive a particular response, nor was the incentive contingent on a positive endorsement. More Info
IBM Cognos Analytics enables customer data segmentation, which is essential for marketing, improving and streamlining purchasing behavior and preferences. This helps companies create more targeted and effective marketing campaigns.
Our clients Through data analysis, we can identify and observe trends in the behavior of other clients, allowing us to anticipate needs and adjust strategies to avoid consequences.
A de minimis incentive was given to thank the reviewer for their time. The incentive was not used to bias or drive a particular response, nor was the incentive contingent on a positive endorsement. TR verified that a representative sample of customers was invited. More Info
Availability of procedures in the base package seems to be dwindling.
The copy-and-paste function from output to Excel is not as easy as it once was (now I have to do a "paste special").
Text and date handling are terrible.
Need to include AI-based NLP for survey verbatims and other text-based fields. This is becoming increasingly important in the CX world, yet SPSS seems to be ignoring it.
A de minimis incentive was given to thank the reviewer for their time. The incentive was not used to bias or drive a particular response, nor was the incentive contingent on a positive endorsement. More Info
For an existing solution, renewing licenses does provide a good return on investment. Additionally, while rolling out scorecards and dashboards with little adhoc capabilities, to end users, cognos is very easily scalable. It also allows to create a solution that has a mix of OLAP and relational data-sources, which is a limitation with other tools. Synchronizing with existing security setup is easy too.
Both money and time are essential for success in terms of return on investment for any kind of research based project work. Using a Likert-scale questionnaire is very easy for data entry and analysis using IBM SPSS. With the help of IBM SPSS, I found very fast and reliable data entry and data analysis for my research. Output from SPSS is very easy to interpret for data analysis and findings
A de minimis incentive was given to thank the reviewer for their time. The incentive was not used to bias or drive a particular response, nor was the incentive contingent on a positive endorsement. More Info
We have a strong user base (3500 users) that are highly utilizing this tool. Basic users are able to consume content within the applied security model. We have a set of advanced users that really push the limits of Cognos with Report and Query Studio. These users have created a lot of personal content and stored it in 'My Reports'. Users enjoy this flexibility.
Probably because I have been using it for so long that I have used all of the modules, or at least almost all of the modules, and the way SPSS works is second nature to me, like fish to swimming.
A de minimis incentive was given to thank the reviewer for their time. The incentive was not used to bias or drive a particular response, nor was the incentive contingent on a positive endorsement. More Info
Reports can typically be viewed through any browser that can access the server, so the availability is ultimately up to what the company utilizing it is comfortable with allowing, though report development tends to be more picky about browsers and settings as mentioned above. It also has an optional iPad app and general mobile browsing support, but dashboards lack the mobile compatibility. What keeps it from getting a higher score is the desktop tools that are vital to the development process. The compatibility with only Windows when the server has a wide range of compatibility can be a real sore point for a company that outfits its employees exclusively with Mac or Linux machines. Of course, if they are planning on outsourcing the development anyways, it's a rather moot point
A de minimis incentive was given to thank the reviewer for their time. The incentive was not used to bias or drive a particular response, nor was the incentive contingent on a positive endorsement. More Info
Overall no major complaints but it doesn't handle DMR (Dimensionally Modeled for Relational) very well. DMR modelling is a capability that IBM Cognos Framework Manager provides allowing you to specify dimensional information for relational metadata and allows for OLAP-style queries. However, the capability is not very efficient and, for example, if I'm using only 2 columns on a 20-column model, the software is not smart enough to exclude 18 columns and the query side gets progressively larger and larger until it's effectively unusable.
A de minimis incentive was given to thank the reviewer for their time. The incentive was not used to bias or drive a particular response, nor was the incentive contingent on a positive endorsement. More Info
Why is their web application not working as fast as you think it should? They never know, and it is always a a bunch of shots in the dark to find out. Trying to download software from them is like trying to find a book at the library before computers were invented.
A de minimis incentive was given to thank the reviewer for their time. The incentive was not used to bias or drive a particular response, nor was the incentive contingent on a positive endorsement. More Info
I have not contacted IBM SPSS for support myself. However, our IT staff has for trying to get SPSS Text Analytics Module to work. The issue was never resolved, but I'm not sure if it was on the IT's end or on SPSS's end
Onsite training provided by IBM Cognos was effective and as expected. They did not perform training with our data which was a bit difficult for our end-users.
The online courses they offer are thorough and presented in such a way that someone who isn't already familiar with the general design methodologies used in this field will be capable of making a good design. The training environments are provided as a fully self contained virtual machine with everything needed already to create the environments. We've had some persisting issues with the environments becoming unavailable, but support has been responsive when these issues arise and straightening them out for us
Make sure that any custom tables that you have, are built into your metadata packages. You can still access them via SQL queries in Cognos, but it is much easier to have them as a part of the available metadata packages.
Have a plan for managing the yearly upgrade cycle. Most users work in the desktop version, so there needs to be a mechanism for either pushing out new versions of the software or a key manager to deal with updated licensing keys. If you have a lot of users this needs to be planned for in advance.
A de minimis incentive was given to thank the reviewer for their time. The incentive was not used to bias or drive a particular response, nor was the incentive contingent on a positive endorsement. More Info
Power BI is stronger for quick ad-hoc analysis and dashboards, but IBM Cognos Analytics is better when consistency, precision, and mass distribution matter. Tableau is best for interactive analysis, while IBM Cognos Analytics is better for standardized, repeatable enterprise reporting. Sigma shines for customizable dashboards and drill-down analysis while IBM Cognos Analytics holds an edge in data discovery and visualization.
A de minimis incentive was given to thank the reviewer for their time. The incentive was not used to bias or drive a particular response, nor was the incentive contingent on a positive endorsement. TR verified that a representative sample of customers was invited. More Info
If you have made it this far, you should have a very good idea of how SPSS stacks up the competition (data processing and analytics tools). Even the free ones, such as r Studio or Stata, are leaps and bounds ahead of SPSS. IBM is resting on a reputation developed nearly 30 years ago and has shown no desire to improve.
A de minimis incentive was given to thank the reviewer for their time. The incentive was not used to bias or drive a particular response, nor was the incentive contingent on a positive endorsement. TR verified that a representative sample of customers was invited. More Info
We rate IBM Cognos Analytics a 9 out of 10 for overall scalability. The platform handles large numbers of users, reports, and analytical workloads very reliably. We have experienced strong performance even in demanding enterprise environments with substantial data volumes. Its architecture provides sufficient flexibility to scale resources according to demand, making it well suited for large, business-critical deployments.
A de minimis incentive was given to thank the reviewer for their time. The incentive was not used to bias or drive a particular response, nor was the incentive contingent on a positive endorsement. More Info
A de minimis incentive was given to thank the reviewer for their time. The incentive was not used to bias or drive a particular response, nor was the incentive contingent on a positive endorsement. More Info
A de minimis incentive was given to thank the reviewer for their time. The incentive was not used to bias or drive a particular response, nor was the incentive contingent on a positive endorsement. TR verified that a representative sample of customers was invited. More Info
I found SPSS easier to use than SAS as it's more intuitive to me.
The learning curve to use SPSS is less compared to SAS.
I used SAS, to a much lesser extent than SPSS. However, it seems that SAS may be more suitable for users who understand programming. With SPSS, users can perform many statistical tests without the need to know programming.
A de minimis incentive was given to thank the reviewer for their time. The incentive was not used to bias or drive a particular response, nor was the incentive contingent on a positive endorsement. TR verified that a representative sample of customers was invited. More Info