Instana, an IBM company since the December 2020 acquisition, provides APM services for SOA, microservices, containerized applications and Kubernetes, and cloud native applications, as well as discovery and monitoring for IT assets.
$75
per month per Managed Virtual Server (MVS)
NetApp Cloud Insights
Score 9.2 out of 10
N/A
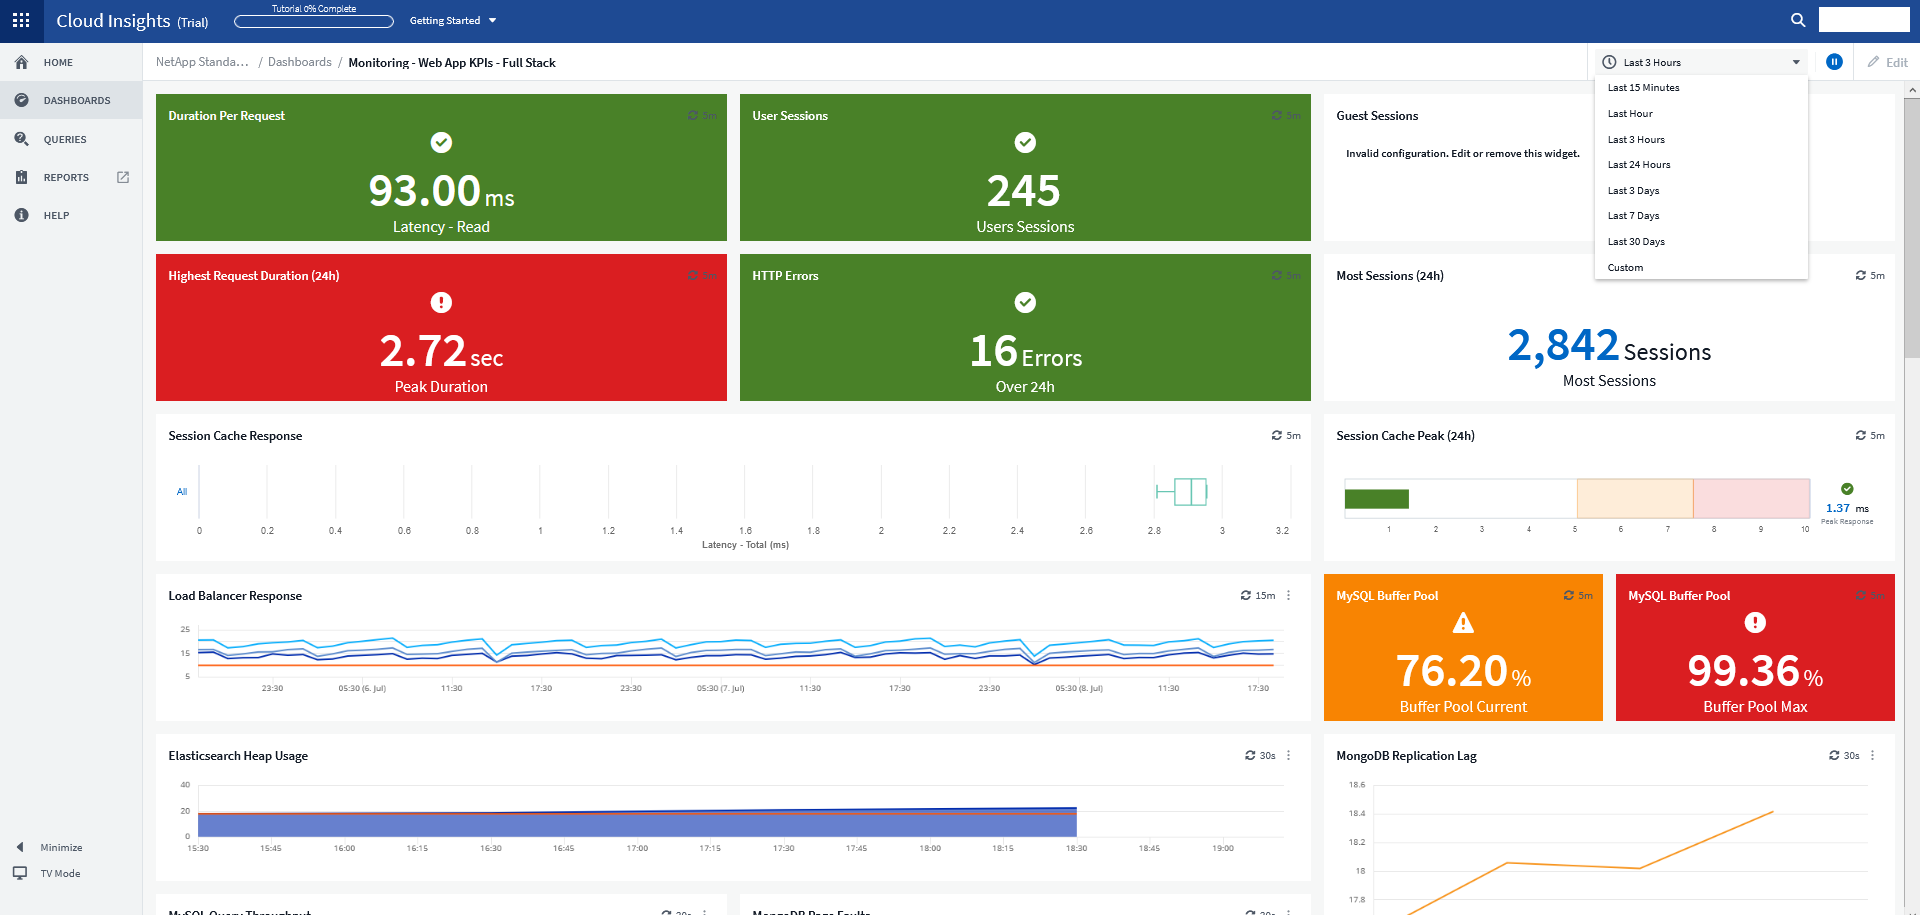
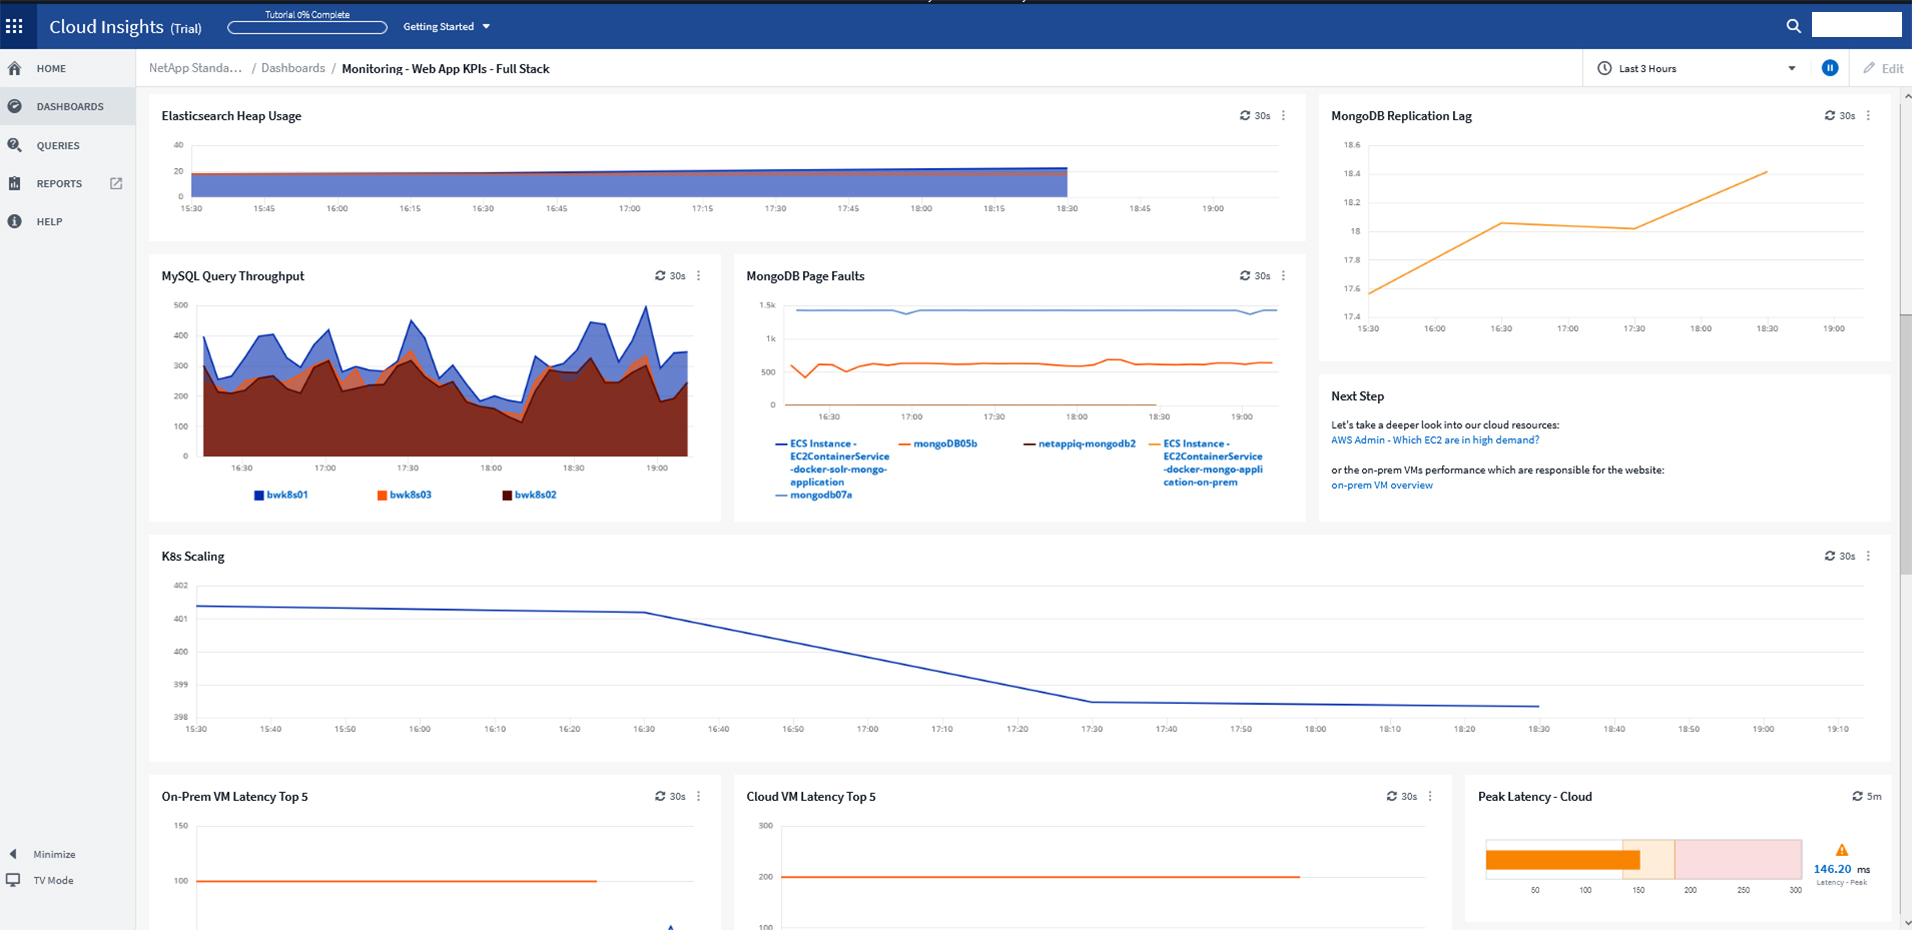
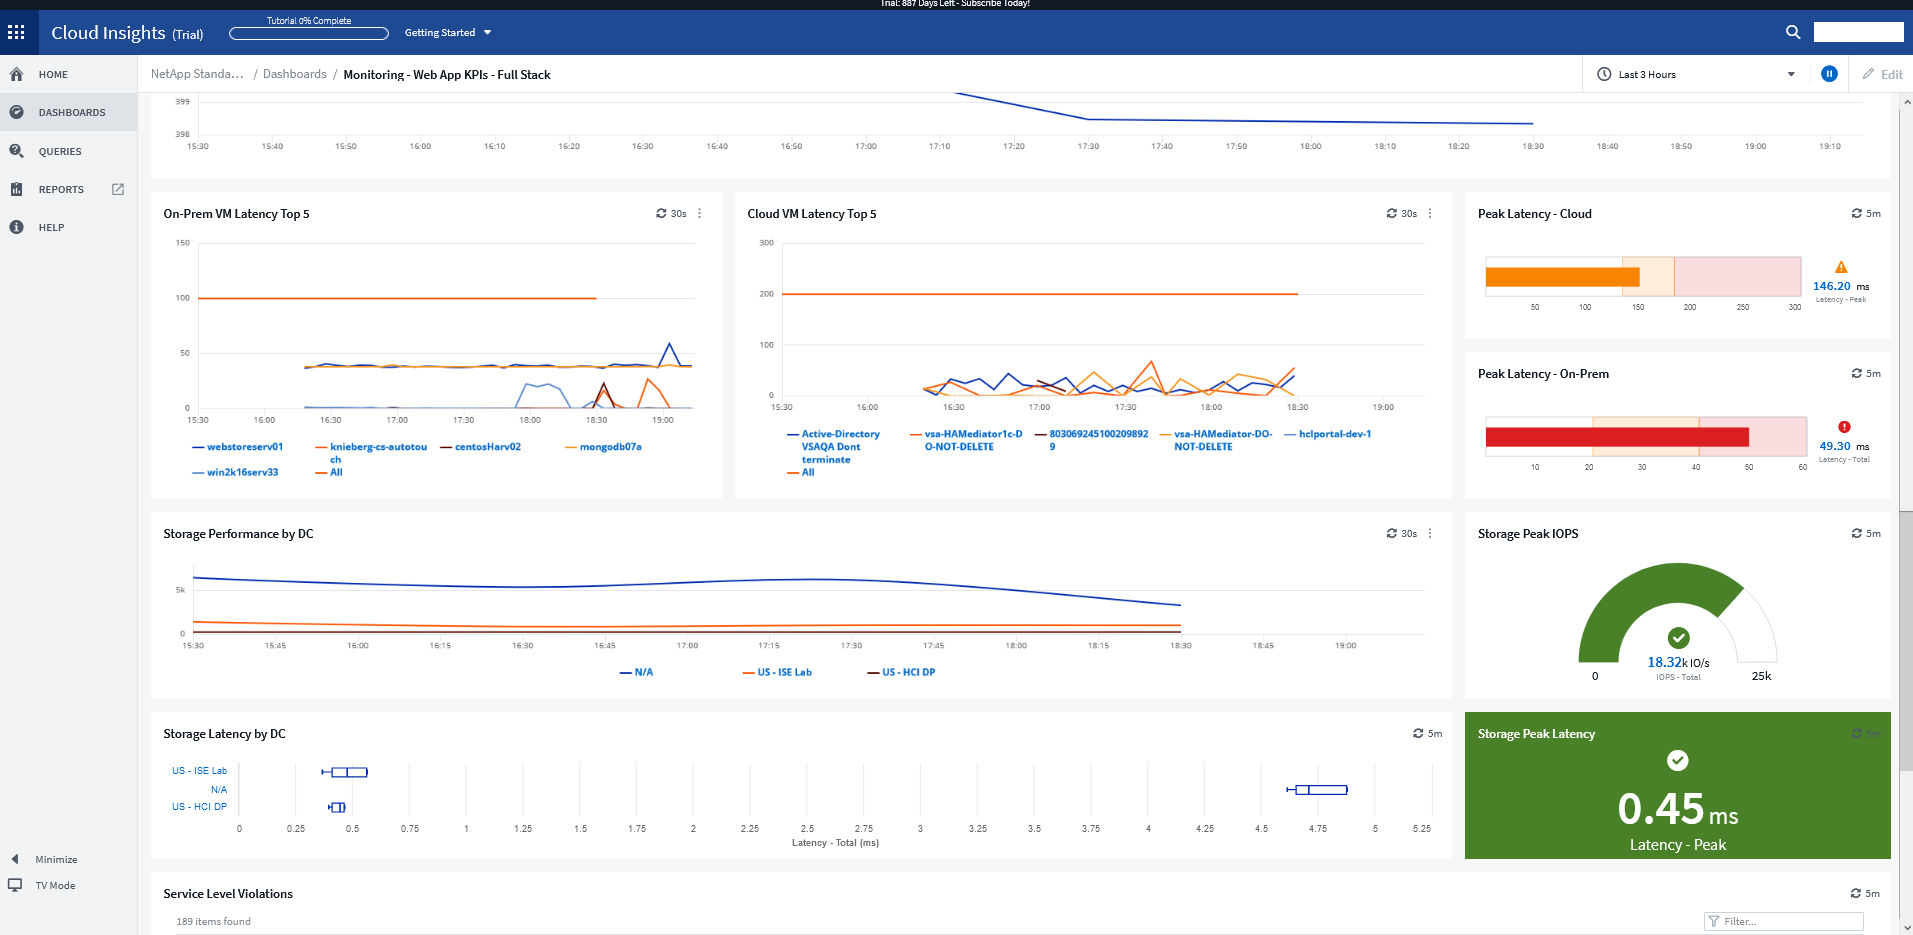
NetApp Cloud Insights is an infrastructure monitoring tool that gives
users visibility into their complete infrastructure. With Cloud Insights, users can monitor, troubleshoot and optimize all resources including
public clouds and private data centers.
With enterprise IT assets in a multitude of ecosystems, cloud infrastructures and sometimes still left stuck in a legacy on prem architecture, IBM Instana makes it easy to get the right data to drive development and / or DevSecOps processes with tangible input from the target environment itself.
For example, we had an application slowdown. It looked like the slowdown was storage. However, it was a malformed SQL query that no one realized was pulling data from the storage location that also housed the application. Cloud Insights saved us hours of downtime and frustration. Cloud Insights pinpointed which system was hogging resources. What makes Cloud Insights special is the way it looks at the data collected from the data sources. The insights it provides into the flow of data; sheds new light on how things work in your environment.
Can monitor application(s) and system(s) with very large throughput of transactions by the second ( it gets everything !!!)
Provide strong drill down for your applications and will tell you where the points of failure of an application's is ( servers , network , Databases , etc you name it )
Very easy to set up and have it up and running when using the SaaS solution. There's an on premise solution which works just as well but requires more effort and preparation from an infrastructure point of view for your teams to implement.
Continuously improve their features and their agents auto-update and keep up. All while not interfering with your applications.
Let's you create your own dashboards and visualizations that can be tailored for different kind of users with the data collected.
Create your own events and smart alerts so you can know on the spot if something is happening or is likely to happen that needs addressing on your applications / systems
It's very difficult to create custom dashboards, only a handful of scenarios can be visualized to dashboards.
Extracting information from Instana to further analysis into excel for example is something that can be improved. Using an API to get data is very limiting.
Open telemetry features which allow to send application data to Instana is not working as documented.
Instana has been able to fulfill our all requirement and provide out of box solution for multiple component like AWS RDS Monitoring and real time alerting setup on basis of that. it is also easy to integrate with other open-source alerting and monitoring tools which makes it easier to incorporate into our solutions
IBM Instana totally alters our monitoring approach since it increases the stability of the system and simplifies the process of problem solving. And since it helps to lower the degree of alert exhaustion that we experience, it is a total game changer for us.
I have been extremely happy with its usability. You can take thins as they are out of the box and it is useful. You can carry it as far as you want to go and every step you take improves your ROI.
Unlike the above-mentioned platforms, IBM Instana's real-time observability and multiple Cloud Application performance monitoring options are a productive, very impressive solution for tracing and detecting performance issues. Its root cause analytics production is a wonderful Cloud system with responsive, easy-to-use functions during initial configuration.
For a while, we were using Zabbix to monitor our Kubernetes applications and microservices on our infrastructure in more than one public cloud platform. Cloud Insights has much better visualized dashboards. In addition, despite such a large number of quality features, it's still priced competitively.
Once you install the acquisition unit and start collecting data, you can immediately begin using it. It is very self-explanatory and helpful. I could have used Cloud Insights without working with the NetApp Cloud Insights support team. I am glad I engaged them though. They helped me carry Cloud Insights to a new level and it fast-tracked the process that would have taken me time to complete.