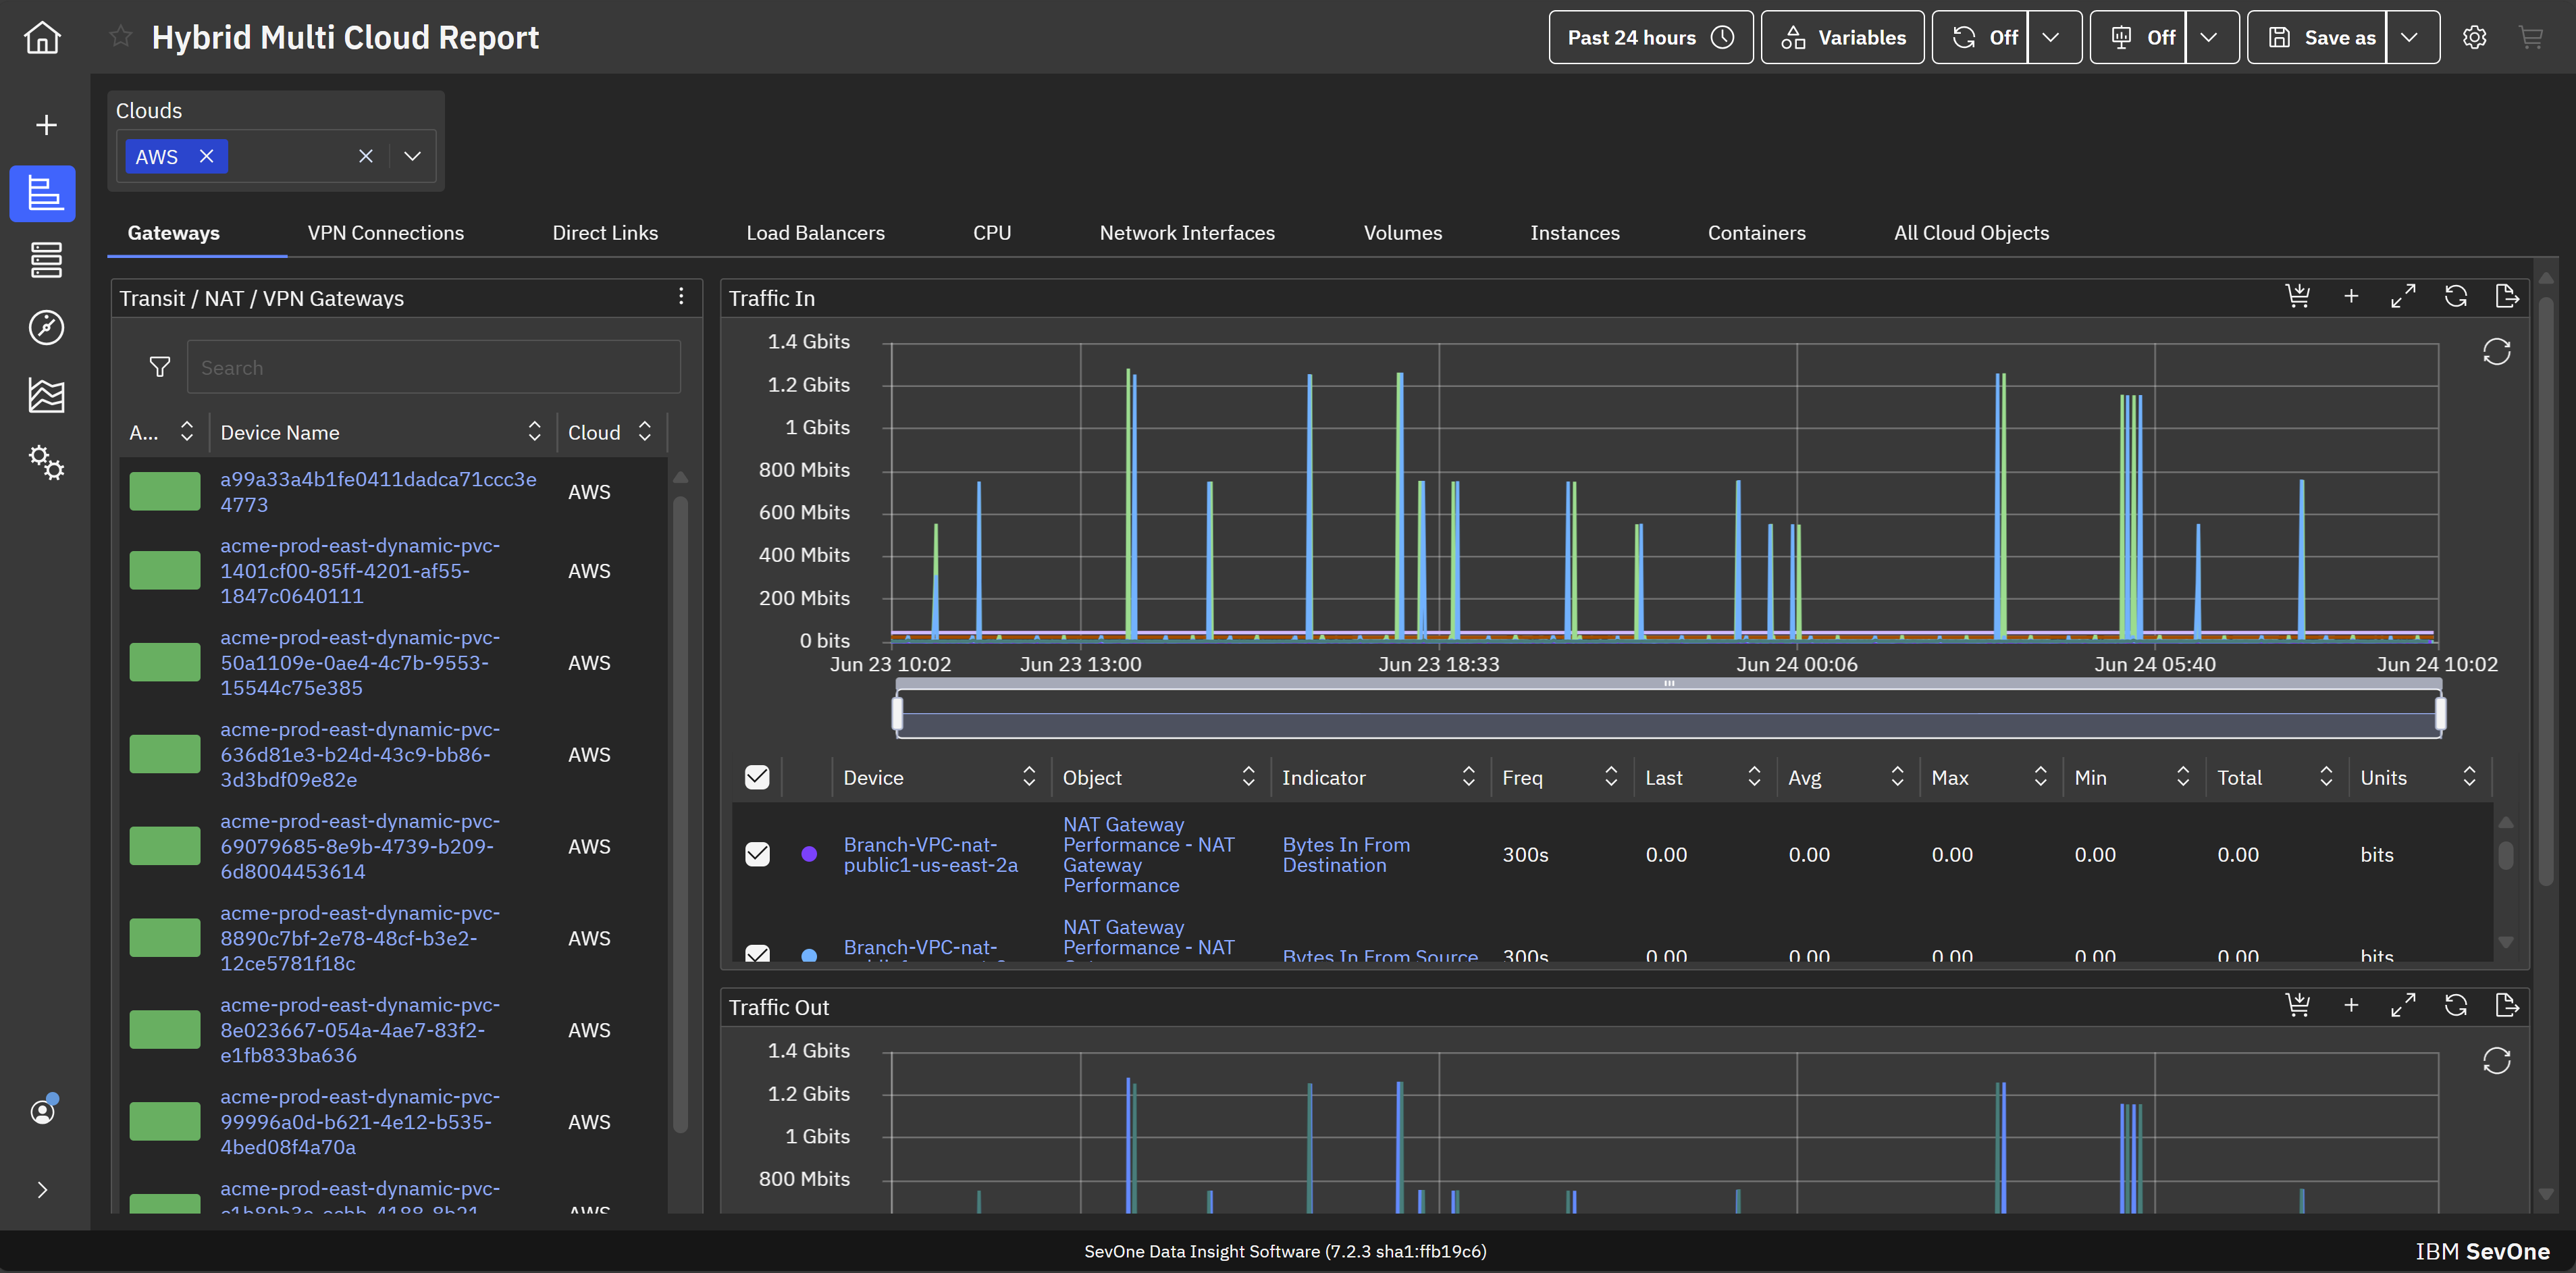
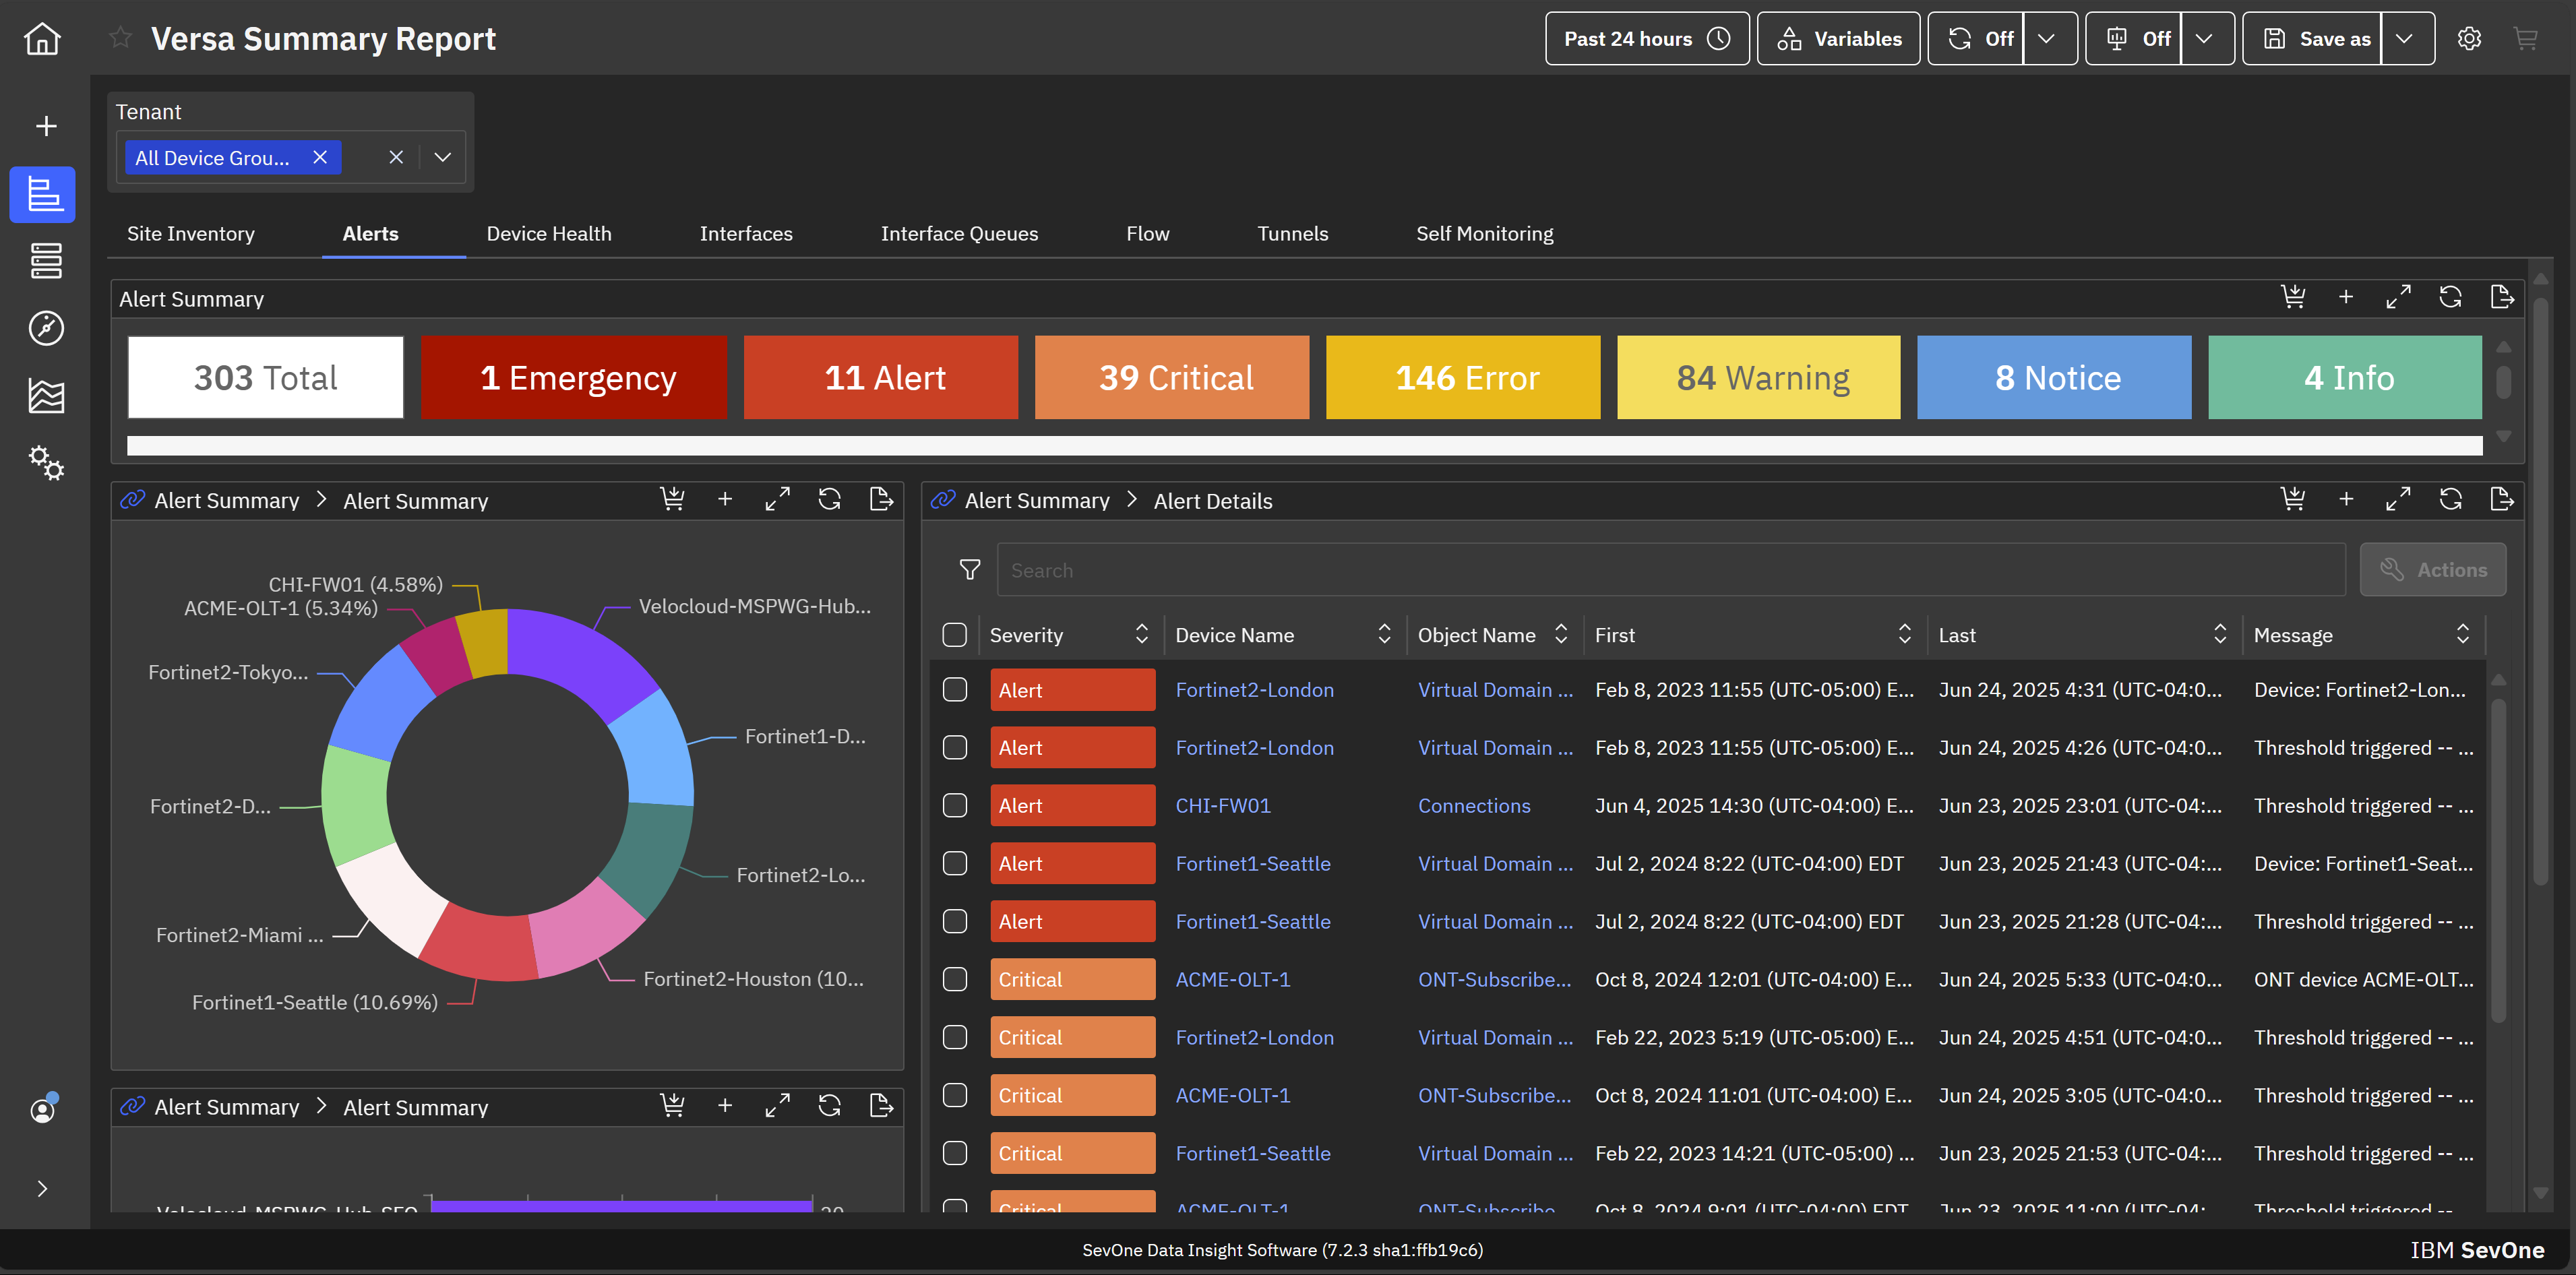
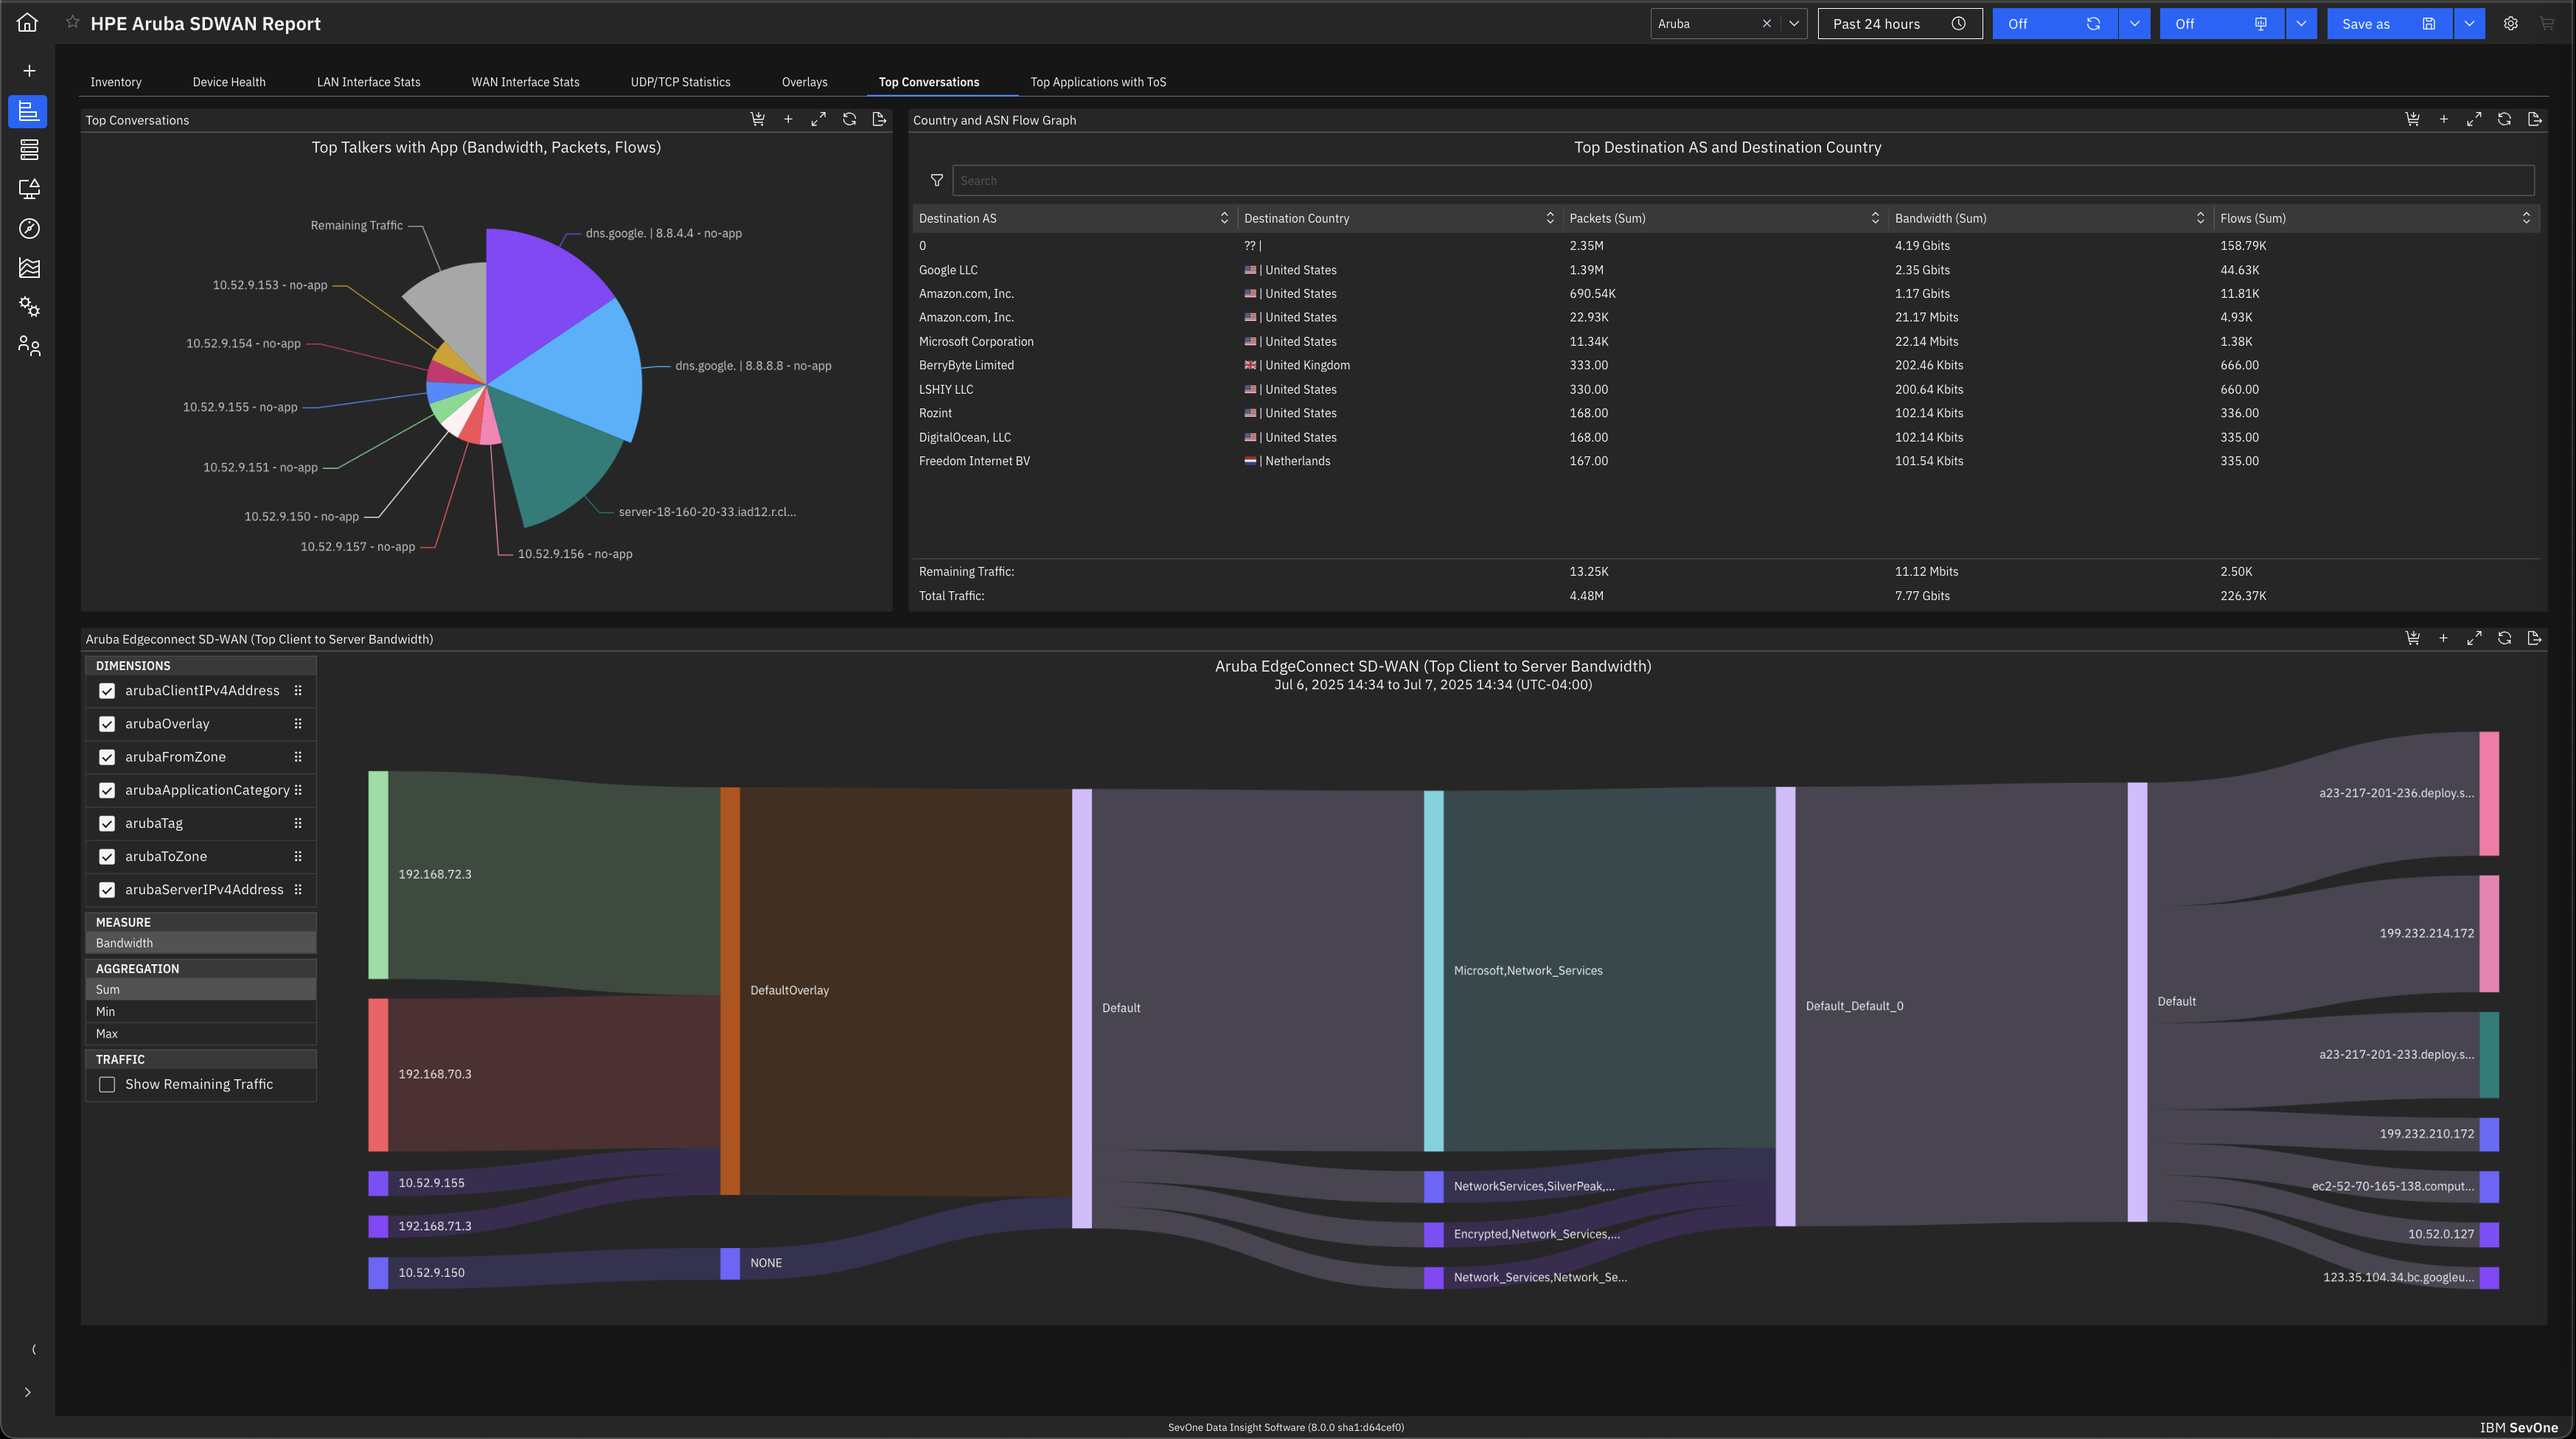
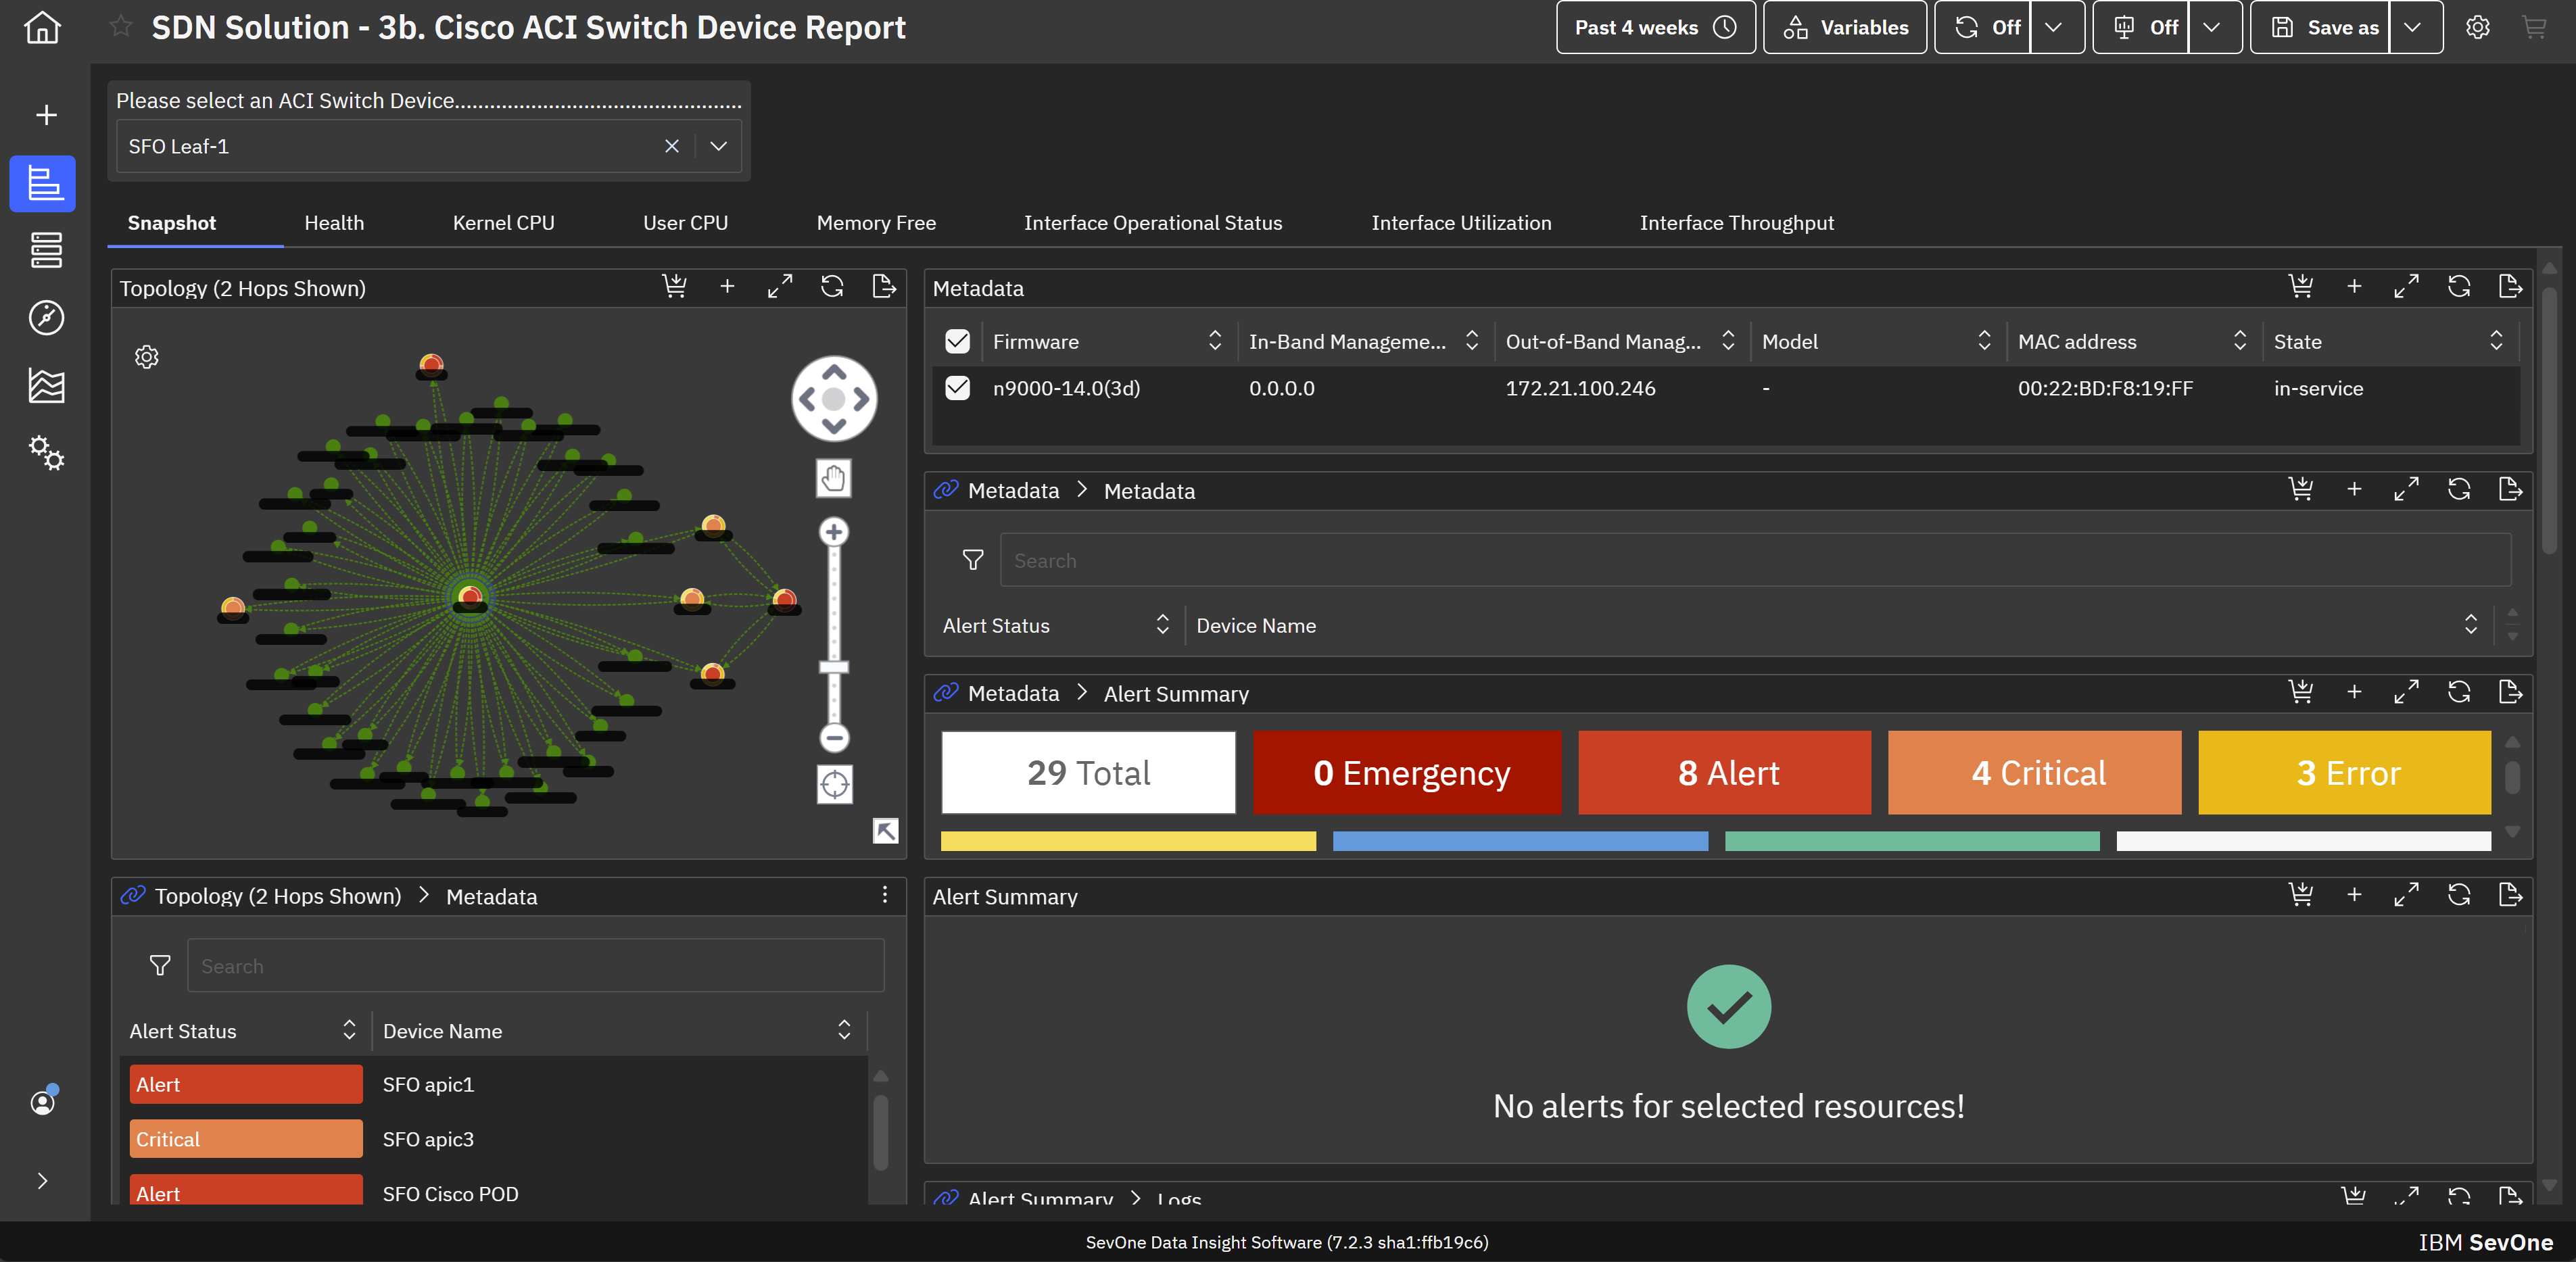
IBM SevOne’s app-centric, hybrid network observability empowers NetOps teams with ML-driven insights, enabling proactive issue prevention and resolution. With a single source of truth for network performance, it delivers visibility to optimize operations and support agility in complex, multi-cloud environments.
N/A
PingPlotter
Score 8.8 out of 10
N/A
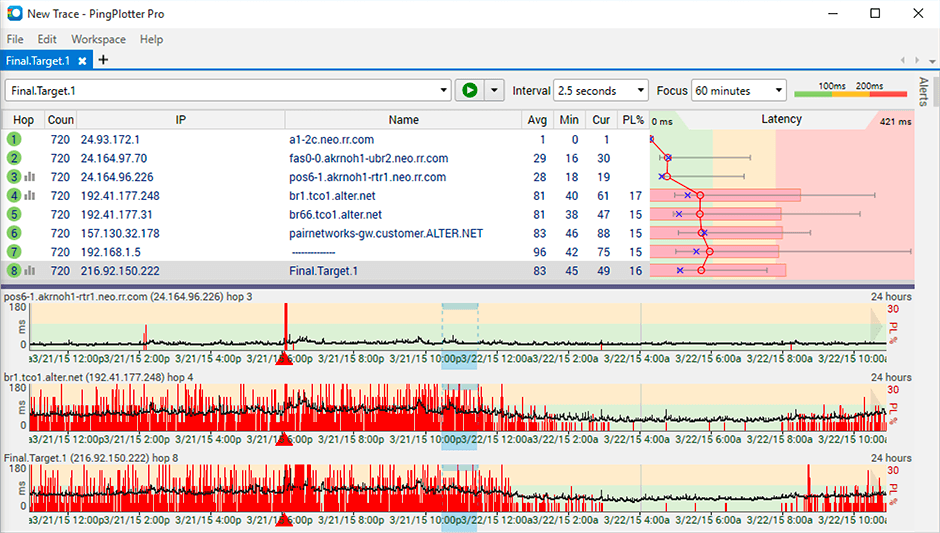
PingPlotter is a graphical traceroute and ping tool that visualizes network performance in a way that makes identifying the source of problems quicker and easier for everyone from online gamers and video streamers to VoIP admins and IT pros. Features for remote deployment, network monitoring, scripting, and a web interface are included along with several additional capabilities.
$0
per user
Pricing
IBM SevOne
PingPlotter
Editions & Modules
No answers on this topic
PingPlotter Free
$0.00
per user
PingPlotter Free
$0.00
per user
PingPlotter Standard
$6.99
per user per month
PingPlotter Professional
$29.00
per user per month
PingPlotter Standard
$39.99
per user
PingPlotter Professional
$349.00
per user
Offerings
Pricing Offerings
IBM SevOne
PingPlotter
Free Trial
No
Yes
Free/Freemium Version
No
Yes
Premium Consulting/Integration Services
No
No
Entry-level Setup Fee
No setup fee
No setup fee
Additional Details
IBM® SevOne® uses Managed Device (MD) and Managed Client Device (MCD) as pricing metrics. These can be mapped to managed devices for physical, virtualized and containerized functions in the managed environment.
—
More Pricing Information
Community Pulse
IBM SevOne
PingPlotter
Considered Both Products
IBM SevOne
Verified User
Anonymous
Chose IBM SevOne
IBM SevOne was selected instead of Datadog because it is perfect for large insurance networks and also connects trouble-free between the on-premise and cloud environments. Its alerts are in real-time, it offers comprehensive dashboards and it allows to gain a better grip on the …
Zabbix is very cost effective, good flexibility, easy to start and customizable. This is a plus compared to IBM SevOne. However it is more manual work, less polished user interface and may need more effort to handle larger networks. IBM Netcool has service provider network, …
May lack some of the advanced analytics, big-data scale, depth of historical performance, or baseline anomaly detection that SevOne provides. UI / advanced features are less polished. Datadog is strong in cloud-native, full-stack observability; good dashboards; good …
IBM SevOne provides a more robust visibility platform than Dynatrace as it relates to the network. While Dynatrace is a good product, it lacks the granularity that IBM SevOne brings straight out of the box! Also, observability and discover. Nothing is better than IBM SevOne.
SevOne is a good alternative to the products such as SolarWinds, MicroFocus, LogicMonitor and many more for network monitoring. It has certain unique features such as Fancy Dashboard and flexibility to visualize the information in terms of widgets and metrics. Out of the …
SevOne from Turbonomic is not as popular in network monitoring space as Solarwinds, MicroFocus, Broadcom etc. However, it is equally effective in monitoring. One unique feature that SevOne has over other software is that its framework is built on the latest technologies which …
I used Ping.app and UptimeLog.app on the Mac. These both provided different aspects. These two had a menubar to show me green or red for multiple connections. UptimeLog showed me very clearly when my connectivity was on or off and for exactly how long.
I've tried more products that are not in the list but PingPlotter is the easiest to use and the better one so far because of the interface and function.
PingPlotter has better visualizations and a stronger ability to capture historical data than other tools I've used. This makes it easier to find the root cause by looking back in the log data to find where latency or packet loss occurred.
A balance of a generic tool vs a network equipment product is necessary when investigating network incidents or disruptions. Need to train the engineer to use both tools to perform their analysis and to dive down to the issues as fast as they can. Experience with the tools will …
PingPlotter stacks up very well to Solarwinds NPM and can provide many of the same benchmark tests that Solarwinds can. PingPlotter is most certianly much better at doing Traceroutes than NPM, and you can run a lot of the same reports.
PingPlotter is a basic version of Auvik, although it is easier to setup and there is less intrusion in the customers network. This allows us to use PingPlotter as a prospecting tool and allows to accurately gather network information very quickly. Basic troubleshooting is great …
I have tried a few free products and some paid ones but never really did what I wanted. I just needed a simple, always-on link monitor specifically with a traceroute element and this is what PingPlotter delivers. The others were either overly complex or too expensive, some just …
IBM SevOne ensures deep performance and in depth monitoring and allows customization according to specific organisation or business needs. Availability of real-time alerts and unlimited customization. The software integrates freely with many third party applications and has reliable analytics and reporting systems. Ability of the software in automating routine network monitoring tasks which reduces operational costs. Software pricing is a major challenge towards smooth implementation of the software. It is expensive and not affordable to small businesses and organisations.
It is well suited for performing monitoring and testing from a single device. It is less appropriate if you have to monitor from multiple different endpoints. That type of deployment would be more of an enterprise application. If you are looking for an end user monitoring solution then PingPlotter is the one for you.
Documentation for the embedded help pages in NMS and more. In my opinion, these do not provide anything of any depth or maybe anything helpful at all. If anything it just seems to be a guide of what actually exists on the page. It is nicely searchable documentation though.
It is very surprising and disappointing for us to learn that it isn't until the latest version of IBM SevOne that bulk editing was introduced. I think this is such a basic and foundational feature that should have been a part of the original rollout. My team is still trying to configure the REST API.
It was disappointing for the webinar to start with a speaker who had a thick accent and simply read from slides. To me, it felt hopeless until the second speaker, who was engaging and easy to understand. It's as if this fact wasn't considered. I'm sure the first speaker lost a lot of viewers who didn't stick around to discover the 2nd speaker.
I asked three different questions during the webinar and none were answered.
Its a little confusing to see which targets are currently running pings and which ones are displayed in the plots.
Starting and stopping pings requires a right click and that would be better with a play/pause button I think.
Ability to drag and drop the graphs to reorder them.
more columns to show which targets are running and which are displayed. Currently this is done with symbols so you cant sort by just the running targets for example I've found.
I installed it and it just started working. I realized I could then tweak it to show what I needed but didn't have to spend a long time configuring it before use, editing YAML files etc. Maybe that's fine for a network professional, but I only need this software if something goes wrong, and then need it to work quickly out of the box.
I have not had much contact with the PingPlotter support, only one time have I went to them and it was a positive experience. The questions I had were answered quickly and professionally. I have no issue with the experience I had with the Support team. This was from before and after the purchase of the product.
IBM SevOne was selected instead of Datadog because it is perfect for large insurance networks and also connects trouble-free between the on-premise and cloud environments. Its alerts are in real-time, it offers comprehensive dashboards and it allows to gain a better grip on the network issues, thus helping to keep the downtime small and the operations well managed thanks to the good communication.
I used Ping.app and UptimeLog.app on the Mac. These both provided different aspects. These two had a menubar to show me green or red for multiple connections. UptimeLog showed me very clearly when my connectivity was on or off and for exactly how long