SPSS Statistics is a software package used for statistical analysis. It is now officially named "IBM SPSS Statistics". Companion products in the same family are used for survey authoring and deployment (IBM SPSS Data Collection), data mining (IBM SPSS Modeler), text analytics, and collaboration and deployment (batch and automated scoring services).
$105
per month per user
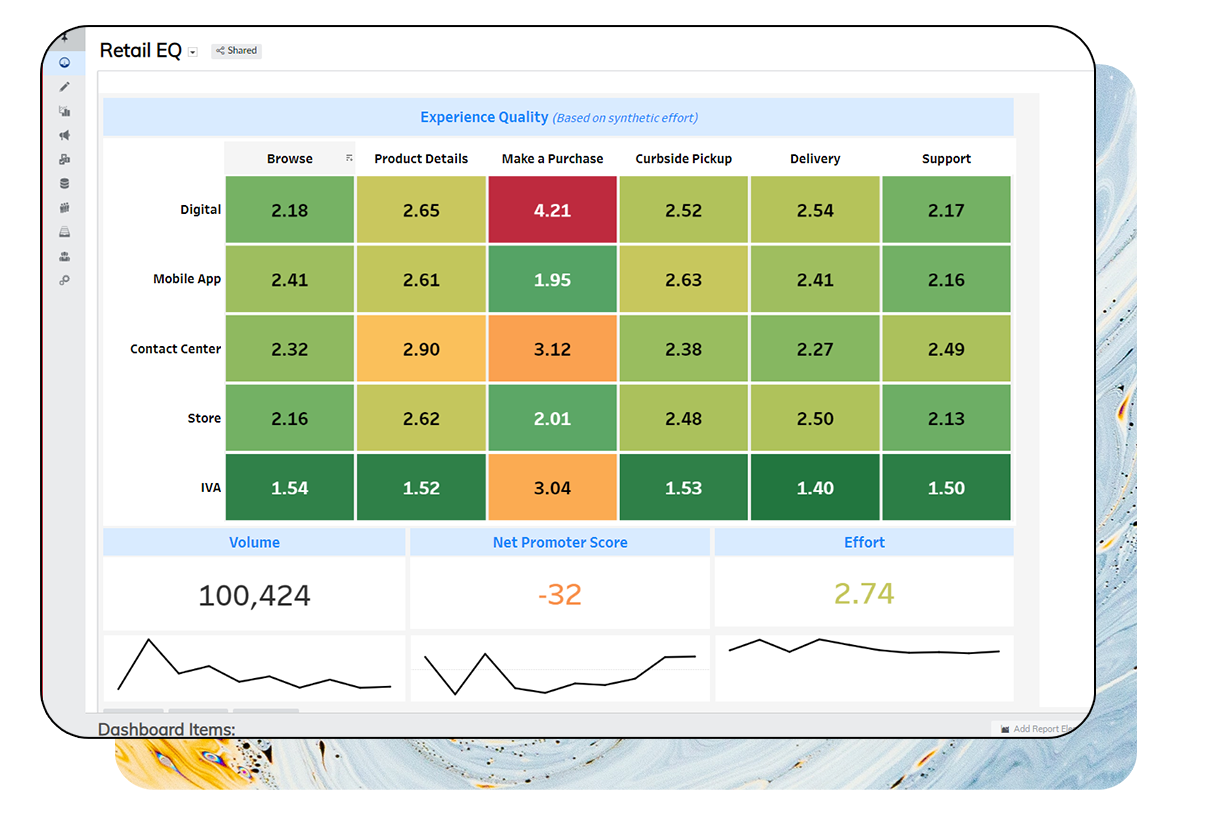
Verint Voice of the Customer
Score 9.3 out of 10
N/A
Verint® Voice of the Customer™ lets CX Leaders optimize customer experiences in real-time. With Verint Voice of the Customer, companies can listen everywhere, act immediately, and analyze. Verint offers prescriptive VoC solutions across Web and Mobile, Enterprise-wide, and Location-Based experiences.
SPSS's ability to deal with things like survey verbatims is a significant competitive disadvantage. The ability to do most of what researchers do without having to learn to program (think R or Python) is the primary advantage SPSS brings to bear.
Verint Voice of the Customer is very well suited for measuring how satisfied (or dissatisfied) the customer base is in close to real time. Also well suited for identifying pain points across the experience. Not sure if the platform is well suited for measuring multiple interactions for a specified journey or a specific audience experiencing a specific journey
SPSS has been around for quite a while and has amassed a large suite of functionality. One of its longest-running features is the ability to automate SPSS via scripting, AKA "syntax." There is a very large community of practice on the internet who can help newbies to quickly scale up their automation abilities with SPSS. And SPSS allows users to save syntax scripting directly from GUI wizards and configuration windows, which can be a real life-saver if one is not an experienced coder.
Many statistics package users are doing scientific research with an eye to publish reproducible results. SPSS allows you to save datasets and syntax scripting in a common format, facilitating attempts by peer reviewers and other researchers to quickly and easily attempt to reproduce your results. It's very portable!
SPSS has both legacy and modern visualization suites baked into the base software, giving users an easily mountable learning curve when it comes to outputting charts and graphs. It's very easy to start with a canned look and feel of an exported chart, and then you can tweak a saved copy to change just about everything, from colors, legends, and axis scaling, to orientation, labels, and grid lines. And when you've got a chart or graph set up the way you like, you can export it as an image file, or create a template syntax to apply to new visualizations going forward.
SPSS makes it easy for even beginner-level users to create statistical coding fields to support multidimensional analysis, ensuring that you never need to destructively modify your dataset.
In closing, SPSS's long and successful tenure ensures that just about any question a new user may have about it can be answered with a modicum of Google-fu. There are even several fully-fledged tutorial websites out there for newbie perusal.
Stable Platform- If a user gives a low satisfaction score, Verint Voice of the Customer can alert support teams to reach out and resolve the issue promptly.
Verint Voice of the Customer gathers customer feedback on OhioMeansJobs.com, it can capture survey responses after job searches, resume uploads, or virtual workshops, giving a holistic view of user experience.
collaboration - SPSS lacks collaboration features which makes it near impossible to collaborate with my team on analysis. We have to send files back and forth, which is tedious.
integration - I wish SPSS had integration capabilities with some of the other tools that I use (e.g., Airtable, Figma, etc.)
user interface - this could definitely be modernized. In my experience, the UI is clunky and feels dated, which can negatively impact my experience using the tool.
Both money and time are essential for success in terms of return on investment for any kind of research based project work. Using a Likert-scale questionnaire is very easy for data entry and analysis using IBM SPSS. With the help of IBM SPSS, I found very fast and reliable data entry and data analysis for my research. Output from SPSS is very easy to interpret for data analysis and findings
Probably because I have been using it for so long that I have used all of the modules, or at least almost all of the modules, and the way SPSS works is second nature to me, like fish to swimming.
Overall usability is easy and while I have been using it for years and used to it, new users seem to be able to create surveys without any training or hand holding. Simply create a login and they can figure it out themselves quickly because of the intuitive nature of the layout. Verint could use to improve or update the user interface as it seems very dated visually.
I have not contacted IBM SPSS for support myself. However, our IT staff has for trying to get SPSS Text Analytics Module to work. The issue was never resolved, but I'm not sure if it was on the IT's end or on SPSS's end
Every support contact I have had, be it by email, live chat or phone, I have had my issue resolved very quickly, efficiently and professionally by a knowledgeable and well trained support team member. Having worked in technical support many years ago myself, I can appreciate the level of service and quality of support offered by Verint. I would, without hesitation, say that Verint offers one of the best support experiences out there.
Have a plan for managing the yearly upgrade cycle. Most users work in the desktop version, so there needs to be a mechanism for either pushing out new versions of the software or a key manager to deal with updated licensing keys. If you have a lot of users this needs to be planned for in advance.
If you have made it this far, you should have a very good idea of how SPSS stacks up the competition (data processing and analytics tools). Even the free ones, such as r Studio or Stata, are leaps and bounds ahead of SPSS. IBM is resting on a reputation developed nearly 30 years ago and has shown no desire to improve.
OpinionLab is one of the few out there that does two things very well in it's space: 1. Customer Feedback - just feedback, not surveys. Feedback is free text without more than one or two structured questions. Most survey systems offer too many options, and their reporting is made for structured data analysis not analysis of the open text fields. Some of the other tools viewed did not have the best features for medium or large scale deployment, from an analysis perspective, real-time data extract and download, or customization for branding.
IBM Cognos Analytics may have been designed to scale up to a very large number of users however we are a small business with small number of users and the program worked equally well for us. We would highly recommend the product for any business no matter the size, small to large.
I found SPSS easier to use than SAS as it's more intuitive to me.
The learning curve to use SPSS is less compared to SAS.
I used SAS, to a much lesser extent than SPSS. However, it seems that SAS may be more suitable for users who understand programming. With SPSS, users can perform many statistical tests without the need to know programming.
Collect data around our login experience where eventually we were able to release a GPE directing customers to utilize our virtual assistant
Verbatim around the claims experience allowed us to update our Claims Status page to provide more detailed, transparent information to the customer around the status of their claim.