iCharts vs. Logi Info

Overview
ProductRatingMost Used ByProduct SummaryStarting Price
iCharts
Score 8.0 out of 10
Mid-Size Companies (51-1,000 employees)
iCharts is a Business Intelligence and Analytics solution for NetSuite. With this solution, users can transform their NetSuite data into interactive, real-time analytics without leaving their NetSuite dashboard. iCharts includes drag-and-drop chart creation and best-practice templates. The vendor’s value proposition is that iCharts accelerates an organization’s analytics strategy by empowering their team with the critical data-driven tools they need.
$10,000
per installation
Logi Info
Score 3.0 out of 10
Mid-Size Companies (51-1,000 employees)
Logi Info (or the Logi Analytics Platform) is a developer-grade analytics platform designed for application teams needing to rapidly build, deploy, and maintain mission-critical applications. Logi serves the embedded model, so companies increase the likelihood of building valuable, long lasting applications. The vendor focuses on enriching embedded analytics capabilities so that their customers' applications become more valuable, faster. According to the vendor, Logi allows customers to…N/A
Pricing
iChartsLogi Info
Editions & Modules
Professional
$10,000
per installation
Business
15,000
per installation
Elite
$25,000
per installation
No answers on this topic
Offerings
Pricing Offerings
iChartsLogi Info
Free Trial
YesYes
Free/Freemium Version
NoNo
Premium Consulting/Integration Services
YesYes
Entry-level Setup Fee$3,000 per installationNo setup fee
Additional DetailsBased on number of NetSuite licensesLogi's pricing was developed with software vendors in mind and as such, we offer flexible, custom pricing aligned with your go-to-market approach and long-term growth plans. Our pricing objective is to ensure our partners can rapidly scale their analytics.
More Pricing Information
Community Pulse
iChartsLogi Info
Features
iChartsLogi Info
BI Standard Reporting
Comparison of BI Standard Reporting features of Product A and Product B
iCharts
9.0
2 Ratings
9% above category average
Logi Info
3.0
25 Ratings
93% below category average
Customizable dashboards10.02 Ratings3.025 Ratings
Report Formatting Templates8.01 Ratings1.023 Ratings
Pixel Perfect reports00 Ratings5.01 Ratings
Ad-hoc Reporting
Comparison of Ad-hoc Reporting features of Product A and Product B
iCharts
9.0
2 Ratings
11% above category average
Logi Info
1.8
24 Ratings
127% below category average
Drill-down analysis9.02 Ratings2.023 Ratings
Report sharing and collaboration9.02 Ratings1.023 Ratings
Formatting capabilities00 Ratings3.024 Ratings
Integration with R or other statistical packages00 Ratings1.01 Ratings
Report Output and Scheduling
Comparison of Report Output and Scheduling features of Product A and Product B
iCharts
10.0
1 Ratings
20% above category average
Logi Info
4.5
23 Ratings
58% below category average
Publish to Web10.01 Ratings8.419 Ratings
Publish to PDF00 Ratings4.020 Ratings
Report Delivery Scheduling00 Ratings1.018 Ratings
Data Discovery and Visualization
Comparison of Data Discovery and Visualization features of Product A and Product B
iCharts
8.0
1 Ratings
0% above category average
Logi Info
4.8
22 Ratings
50% below category average
Pre-built visualization formats (heatmaps, scatter plots etc.)8.01 Ratings5.022 Ratings
Location Analytics / Geographic Visualization00 Ratings2.017 Ratings
Predictive Analytics00 Ratings7.56 Ratings
Access Control and Security
Comparison of Access Control and Security features of Product A and Product B
iCharts
8.7
2 Ratings
2% above category average
Logi Info
2.0
19 Ratings
124% below category average
Multi-User Support (named login)9.02 Ratings2.019 Ratings
Role-Based Security Model8.02 Ratings2.018 Ratings
Multiple Access Permission Levels (Create, Read, Delete)9.02 Ratings2.016 Ratings
Report-Level Access Control00 Ratings2.01 Ratings
Mobile Capabilities
Comparison of Mobile Capabilities features of Product A and Product B
iCharts
10.0
2 Ratings
25% above category average
Logi Info
2.0
20 Ratings
118% below category average
Responsive Design for Web Access10.01 Ratings2.020 Ratings
Dashboard / Report / Visualization Interactivity on Mobile10.02 Ratings2.016 Ratings
Application Program Interfaces (APIs) / Embedding
Comparison of Application Program Interfaces (APIs) / Embedding features of Product A and Product B
iCharts
-
Ratings
Logi Info
5.2
15 Ratings
39% below category average
REST API00 Ratings8.56 Ratings
Javascript API00 Ratings8.48 Ratings
iFrames00 Ratings2.09 Ratings
Themeable User Interface (UI)00 Ratings2.015 Ratings
Best Alternatives
iChartsLogi Info
Small Businesses
Yellowfin
Yellowfin
Score 8.7 out of 10
Yellowfin
Yellowfin
Score 8.7 out of 10
Medium-sized Companies
Reveal
Reveal
Score 10.0 out of 10
Reveal
Reveal
Score 10.0 out of 10
Enterprises
Kyvos Semantic Layer
Score 9.5 out of 10
Kyvos Semantic Layer
Score 9.5 out of 10
All AlternativesView all alternativesView all alternatives
User Ratings
iChartsLogi Info
Likelihood to Recommend
8.0
(2 ratings)
3.0
(26 ratings)
Likelihood to Renew
-
(0 ratings)
1.0
(2 ratings)
Usability
-
(0 ratings)
2.0
(3 ratings)
Support Rating
-
(0 ratings)
8.0
(2 ratings)
User Testimonials
iChartsLogi Info
Likelihood to Recommend
iCharts, Inc.
The iCharts has suited our organization work as it has helped us a lot in our internal and external works. As we use iCharts for the internal team in representing the working reports and data of the business in an accurate manner. It helps in representing the presentation to the client to showcase our work and present him the data and work flow through the iCharts. As I don't found anything missing in this software.
Read full review
Insightsoftware, Inc
Logi Composer is the best of the product range that Logi Analytics offers; Logi Info is, in my mind, a terrible experience and should be discontinued. Logi Info is not a BI tool and many CEOs and product managers believe it is. Instead, it is a tool for web developers to create IIS apps with a library of BI-type components, and with everything else having to be hand-coded in JavaScript and CSS. Maybe this was cool back in the early 2000s when Logi Info came about, but today I'd recommend using Visual Studio, C#, .NET, and finding a NuGet package for your visualisations if you wanted to go the route of making your own web app. This said, where it is suited is if you have a burning desire to make a stand-alone IIS-based web application and you don't need or want to leverage any existing skills in .NET or PHP or other frameworks/languages. Instead, you want to use the Logi Info XML-based BI widgets and you're happy to make something quick without needing it to look really awesome.
Read full review
Pros
iCharts, Inc.
  • Their new platform is easy to navigate
  • We had a dedicated support person to help set up searches and train in the use of iCharts
  • Separate Dashboards for each group
Read full review
Insightsoftware, Inc
  • Clear/Concise view of data. Easily intuitive, amazing drill down capability, fully user configurable panels and dashboards.
  • Self-Service is such a powerful tool for facilities that want to create/design their own reports/dashboards, it's instantly recognized as being very powerful and agile.
  • Logi software makes the designer realize that they should think outside the box and not stick with "it's how we have always done it limitation". It allows you to be very creative.
Read full review
Cons
iCharts, Inc.
  • The new platform has limitations on colors and sizing
  • iCharts seem to have closed its doors without notification and now we have a product with no support
Read full review
Insightsoftware, Inc
  • It is not always intuitive to incorporate JavaScript into Logi Info. The tools are all available, but the process requires multiple resource in translating between Logi and JavaScript.
  • The toolbox is too vast for Logi to provide a 'quick implementation' or 'quick start guide'. There are so many tools that Logi expects the client to determine which fit their use case. There are purchasable 'Professional Services' options for implementation, but without these, the toolset is almost too big.
Read full review
Likelihood to Renew
iCharts, Inc.
No answers on this topic
Insightsoftware, Inc
Logi Info is a very outdated, archaic product that tries to build .NET / Java web apps using an obscure XML-based markup language to implement BI widgets, with a lot of extra CSS/JavaScript needed on your own to make it do the best things. There are many other better tools. It is not a BI tool, and as a web development tool it's not great either. I'd recommend getting some good third-party .NET BI library if you want your web devs to make the reports, otherwise use a proper BI tool like Power BI or Tableau, or even Logi Composer (formerly ZoomData before Logi acquired it.)
Read full review
Usability
iCharts, Inc.
No answers on this topic
Insightsoftware, Inc
I am giving 9 rating because the Logi Info still needs to improve on the tutorials part and make it easy for the beginners. Otherwise, it's a very good analytics tool which offers more than 20 types of visualization. It's predictive analysis feature and easy to embed with technologies make it stand out in the market.
Read full review
Support Rating
iCharts, Inc.
No answers on this topic
Insightsoftware, Inc
The support process is bit slow and has a good scope improvement but overall it's good as team is very supportive. They generally take 1-2 days time to respond emails sent to them but some times a delay is also expected. Overall, I did not face any major issues using the service.
Read full review
Alternatives Considered
iCharts, Inc.
I haven't experience any other alternative product of this.
Read full review
Insightsoftware, Inc
Logi gave us the flexibility we needed to meet the configurable nature of our product and for the need to create custom reports. Other products did not allow flexbility to generate reports via script as was one of our primary requirements.
Read full review
Return on Investment
iCharts, Inc.
No answers on this topic
Insightsoftware, Inc
  • By embedding Logi in our solution and using the Logi Self-Service Module we can provide this flexibility to our users without requiring custom development work for each new request.
  • We succeeded in developing embedded self-service analytics at scale with a combination of Logi analytics as front-end and a Cassandra data lake with Spark aggregation algorithms as back-end.
  • We analyze the insurance industry and need to replicate different data formats across hundreds of databases to support multi-tenant (customer) BI reports and "ad hoc" data review on millions or hundreds of millions of records per customer.
Read full review
ScreenShots

iCharts Screenshots

Screenshot of Screenshot of

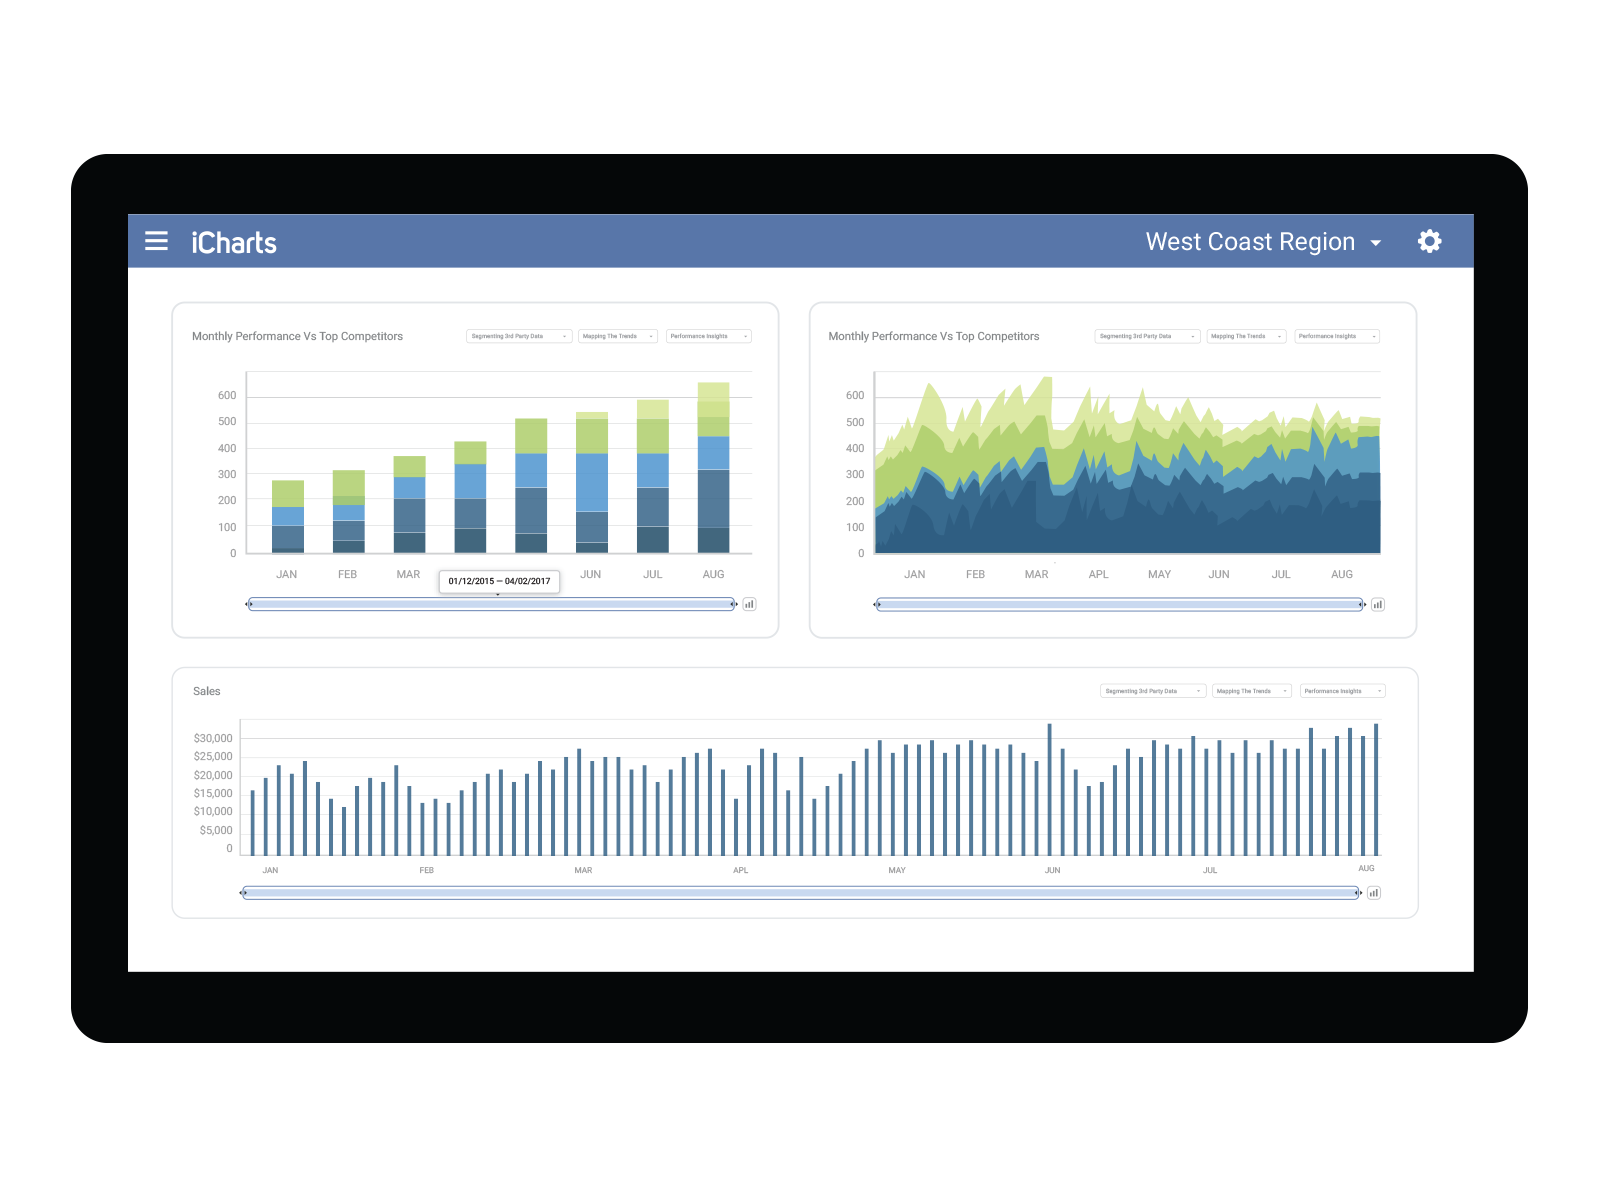
Logi Info Screenshots

Screenshot of Logi Info Discovery ModuleScreenshot of A customized Logi dashboardScreenshot of Logi powered application showing a completely unique UI/InterfaceScreenshot of Another unique display of dataScreenshot of Logi leveraging D3 charts via its robust extensibility