Icinga is an open source network monitoring platform. It includes automation, modularized integration packages, and prebuilt alerts and reporting capabilities.
N/A
Nagios Core
Score 7.7 out of 10
N/A
Nagios provides monitoring of all mission-critical infrastructure components. Multiple APIs and community-build add-ons enable integration and monitoring with in-house and third-party applications for optimized scaling.
N/A
SolarWinds Security Event Manager (SEM)
Score 8.0 out of 10
N/A
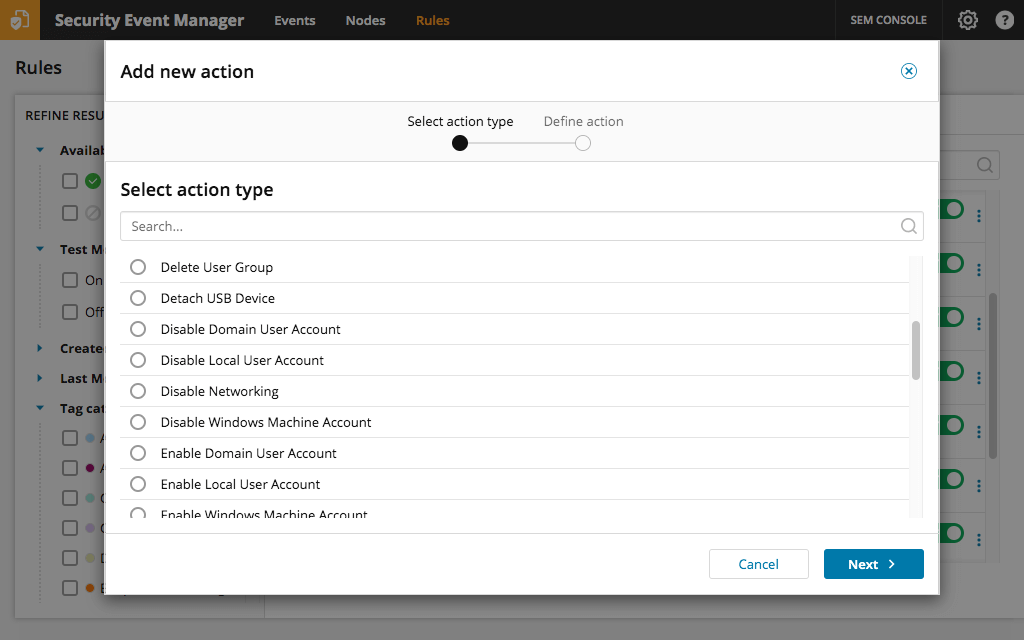
SolarWinds LEM is security information and event management (SIEM) software.
PRTG was the solution that was implemented before. As Icinga is Open Source we saved the licensing fee, as we ran out of free checks. I also had knowledge in Icinga so we switched over.
Nagios is inferior to Icinga in my opinion, as Icinga has the better Web UI, which I use the …
Icinga was initially a fork of Nagios. Over time, the configuration language was replaced with something more programmatic. This configuration language is one of the big sellers of this product. It allows flexible, quick configuration of large sets of hosts and services with …
While Icinga holds its own against old stalwarts like Nagios and Zabbix, it simply can't compete with the new generation of SaaS service/server monitoring software in terms of ease of use, feature-completeness, integration with things like Cloudwatch, CloudHealth, New Relic, …
There are two main competitors of Icinga in my opinion, Nagios, and NetFlow based monitoring solutions. Both are good, Icinga, is a more refined version of Nagios with a much better API and backwards compatibility to the platform. If you are running Nagios, you can transfer …
Icinga is better than Nagios because of its nicer user interface. New Relic can monitor CPU/memory and disk usage, but it's more of a performance and application troubleshooting tool rather than monitoring.
We selected Nagios because of the size of its community. We've used some of the others in the field over the past few years, Nagios had the best features out of the box coupled with it's following made it an easy selection.
Nagios is an easy to use intuative tool that gives a great return on investment. It has better monitoring features that IT needs than competitors and won't break the bank. Support for this tool is first class and the techs will help you to get the most out of the product.
Icinga is a world-class monitoring system. It can be used for most general monitoring situations. It is not a silver bullet, however, and there are instances where domain-specific monitoring systems are necessary. However, the output from those monitoring systems can be funneled into Icinga as a central monitoring and alerting system.
Nagios monitoring is well suited for any mission critical application that requires per/second (or minute) monitoring. This would probably include even a shuttle launch. As Nagios was built around Linux, most (85%) plugins are Linux based, therefore its more suitable for a Linux environment.
As Nagios (and dependent components) requires complex configurations & compilations, an experienced Linux engineer would be needed to install all relevant components.
Any company that has hundreds (or thousands) of servers & services to monitor would require a stable monitoring solution like Nagios. I have seen Nagios used in extremely mediocre ways, but the core power lies when its fully configured with all remaining open-source components (i.e. MySQL, Grafana, NRDP etc). Nagios in the hands of an experienced Linux engineer can transform the organizations monitoring by taking preventative measures before a disaster strikes.
Optimal for SolarWinds Security Event Manager needs for smaller companies - it is a very cool product but has some limitations around EPS (which gets chewed up quickly if you're doing it the right way & adding servers/storage/FW & other network devices)... Also pricing model is GREAT (not consumption-based, which is the greatest grift the SIEM industry has created).
It does a great job of notifying us when accounts have been locked out. We can then find out the device on the network where the login attempt occurred.
Searching for incidents is now a lot faster with the implementation of the HTML 5 interface.
Nagios could use core improvements in HA, though, Nagios itself recommends monitoring itself with just another Nagios installation, which has worked fine for us. Given its stability, and this work-around, a minor need.
Nagios could also use improvements, feature wise, to the web gui. There is a lot in Nagios XI which I felt were almost excluded intentionally from the core project. Given the core functionality, a minor need. We have moved admin facing alerts to appear as though they originate from a different service to make interacting with alerts more practical.
All SolarWinds product suffer from slow response times in management portals. SolarWinds SEM is no exception. While it is much preferred over a "thick client" there is much room for improvement in speed.
If you use the email alert features with SolarWinds make sure to prepare you staff and team for the large amount of emails they could receive. Make sure to reduce the number of alerts so your team does not ignore the alerts.
Icinga is a solid solution which does everything it promises. It is backwards compatible with most Nagios instances, making the transition very easy. Once you get the hang of installing new plugins and editing configuration files expanding its monitoring capabilities are easy.
We're currently looking to combine a bunch of our network montioring solutions into a single platform. Running multiple unique solutions for monitoring, data collection, compliance reporting etc has become a lot to manage.
It is pretty likely that we will renew SEM when the time comes up. It is easy to use and maintain so there isn't much of a need to replace this product. It is also a pretty fair price for the capabilities provided by the SEM
The Nagios UI is in need of a complete overhaul. Nice graphics and trendy fonts are easy on the eyes, but the menu system is dated, the lack of built in graphing support is confusing, and the learning curve for a new user is too steep.
If you are familiar with SolarWinds then you can use this product it's as easy as that. If you have never used a SolarWinds product then it will take a minute to get how they do reports and make dashboards but that being said the tool is great and can make things very easy once you get a feel for how it works and get everything setup how you like it.
I haven't had to use support very often, but when I have, it has been effective in helping to accomplish our goals. Since Nagios has been very popular for a long time, there is also a very large user base from which to learn from and help you get your questions answered.
The quality of support can vary depending on whom you end up speaking with. I was fortunate enough to work with a support representative who was very familiar with the product. He had even authored some of the support documentation on the website. On the flip side, I had two other experiences where I was simply directed to online training material.
Icinga is better than Nagios because of its nicer user interface. New Relic can monitor CPU/memory and disk usage, but it's more of a performance and application troubleshooting tool rather than monitoring
Because we get all we required in Nagios [Core] and for npm, we have to do lots of configuration as it is not as easy as Comair to Nagios [Core]. On npm UI, there is lots of data, so we are not able to track exact data for analysis, which is why we use Nagios [Core].
Fortianalzyer can only do logs from FortiGate so usefulness is limited. Elasticsearch was a lot slower than Solarwinds and the filters were a lot harder to set up and use. The connectors for SEM were far more stable.
With it being a free tool, there is no cost associated with it, so it's very valuable to an organization to get something that is so great and widely used for free.
You can set up as many alerts as you want without incurring any fees.
For the price, it produced a decent value. It did a lot of the easy stuff well. I can't give any specific data given the objective of the product was to monitor very basic events in the environment.