Chose IDERA SQL Diagnostic Manager
IDERA SQL Diagnostic Manager for SQL Server is an excellent tool, however I think Solarwinds Database Perfromance Analyzer is a slightly stronger more well rounded product
| Product | Rating | Most Used By | Product Summary | Starting Price |
|---|---|---|---|---|
 IDERA SQL Diagnostic Manager | N/A | SQL Diagnostic Manager for Microsoft SQL Server helps database administrators to find and fix Microsoft SQL Server performance problems in physical, virtual, and cloud environments. Unlike its competition, it provides effective scalability, advanced SQL query analysis and optimization, prescriptive analysis with corrective SQL scripts, powerful automated alert responses, broad PowerShell integration, complete customization, and extensive support for current and legacy Microsoft SQL Server and… | $1,996 per instance with first year maintenance included | |
 Splunk Enterprise | N/A | Splunk is software for searching, monitoring, and analyzing machine-generated big data, via a web-style interface. It captures, indexes and correlates real-time data in a searchable repository from which it can generate graphs, reports, alerts, dashboards and visualizations. | N/A |
| IDERA SQL Diagnostic Manager | Splunk Enterprise | |||||||||||||||
|---|---|---|---|---|---|---|---|---|---|---|---|---|---|---|---|---|
| Editions & Modules |
| No answers on this topic | ||||||||||||||
| Offerings |
| |||||||||||||||
| Entry-level Setup Fee | No setup fee | No setup fee | ||||||||||||||
| Additional Details | — | — | ||||||||||||||
| More Pricing Information | ||||||||||||||||
| IDERA SQL Diagnostic Manager | Splunk Enterprise | |
|---|---|---|
| Considered Both Products |  IDERA SQL Diagnostic Manager  José Javier Dominguez Reina Jefe de Proyecto Chose IDERA SQL Diagnostic Manager IDERA SQL Diagnostic Manager for SQL, Redgate SQL, and MonitorLogicMonitor are similar products to each other. We decided on IDERA SQL Diagnostic Manager for SQL because our experience with locating heavy queries has been very good and it provides real-time monitoring of all …  Steven Gockley, MBA, MCSA DBA / Sr. Data Analyst Chose IDERA SQL Diagnostic Manager All the toolsets we looked at have the same basic feature sets. We felt like IDERA SQL Diagnostic Manager for SQL Server had more features (SQL Doctor features) and better historical features. More toolsets now have a lot of these features, but for eight years, IDERA SQL …  Gedson Silva Senior Production Engineer Chose IDERA SQL Diagnostic Manager SQL Server Business Intelligence Manager does what SQL Server Management Studio should already do natively. So it actually fills up important gaps Microsoft left in its product.  Samir Patel, PMP SQL Development Team Lead Chose IDERA SQL Diagnostic Manager We compared SQL Server Business Intelligence Manager to our current tool Solarwinds Database Performance Analyzer. Where Solarwinds was deficient, SQL BI manager filled the gap. At the end of the day they were both different tools with different purposes so we concluded it was … |  Splunk Enterprise  Eric Galipaud Network Ingeneer Chose Splunk Enterprise Splunk Enterprise stands out compared to other solutions due to its broad compatibility and flexibility. It integrates easily with a wide range of infrastructure, network, security, and application products, thanks to its support for multiple data formats and its extensive … |
| IDERA SQL Diagnostic Manager | Splunk Enterprise | ||||||||||||||||||||||||||||||||||||||||||
|---|---|---|---|---|---|---|---|---|---|---|---|---|---|---|---|---|---|---|---|---|---|---|---|---|---|---|---|---|---|---|---|---|---|---|---|---|---|---|---|---|---|---|---|
| SQL Performance Monitoring |
| ||||||||||||||||||||||||||||||||||||||||||
| Security Information and Event Management (SIEM) |
|
| IDERA SQL Diagnostic Manager | Splunk Enterprise | |
|---|---|---|
| Small Businesses | No answers on this topic |  LevelBlue USM Anywhere Score 8.1 out of 10 |
| Medium-sized Companies |  Redgate Monitor Score 8.0 out of 10 |  Sumo Logic Score 8.8 out of 10 |
| Enterprises | Redgate Monitor Score 8.0 out of 10 | Sumo Logic Score 8.8 out of 10 |
| All Alternatives | View all alternatives | View all alternatives |
| IDERA SQL Diagnostic Manager | Splunk Enterprise | |
|---|---|---|
| Likelihood to Recommend | 9.0 (0 ratings) | 8.7 (0 ratings) |
| Likelihood to Renew | - (0 ratings) | 8.5 (0 ratings) |
| Usability | - (0 ratings) | 8.5 (0 ratings) |
| Availability | - (0 ratings) | 10.0 (0 ratings) |
| Support Rating | - (0 ratings) | 8.0 (0 ratings) |
| Online Training | - (0 ratings) | 8.0 (0 ratings) |
| Implementation Rating | - (0 ratings) | 7.0 (0 ratings) |
| Product Scalability | - (0 ratings) | 9.1 (0 ratings) |
| IDERA SQL Diagnostic Manager | Splunk Enterprise | |
|---|---|---|
| Likelihood to Recommend |
 Greg Goss SQL Database and Business Intelligence Manager |
|
| Pros |
Greg Goss SQL Database and Business Intelligence Manager |
 Pooja Gada Engineering Tech Lead |
| Cons |
Steven Gockley, MBA, MCSA DBA / Sr. Data Analyst |
|
| Likelihood to Renew | No answers on this topic |
|
| Usability | No answers on this topic |
|
| Reliability and Availability | No answers on this topic |
|
| Support Rating | No answers on this topic |
|
| Online Training | No answers on this topic |
|
| Implementation Rating | No answers on this topic |
|
| Alternatives Considered |
|
|
| Scalability | No answers on this topic |
 Rick Yetter Regional Director |
| Return on Investment |
José Javier Dominguez Reina Jefe de Proyecto |
 Kuntal Das Security Analyst |
| ScreenShots | IDERA SQL Diagnostic Manager Screenshots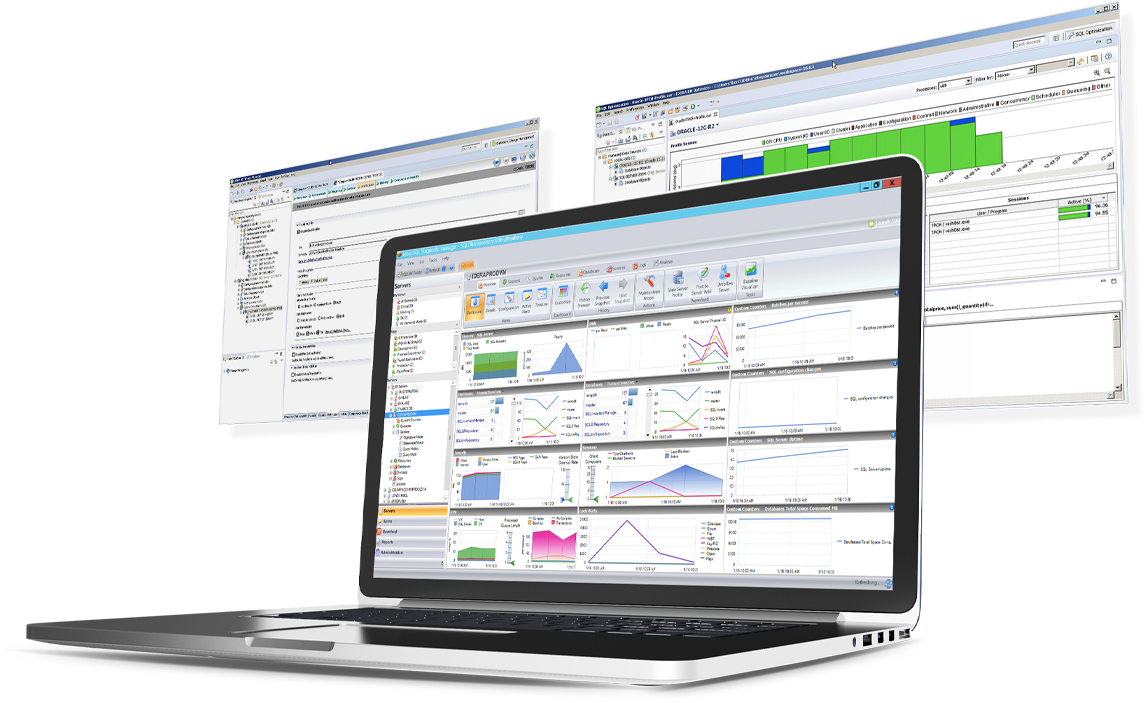 |