Synergies is a cognitive application service provider that combines business knowledge, artificial intelligence technology, and software development. Their mission is to help businesses through their digital transformation journey, become leaders and innovators in their industries by unlocking the power of data in the hands of business users and decision makers. Their product, JarviX, is an AnalyticOps Platform . JarviX uses NLP…
N/A
Logi Symphony
Score 8.9 out of 10
N/A
Logi Symphony is a business intelligence and data visualization software that includes customizable dashboards, reporting, and visual data analytics. It can be integrated into users’ existing business applications and its visualization and reporting tools can be customized.
N/A
Pricing
JarviX
Logi Symphony
Editions & Modules
No answers on this topic
No answers on this topic
Offerings
Pricing Offerings
JarviX
Logi Symphony
Free Trial
No
Yes
Free/Freemium Version
No
No
Premium Consulting/Integration Services
No
Yes
Entry-level Setup Fee
No setup fee
No setup fee
Additional Details
—
—
More Pricing Information
Community Pulse
JarviX
Logi Symphony
Features
JarviX
Logi Symphony
BI Standard Reporting
Comparison of BI Standard Reporting features of Product A and Product B
JarviX
7.6
2 Ratings
7% below category average
Logi Symphony
8.4
51 Ratings
3% above category average
Pixel Perfect reports
8.21 Ratings
8.443 Ratings
Customizable dashboards
7.32 Ratings
8.651 Ratings
Report Formatting Templates
7.31 Ratings
8.139 Ratings
Ad-hoc Reporting
Comparison of Ad-hoc Reporting features of Product A and Product B
JarviX
7.8
2 Ratings
3% below category average
Logi Symphony
8.1
51 Ratings
1% above category average
Drill-down analysis
7.12 Ratings
7.951 Ratings
Formatting capabilities
7.31 Ratings
8.250 Ratings
Integration with R or other statistical packages
9.11 Ratings
7.633 Ratings
Report sharing and collaboration
7.72 Ratings
8.645 Ratings
Report Output and Scheduling
Comparison of Report Output and Scheduling features of Product A and Product B
JarviX
7.8
1 Ratings
5% below category average
Logi Symphony
7.9
49 Ratings
4% below category average
Publish to Web
9.11 Ratings
8.442 Ratings
Publish to PDF
7.31 Ratings
7.845 Ratings
Report Versioning
6.41 Ratings
7.838 Ratings
Report Delivery Scheduling
8.21 Ratings
8.337 Ratings
Delivery to Remote Servers
8.21 Ratings
7.23 Ratings
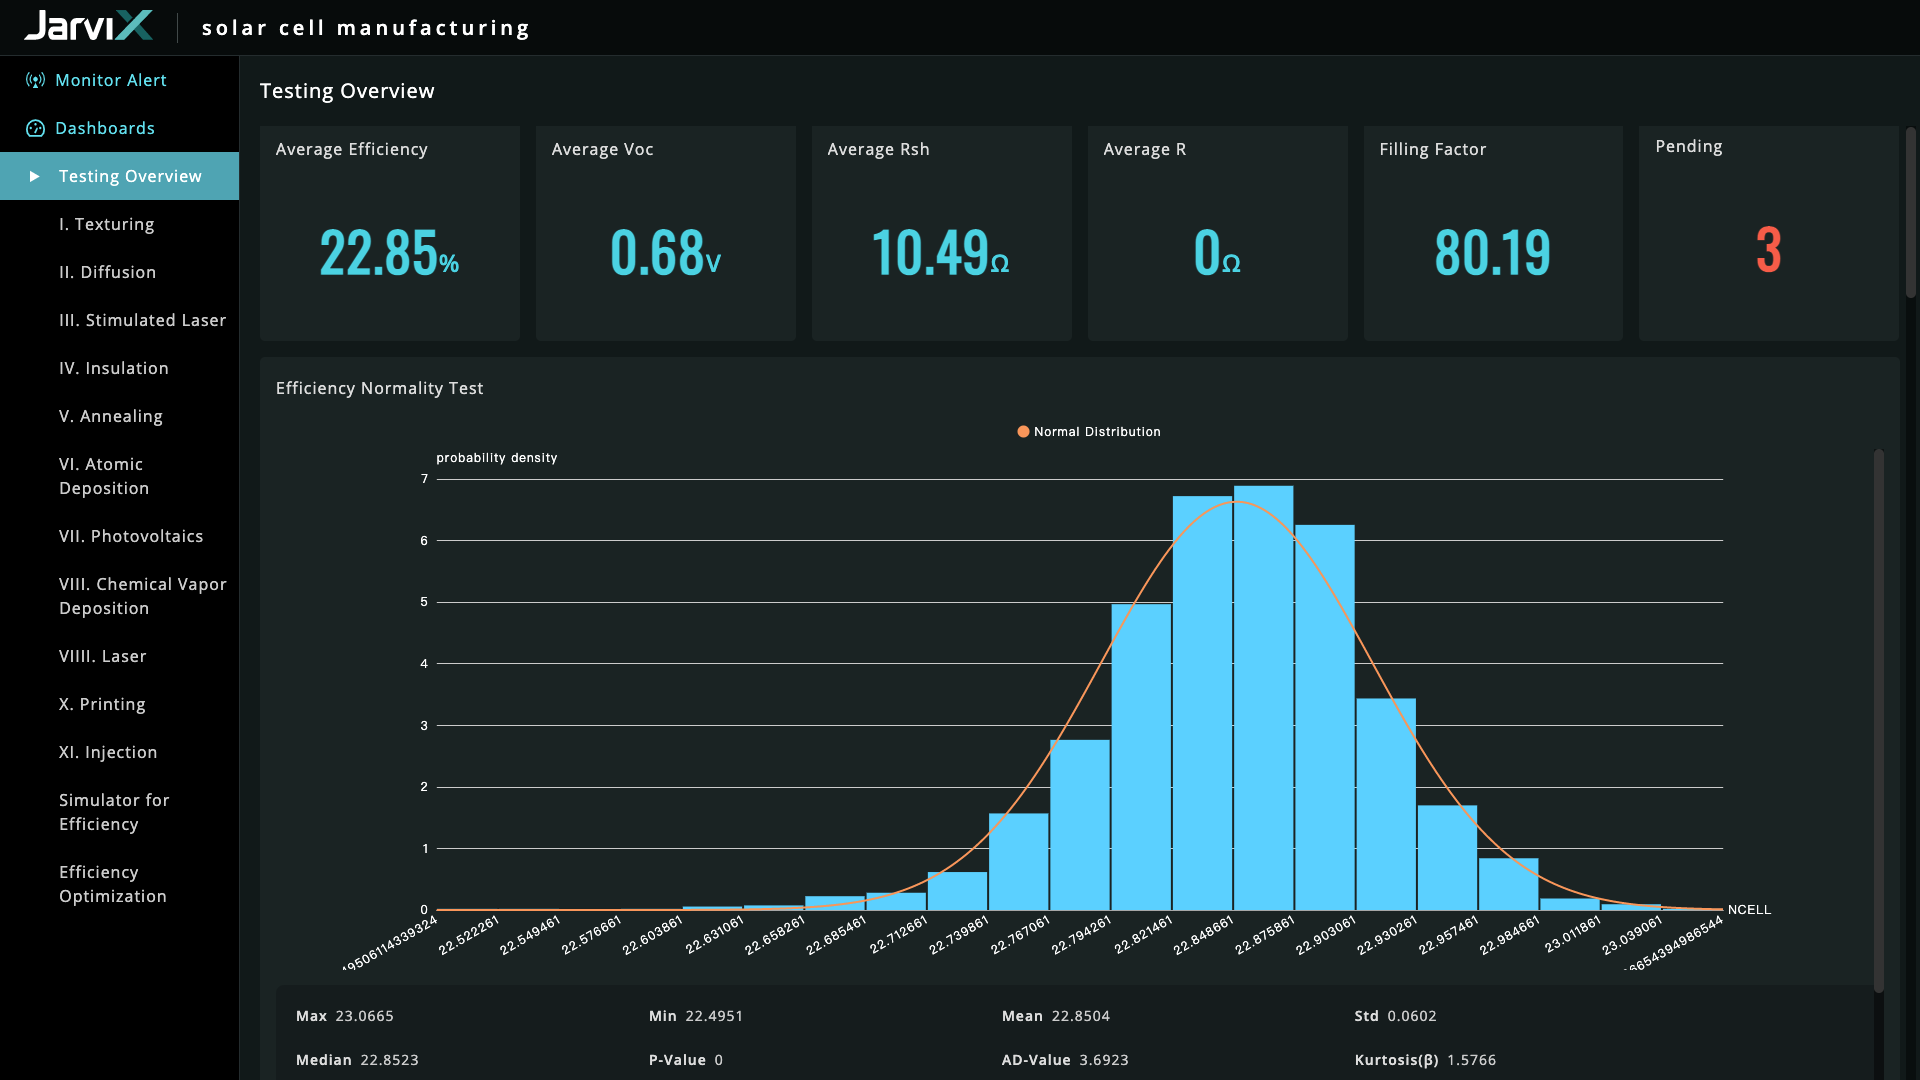
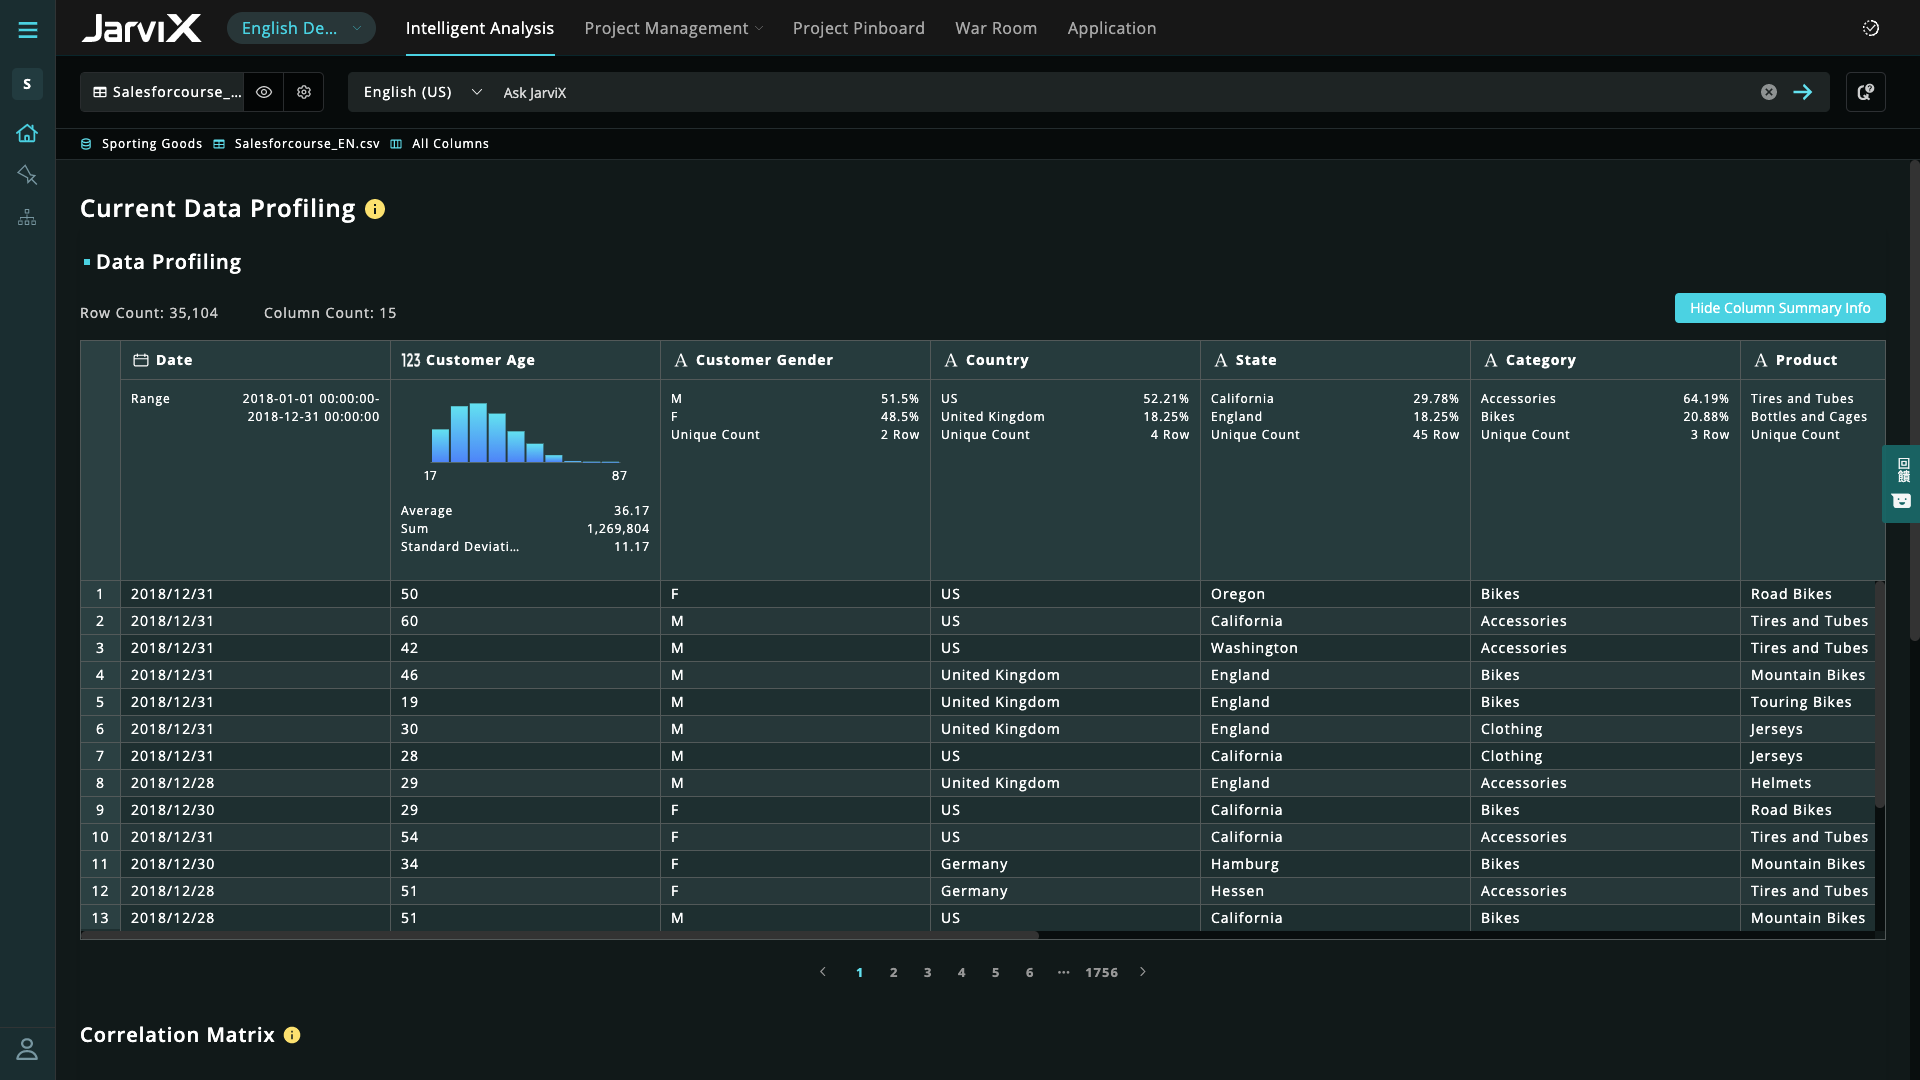
Data Discovery and Visualization
Comparison of Data Discovery and Visualization features of Product A and Product B
JarviX is very good at data integration, creating charts and reports for data visualization. It is really impressive that Jarvix can let our marketing team know the number of members living in a specific area in seconds. In addition, the product manager from Synergies is willing to help us with all problems we encounter. I accidentally changed one of the settings in a data table which threw the existing dashboard into chaos. However, after assistance from the product manager, we were able to successfully bring the data back to normal.
For all the scenarios I have so far worked on or I am currently working on, Dundas BI has proved to be more than adequate and apt to handle all of those. It is a very easy-to-use tool with quick shortcuts enabling you to prepare ad-hoc reports or dashboards in a matter of minutes.
Project organization from Development to Production, you get a production and development license but I think the best way to do it is with DEV and Prod project in the Production box. Use the development box for testing updates and really crazy things. With the Dev and Prod projects on the same box, you just publish from Dev to Prod and you are done. Users only have access to the Prod projects so no one can mess up what you are working on.
Security - If you have a hierarchy (subsidiaries, divisions, department, teams) and you want each group to see only their data, then Security hierarchies are for you!
Dependent filters! What's this you ask? Here is an example of how it can be used, in your company you have departments and who works for what department is in your database. You make a dashboard that has a department filter (only show these departments), a managers filter, and employee filter. Not every manager or employee is in multiple departments usually only one. With dependent filters you can say that the manager and employee filter are dependent on what is selected in the departments filter so when you go to filter them they only show the managers or employees that are part of that department, and you can even it do so employees are not only dependent on department but on manager as well. Then it gets even better as it can be done in reverse as well so when you select a manager then go to the department it only shows the departments he works for (there are better situations where this is more useful).
It is scriptable! From calculate columns, null replacements, button actions, load actions, hover over events there a way to do what you want.
They are constantly improving and listens to your suggestions.
There should be more flexibility in changing the data tables uploaded into JarviX. For example, it should enable users to edit the syntax of the table or change the data format of the columns without affecting the existing dashboard and charts already created using that data table.
Not too many cons for how we use the application. It really is easy and powerful. Very powerful.
Licensing is one thing that could be looked into. It is simple, but a little confusing. For example, if I get a license today, but a new release comes out tomorrow, it seems that the license doesn't work with the new release. Maybe that is by design, but it would be nice to clearly understand.
We are still in the implementation phase, but so far we are finding it to be easy to use and learn. The eLearning courses that they have made available for free, as well as User Forums and other training videos have made even difficult concepts easier to understand.
We have bi-weekly calls with our Success Manager, as well as access to support as needed. Any question that I have had, multiple people have been willing and able to jump on a call to talk me through it, or send an email with the solution
Tableau and Power BI. Obviously, they are not in the same category. Tableau and Power BI only provide data visualizations plus a little bit of analytics. JarviX not only provides data exploration, so you can find out what the problem is, as well as model management and App builder. If you only look for a dashboard, yes BI is probably enough, but if you constantly feel lacking actionable insights for actual implementations of improvements, JarviX is the choice for you.
Per dollar spent, it offers the widest range of features of the tools that we evaluated. It offers lots of options for how to configure your environment, though they are not always intuitive to figure out. Having an ETL layer was a must have for us, as well as the ability to host to secure HIPAA compliance. It is not a replacement for ad hoc reporting, but does a great job of creating parameterized reports and dashboards that look great.
I think the best part of JarviX is that we can get the analysis results in several minutes. We spent lots of time making reports and managing our data in the past. All in all, it helps us save the time, cost, and labor of managing data.