Jet Reports vs. VizualSurvey

Overview
ProductRatingMost Used ByProduct SummaryStarting Price
Jet Reports
Score 9.4 out of 10
N/A
Jet Reports is a business intelligence software now offered by insightsoftware, inc since the company's 2019 acquisition of Jet Global Data Technologies.N/A
VizualSurvey
Score 8.0 out of 10
Small Businesses (1-50 employees)
Overview: With VizualSurvey software anyone – with or without analytics skills can make professional survey dashboards within a short time. Once a user connects or uploads survey data from survey software, it can be transformed into the correct format that will work perfectly with any data visualization software. Users gain access to prebuilt survey dashboards in the top data visualization software (Tableau, Power Bi, Qlik and Tibco Spotfire) to visualize survey data.…
$0
1 user
Pricing
Jet ReportsVizualSurvey
Editions & Modules
No answers on this topic
Free Plan (14 days)
$0.00
1 user
PROFESSIONAL (per year)
$816.00
1 user
CORPORATE (per year)
$1176.00
3 user
Custom (per year)
Custom
more user
Offerings
Pricing Offerings
Jet ReportsVizualSurvey
Free Trial
NoYes
Free/Freemium Version
NoNo
Premium Consulting/Integration Services
NoYes
Entry-level Setup FeeNo setup feeNo setup fee
Additional Details
More Pricing Information
Community Pulse
Jet ReportsVizualSurvey
Top Pros
Top Cons
Features
Jet ReportsVizualSurvey
BI Standard Reporting
Comparison of BI Standard Reporting features of Product A and Product B
Jet Reports
6.7
5 Ratings
20% below category average
VizualSurvey
8.3
3 Ratings
1% below category average
Pixel Perfect reports6.04 Ratings00 Ratings
Customizable dashboards8.04 Ratings8.33 Ratings
Report Formatting Templates6.05 Ratings8.33 Ratings
Ad-hoc Reporting
Comparison of Ad-hoc Reporting features of Product A and Product B
Jet Reports
7.0
5 Ratings
15% below category average
VizualSurvey
-
Ratings
Drill-down analysis8.05 Ratings00 Ratings
Formatting capabilities7.05 Ratings00 Ratings
Integration with R or other statistical packages5.03 Ratings00 Ratings
Report sharing and collaboration8.05 Ratings00 Ratings
Report Output and Scheduling
Comparison of Report Output and Scheduling features of Product A and Product B
Jet Reports
8.2
5 Ratings
2% below category average
VizualSurvey
-
Ratings
Publish to Web8.03 Ratings00 Ratings
Publish to PDF9.05 Ratings00 Ratings
Report Versioning8.05 Ratings00 Ratings
Report Delivery Scheduling9.05 Ratings00 Ratings
Delivery to Remote Servers7.02 Ratings00 Ratings
Data Discovery and Visualization
Comparison of Data Discovery and Visualization features of Product A and Product B
Jet Reports
7.7
2 Ratings
5% below category average
VizualSurvey
8.2
3 Ratings
0% above category average
Pre-built visualization formats (heatmaps, scatter plots etc.)8.02 Ratings8.03 Ratings
Location Analytics / Geographic Visualization8.02 Ratings8.33 Ratings
Predictive Analytics7.02 Ratings00 Ratings
Access Control and Security
Comparison of Access Control and Security features of Product A and Product B
Jet Reports
8.3
5 Ratings
4% below category average
VizualSurvey
-
Ratings
Multi-User Support (named login)7.05 Ratings00 Ratings
Role-Based Security Model9.05 Ratings00 Ratings
Multiple Access Permission Levels (Create, Read, Delete)9.05 Ratings00 Ratings
Single Sign-On (SSO)8.01 Ratings00 Ratings
Mobile Capabilities
Comparison of Mobile Capabilities features of Product A and Product B
Jet Reports
8.3
3 Ratings
4% above category average
VizualSurvey
-
Ratings
Responsive Design for Web Access8.01 Ratings00 Ratings
Mobile Application7.01 Ratings00 Ratings
Dashboard / Report / Visualization Interactivity on Mobile9.03 Ratings00 Ratings
Application Program Interfaces (APIs) / Embedding
Comparison of Application Program Interfaces (APIs) / Embedding features of Product A and Product B
Jet Reports
6.8
2 Ratings
15% below category average
VizualSurvey
-
Ratings
REST API7.02 Ratings00 Ratings
Javascript API6.02 Ratings00 Ratings
iFrames7.02 Ratings00 Ratings
Java API7.02 Ratings00 Ratings
Themeable User Interface (UI)7.02 Ratings00 Ratings
Customizable Platform (Open Source)7.02 Ratings00 Ratings
Best Alternatives
Jet ReportsVizualSurvey
Small Businesses
BrightGauge
BrightGauge
Score 8.9 out of 10
IBM SPSS Modeler
IBM SPSS Modeler
Score 7.8 out of 10
Medium-sized Companies
Reveal
Reveal
Score 9.9 out of 10
Mathematica
Mathematica
Score 8.2 out of 10
Enterprises
Jaspersoft Community Edition
Score 9.7 out of 10
IBM SPSS Modeler
IBM SPSS Modeler
Score 7.8 out of 10
All AlternativesView all alternativesView all alternatives
User Ratings
Jet ReportsVizualSurvey
Likelihood to Recommend
7.0
(5 ratings)
8.0
(3 ratings)
Usability
6.0
(1 ratings)
-
(0 ratings)
Support Rating
5.0
(1 ratings)
-
(0 ratings)
User Testimonials
Jet ReportsVizualSurvey
Likelihood to Recommend
Insightsoftware, Inc
Jet Reports is better suited if you have a specific population set you are looking at and less suited when querying or summing large pools or data, records, etc. I use a combination of Jet & SQL syntax when performing the latter because it allows me to harness the speed of our SQL server. Jet allows more for more customization when bodes better for users.
Read full review
VizualSurvey
Understanding customer experience, purchase behaviour, deciding factors, pricing points, delivery schedule, delivery speed, eagerness, acceptance, reciprocation to offers, reciprocation to price increases, results of an offer, results of market changes, factors behind purchase decision, and also employee feedback. All these various scenarios are well suited for the use of VisualSurvey.
Read full review
Pros
Insightsoftware, Inc
  • Integrated reporting
  • Customizable reports
  • Easy to use
Read full review
VizualSurvey
  • Being able to visualize our data gives us better insight into what works, and what doesn't
  • Allows us to create dashboards branded specifically to our individual clients
  • Super fast learning curve, easy to get everyone on board
Read full review
Cons
Insightsoftware, Inc
  • Tips and tricks
  • Sharing best practices from other companies
  • Online user forum
Read full review
VizualSurvey
  • Connecting dashboards and templates.
  • Prepping software data.
  • Need more how-to videos.
Read full review
Usability
Insightsoftware, Inc
Because it is not the costliest tool in this category but it serves the purpose. It is easy to use, cost effective, and works really well with the data stored on cloud. It has wide range of dashboard templates which go really well with different types of data sets. I would love to use it agains and again
Read full review
VizualSurvey
No answers on this topic
Support Rating
Insightsoftware, Inc
I hinestly have not used the support a lot but i have always had to way for longer durations to get a response on my emails. I have tried calling them a few times and the wait time was a little more than what i expected. They were able to answer my queries nonetheless
Read full review
VizualSurvey
No answers on this topic
Alternatives Considered
Insightsoftware, Inc
Jet Reports is light weight and has a minimal barrier to entry for new users. Tableau has a higher learning curve and is more cost prohibitive
Read full review
VizualSurvey
Google Data Studio has several problems with modifying data and the way we collect data is very basic and can be outdated sometimes. The visualizations are limited and the formatting is very restrictive. VizualSurvey is much better with data visualization and survey mechanisms where people respond better and we get a higher response rate.
Read full review
Return on Investment
Insightsoftware, Inc
  • Prediction analysis has helped the business to make future plans
  • Report scheduling has eliminated a lot of manual work
Read full review
VizualSurvey
  • Higher success rates with overall customer satisfaction leads to return customers
  • Customers are more trusting on larger projects based on the satisfaction of other customers
  • Able to more efficiently meet clients needs, leading to faster closings
Read full review
ScreenShots

Jet Reports Screenshots

Screenshot of Expense OverviewScreenshot of Finance Cash FlowScreenshot of Finance Income StatementScreenshot of Revenue and Cost OverviewScreenshot of Purchase AnalysisScreenshot of Revenue Analysis

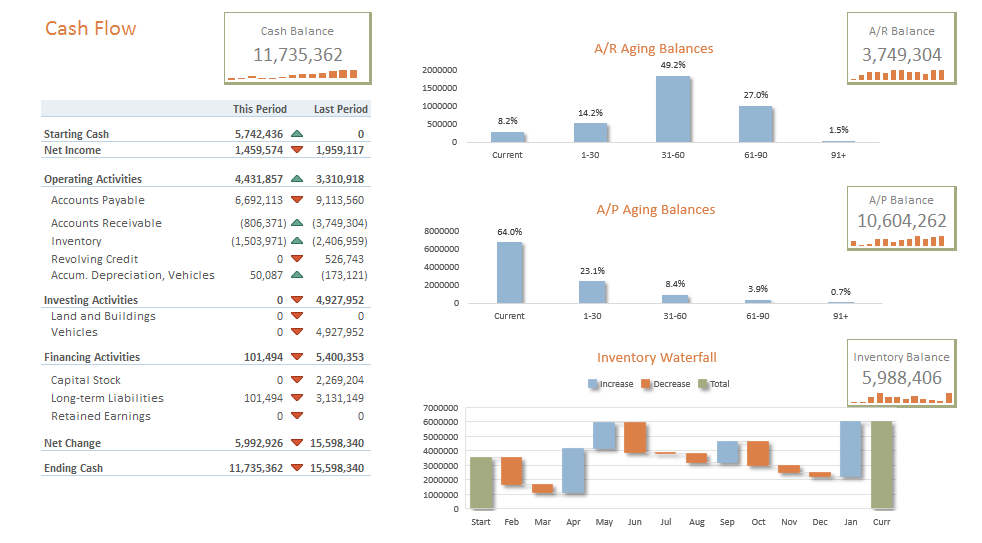
VizualSurvey Screenshots

Screenshot of Upload or Connect DataScreenshot of Prep DataScreenshot of Preview DataScreenshot of Visualization in TableauScreenshot of Visualization in Power BiScreenshot of Visualization in Spotfire