Lightning Tools Data Viewer vs. Tableau Desktop

Overview
ProductRatingMost Used ByProduct SummaryStarting Price
Lightning Tools Data Viewer
Score 9.1 out of 10
Mid-Size Companies (51-1,000 employees)
The Data Viewer provides data visualization in the form of reports or charts that can be created and customized to suit a business's needs. Silos of data exist in most organizations and yet contain valuable insights into how well the organization is performing and where action is needed. Those silos often include Microsoft Excel workbooks, Microsoft SQL Azure databases, On-Premises data sources accessible through OData or Business Connectivity Services and even SharePoint Lists. These data…
$2,200
per year per installation
Tableau Desktop
Score 8.3 out of 10
N/A
Tableau Desktop is a data visualization product from Tableau. It connects to a variety of data sources for combining disparate data sources without coding. It provides tools for discovering patterns and insights, data calculations, forecasts, and statistical summaries and visual storytelling.
$75
per month
Pricing
Lightning Tools Data ViewerTableau Desktop
Editions & Modules
Data Viewer OnPrem
$1,000
per year Per installation, 1 x WFE
Data Viewer Online
$2,200
per year per installation
Data Viewer OnPrem Enterprise Edition
POA
per year Per installation, 4+ WFE
Data Viewer Online Enterprise Edition
POA
per year per installation
Tableau
$75
per month per user
Tableau Enterprise
$115
per month per user
Offerings
Pricing Offerings
Lightning Tools Data ViewerTableau Desktop
Free Trial
YesNo
Free/Freemium Version
NoNo
Premium Consulting/Integration Services
YesYes
Entry-level Setup FeeNo setup feeNo setup fee
Additional DetailsPrices stated are minimum per installation for "stock" products. $2.20 per user / year on top of base price. Enterprise editions can be amended to suit business needs if deemed necessary, additional costs incurred and TBD. All packages include free technical support. Free upgrades available to latest versions of tool as they are released. (online version)All pricing plans are billed annually.
More Pricing Information
Community Pulse
Lightning Tools Data ViewerTableau Desktop
Features
Lightning Tools Data ViewerTableau Desktop
BI Standard Reporting
Comparison of BI Standard Reporting features of Product A and Product B
Lightning Tools Data Viewer
9.1
1 Ratings
12% above category average
Tableau Desktop
8.4
175 Ratings
3% above category average
Customizable dashboards9.11 Ratings9.1174 Ratings
Report Formatting Templates9.11 Ratings8.1151 Ratings
Pixel Perfect reports00 Ratings8.1145 Ratings
Ad-hoc Reporting
Comparison of Ad-hoc Reporting features of Product A and Product B
Lightning Tools Data Viewer
8.2
1 Ratings
5% above category average
Tableau Desktop
8.3
172 Ratings
4% above category average
Drill-down analysis6.41 Ratings8.5167 Ratings
Formatting capabilities9.11 Ratings8.4170 Ratings
Report sharing and collaboration9.11 Ratings8.5165 Ratings
Integration with R or other statistical packages00 Ratings8.0126 Ratings
Data Discovery and Visualization
Comparison of Data Discovery and Visualization features of Product A and Product B
Lightning Tools Data Viewer
3.6
1 Ratings
73% below category average
Tableau Desktop
8.3
164 Ratings
4% above category average
Pre-built visualization formats (heatmaps, scatter plots etc.)3.61 Ratings8.5162 Ratings
Location Analytics / Geographic Visualization00 Ratings8.5156 Ratings
Predictive Analytics00 Ratings8.6131 Ratings
Pattern Recognition and Data Mining00 Ratings7.57 Ratings
Report Output and Scheduling
Comparison of Report Output and Scheduling features of Product A and Product B
Lightning Tools Data Viewer
-
Ratings
Tableau Desktop
8.3
166 Ratings
1% above category average
Publish to Web00 Ratings8.0155 Ratings
Publish to PDF00 Ratings8.0154 Ratings
Report Versioning00 Ratings8.3120 Ratings
Report Delivery Scheduling00 Ratings8.6128 Ratings
Delivery to Remote Servers00 Ratings8.778 Ratings
Access Control and Security
Comparison of Access Control and Security features of Product A and Product B
Lightning Tools Data Viewer
-
Ratings
Tableau Desktop
8.9
149 Ratings
5% above category average
Multi-User Support (named login)00 Ratings9.0145 Ratings
Role-Based Security Model00 Ratings8.9125 Ratings
Multiple Access Permission Levels (Create, Read, Delete)00 Ratings8.7136 Ratings
Report-Level Access Control00 Ratings9.010 Ratings
Single Sign-On (SSO)00 Ratings9.283 Ratings
Mobile Capabilities
Comparison of Mobile Capabilities features of Product A and Product B
Lightning Tools Data Viewer
-
Ratings
Tableau Desktop
7.9
141 Ratings
2% above category average
Responsive Design for Web Access00 Ratings8.7130 Ratings
Mobile Application00 Ratings7.3101 Ratings
Dashboard / Report / Visualization Interactivity on Mobile00 Ratings7.5122 Ratings
Application Program Interfaces (APIs) / Embedding
Comparison of Application Program Interfaces (APIs) / Embedding features of Product A and Product B
Lightning Tools Data Viewer
-
Ratings
Tableau Desktop
7.9
67 Ratings
3% above category average
REST API00 Ratings8.259 Ratings
Javascript API00 Ratings7.853 Ratings
iFrames00 Ratings7.151 Ratings
Java API00 Ratings8.448 Ratings
Themeable User Interface (UI)00 Ratings7.654 Ratings
Customizable Platform (Open Source)00 Ratings8.148 Ratings
Best Alternatives
Lightning Tools Data ViewerTableau Desktop
Small Businesses
Supermetrics
Supermetrics
Score 9.9 out of 10
Yellowfin
Yellowfin
Score 8.8 out of 10
Medium-sized Companies
Supermetrics
Supermetrics
Score 9.9 out of 10
Reveal
Reveal
Score 10.0 out of 10
Enterprises
IBM Analytics Engine
Score 8.5 out of 10
Kyvos Semantic Layer
Score 9.5 out of 10
All AlternativesView all alternativesView all alternatives
User Ratings
Lightning Tools Data ViewerTableau Desktop
Likelihood to Recommend
9.1
(1 ratings)
8.6
(204 ratings)
Likelihood to Renew
-
(0 ratings)
7.5
(41 ratings)
Usability
-
(0 ratings)
8.2
(73 ratings)
Availability
-
(0 ratings)
10.0
(11 ratings)
Performance
-
(0 ratings)
8.0
(10 ratings)
Support Rating
-
(0 ratings)
1.0
(57 ratings)
In-Person Training
-
(0 ratings)
9.4
(4 ratings)
Online Training
-
(0 ratings)
8.0
(5 ratings)
Implementation Rating
-
(0 ratings)
8.0
(34 ratings)
Configurability
-
(0 ratings)
7.0
(3 ratings)
Ease of integration
-
(0 ratings)
10.0
(1 ratings)
Product Scalability
-
(0 ratings)
9.0
(4 ratings)
Vendor post-sale
-
(0 ratings)
10.0
(1 ratings)
Vendor pre-sale
-
(0 ratings)
10.0
(1 ratings)
User Testimonials
Lightning Tools Data ViewerTableau Desktop
Likelihood to Recommend
Lightning Tools
Lightning Tools Data Viewer is well suited for re-surfacing data and customizing its look and feel.
Read full review
Tableau
The best scenario is definitely to collect data from several sources and create dedicated dashboards for specific recipients. However, I miss the possibility of explaining these reports in more detail. Sometimes, we order a report, and after half a year, we don't remember the meaning of some data (I know it's our fault as an organization, but the tool could force better practices).
Read full review
Pros
Lightning Tools
  • Shows Lists created on different sites to be seen and controlled on another site in a Tenant
  • Allows selection of layouts and coloring way beyond what other programs do.
  • Easy to learn and very functional.
Read full review
Tableau
  • An excellent tool for data visualization, it presents information in an appealing visual format—an exceptional platform for storing and analyzing data in any size organization.
  • Through interactive parameters, it enables real-time interaction with the user and is easy to learn and get support from the community.
Read full review
Cons
Lightning Tools
  • Data Viewer has a graph feature that is old school flat design. We loved the In House real 3D graph Lightning Tools program.
Read full review
Tableau
  • Pricing should be more user-friendly and usage-driven
  • Making edits to the production reports is fairly tough and has a vast scope of additional capabilities
  • Tableau Desktop should be able to differentiate itself from the Tableau server else there is no major meaning of two different products being offered
Read full review
Likelihood to Renew
Lightning Tools
No answers on this topic
Tableau
Our use of Tableau Desktop is still fairly low, and will continue over time. The only real concern is around cost of the licenses, and I have mentioned this to Tableau and fully expect the development of more sensible models for our industry. This will remove any impediment to expansion of our use.
Read full review
Usability
Lightning Tools
No answers on this topic
Tableau
Tableau Desktop has proven to be a lifesaver in many situations. Once we've completed the initial setup, it's simple to use. It has all of the features we need to quickly and efficiently synthesize our data. Tableau Desktop has advanced capabilities to improve our company's data structure and enable self-service for our employees.
Read full review
Reliability and Availability
Lightning Tools
No answers on this topic
Tableau
When used as a stand-alone tool, Tableau Desktop has unlimited uptime, which is always nice. When used in conjunction with Tableau Server, this tool has as much uptime as your server admins are willing to give it. All in all, I've never had an issue with Tableau's availability.
Read full review
Performance
Lightning Tools
No answers on this topic
Tableau
Tableau Desktop's performance is solid. You can really dig into a large dataset in the form of a spreadsheet, and it exhibits similarly good performance when accessing a moderately sized Oracle database. I noticed that with Tableau Desktop 9.3, the performance using a spreadsheet started to slow around 75K rows by about 60 columns. This was easily remedied by creating an extract and pushing it to Tableau Server, where performance went to lightning fast
Read full review
Support Rating
Lightning Tools
No answers on this topic
Tableau
Tableau support has been extremely responsive and willing to help with all of our requests. They have assisted with creating advanced analysis and many different types of custom icons, data formatting, formulas, and actions embedded into graphs. Tableau offers a weekly presentation of features and assists with internal company projects.
Read full review
In-Person Training
Lightning Tools
No answers on this topic
Tableau
It is admittedly hard to train a group of people with disparate levels of ability coming in, but the software is so easy to use that this is not a huge problem; anyone who can follow simple instructions can catch up pretty quickly.
Read full review
Online Training
Lightning Tools
No answers on this topic
Tableau
I think the training was good overall, but it was maybe stating the obvious things that a tech savvy young engineer would be able to pick up themselves too. However, the example work books were good and Tableau web community has helped me with many problems
Read full review
Implementation Rating
Lightning Tools
No answers on this topic
Tableau
Again, training is the key and the company provides a lot of example videos that will help users discover use cases that will greatly assist their creation of original visualizations. As with any new software tool, productivity will decline for a period. In the case of Tableau, the decline period is short and the later gains are well worth it.
Read full review
Alternatives Considered
Lightning Tools
Lightning Tools Data Viewer is much easier and more powerful than Infowise similar viewer in their lineup. In this case, we use Data Viewer over the one offered by Infowise.
Read full review
Tableau
I have used Power BI as well, the pricing is better, and also training costs or certifications are not that high. Since there is python integration in Power BI where I can use data cleaning and visualizing libraries and also some machine learning models. I can import my python scripts and create a visualization on processed data.
Read full review
Scalability
Lightning Tools
No answers on this topic
Tableau
Tableau Desktop's scaleability is really limited to the scale of your back-end data systems. If you want to pull down an extract and work quickly in-memory, in my application it scaled to a few tens of millions of rows using the in-memory engine. But it's really only limited by your back-end data store if you have or are willing to invest in an optimized SQL store or purpose-built query engine like Veritca or Netezza or something similar.
Read full review
Return on Investment
Lightning Tools
  • It allows us to do things that would take a great deal more time to duplicate in SharePoint
  • It cuts down on ugly looking built in SP list layouts
  • Users find it easy to access, thus this product is more productive
Read full review
Tableau
  • Tableau was acquired years ago, and has provided good value with the content created.
  • Ongoing maintenance costs for the platform, both to maintain desktop and server licensing has made the continuing value questionable when compared to other offerings in the marketplace.
  • Users have largely been satisfied with the content, but not with the overall performance. This is due to a combination of factors including the performance of the Tableau engines as well as development deficiencies.
Read full review
ScreenShots

Lightning Tools Data Viewer Screenshots
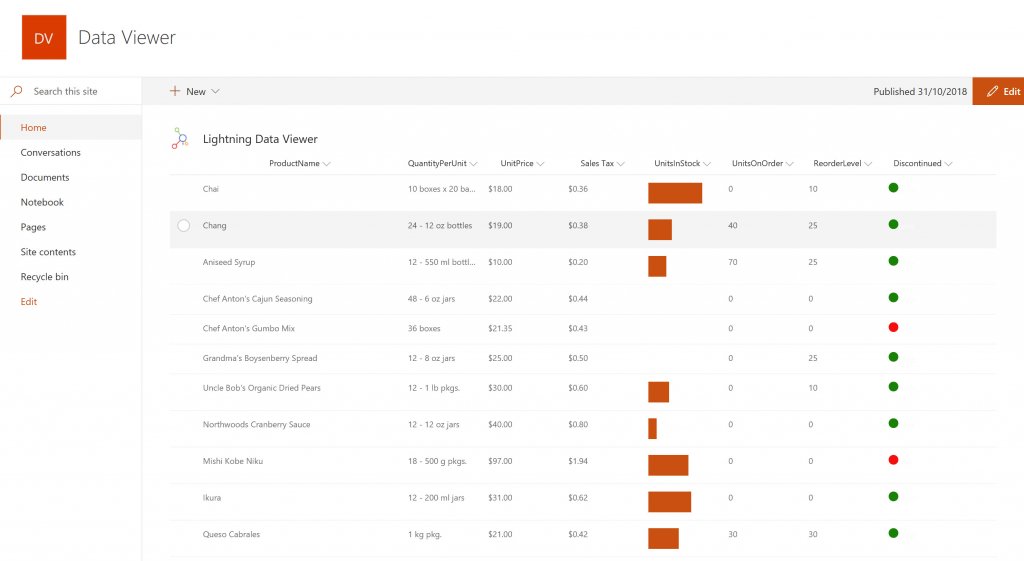
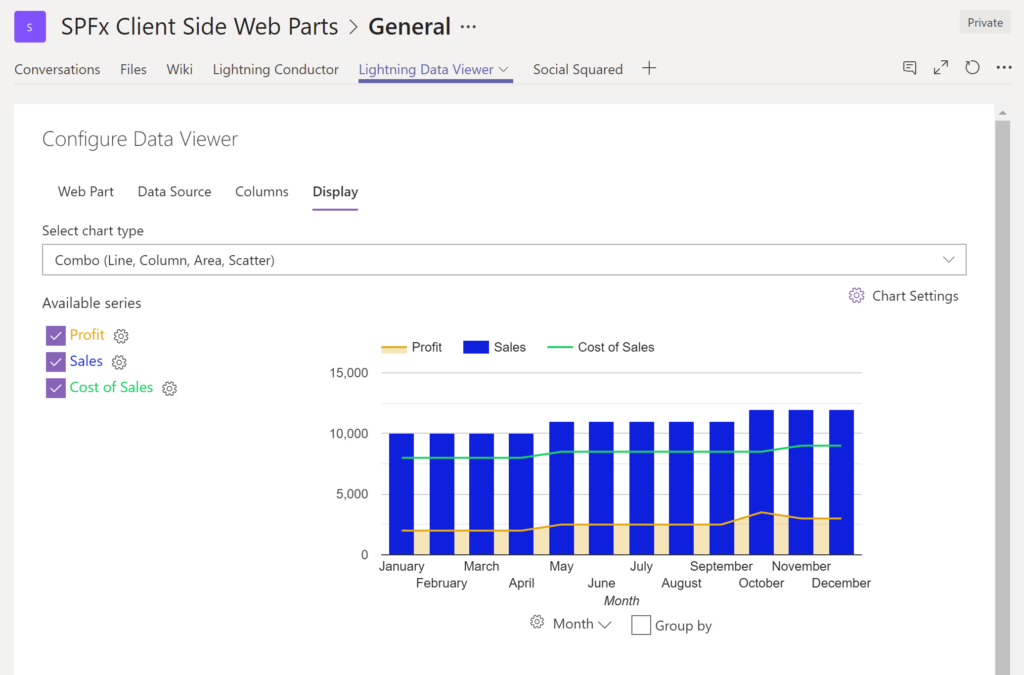
Screenshot of DISPLAYING EXTERNAL DATA WITHIN SHAREPOINT OR MICROSOFT TEAMS
The Data Viewer Client Side Web Part can be configured by Business Users within a few minutes to display Line of Business Data from Data Sources such as Excel,  SQL Azure, Business Connectivity Services, OData and SharePoint Lists.  Connections to an organizations data such as Customer Relationship Management Systems, Accounting Systems, or Custom Databases can be connected, giving business users a live up-to-date view of business information within the context of their SharePoint Team Sites or Microsoft Teams Tabs.Screenshot of HIGHLIGHTING KEY BUSINESS DATA (NO CODE)
Conditional formatting can be used to highlight key business data. Overdue Tasks, Low Stock, Currency Exchange Rates, Sales Revenue are examples of data to highlight visually allowing for a quick reaction time. Key Financial Indicators and Key Performance Indicators can be configured with a simple dialog and no need to write any code. Choose colours, icons or data bars to highlight key data.Screenshot of SELECTING AND STYLING ICONS
Icons can be chosen as part of the conditional formatting to make data stand out. The Office 365 Fabric icons can be selected and styled and applied to cell values. Pepper pots, Smileys, Envelopes and more icons are available. There are hundreds of options to choose from to highlight data that needs to be acted upon.Screenshot of DATA VIEWER CAN BE A GRID OF DATA OR A CHART IN SHAREPOINT OR MICROSOFT TEAMS
The Data Viewer can be used within Microsoft SharePoint Modern Sites or Microsoft Teams Tabs as a Grid of Data with styling or as a Chart which can be configured. The Charting Feature allows for Pie, Donut, Column, Line, Area, and Scatter Charts which can all be configured and displayed in 2D or 3D.Screenshot of TREEMAPS
summary information can be displayed within a TreeMap next to the detail. Users will be able to see trends, and how the business is performing  using the TreeMap view of data.Screenshot of CHARTS AND GAUGES
The Data Viewer is used to represent data in multiple ways using Gauges, TreeMaps, Multiple Series Charts, and Pie Charts.