Looker Studio vs. Toucan
Looker Studio vs. Toucan
| Product | Rating | Most Used By | Product Summary | Starting Price |
|---|---|---|---|---|
 Looker Studio | N/A | Looker Studio is a data visualization platform that transforms data into meaningful presentations and dashboards with customized reporting tools. | $9 per month per user per project | |
 Toucan | N/A | Toucan Toco, from the company of the same name headquartered in France, is an embedded BI solution that communicates contextualised and actionable insights to untrained business users, no matter their data literacy levels or device used, and without the need for training, coding or design skills, or hardware requirements. | N/A |
| Looker Studio | Toucan | |||||||||||||||
|---|---|---|---|---|---|---|---|---|---|---|---|---|---|---|---|---|
| Editions & Modules |
| No answers on this topic | ||||||||||||||
| Offerings |
| |||||||||||||||
| Entry-level Setup Fee | No setup fee | Optional | ||||||||||||||
| Additional Details | — | — | ||||||||||||||
| More Pricing Information | ||||||||||||||||
| Looker Studio | Toucan |
|---|
| Looker Studio | Toucan | ||||||||||||||||||
|---|---|---|---|---|---|---|---|---|---|---|---|---|---|---|---|---|---|---|---|
| BI Standard Reporting |
| ||||||||||||||||||
| Ad-hoc Reporting |
| ||||||||||||||||||
| Report Output and Scheduling |
| ||||||||||||||||||
| Data Discovery and Visualization |
|
| Looker Studio | Toucan | |
|---|---|---|
| Small Businesses |  Supermetrics Score 9.7 out of 10 |  Yellowfin Score 8.7 out of 10 |
| Medium-sized Companies | Supermetrics Score 9.7 out of 10 |  Reveal Score 10.0 out of 10 |
| Enterprises |  IBM Analytics Engine Score 7.1 out of 10 |  Infor Birst Score 6.4 out of 10 |
| All Alternatives | View all alternatives | View all alternatives |
| Looker Studio | Toucan | |
|---|---|---|
| Likelihood to Recommend | 8.6 (56 ratings) | 7.0 (1 ratings) |
| Likelihood to Renew | 9.0 (1 ratings) | - (0 ratings) |
| Usability | 8.5 (7 ratings) | - (0 ratings) |
| Support Rating | 6.7 (10 ratings) | 10.0 (1 ratings) |
| Looker Studio | Toucan | |
|---|---|---|
| Likelihood to Recommend | Google
 Jake Bodmer Mentor | Toucan
 Kathleen Paluso Director, Customer Success & Implementation |
| Pros | Google
| Toucan
Kathleen Paluso Director, Customer Success & Implementation |
| Cons | Google
| Toucan
Kathleen Paluso Director, Customer Success & Implementation |
| Likelihood to Renew | Google
 Janaye Steadman Director of Social Media | Toucan No answers on this topic |
| Usability | Google
| Toucan No answers on this topic |
| Support Rating | Google
 Jordan Comstock Digital Marketing Specialist | Toucan
Kathleen Paluso Director, Customer Success & Implementation |
| Alternatives Considered | Google
 Shelby Kolb Data Analyst | Toucan No answers on this topic |
| Return on Investment | Google
 Scott Walker Director of Digital Marketing | Toucan
Kathleen Paluso Director, Customer Success & Implementation |
| ScreenShots | Toucan Screenshots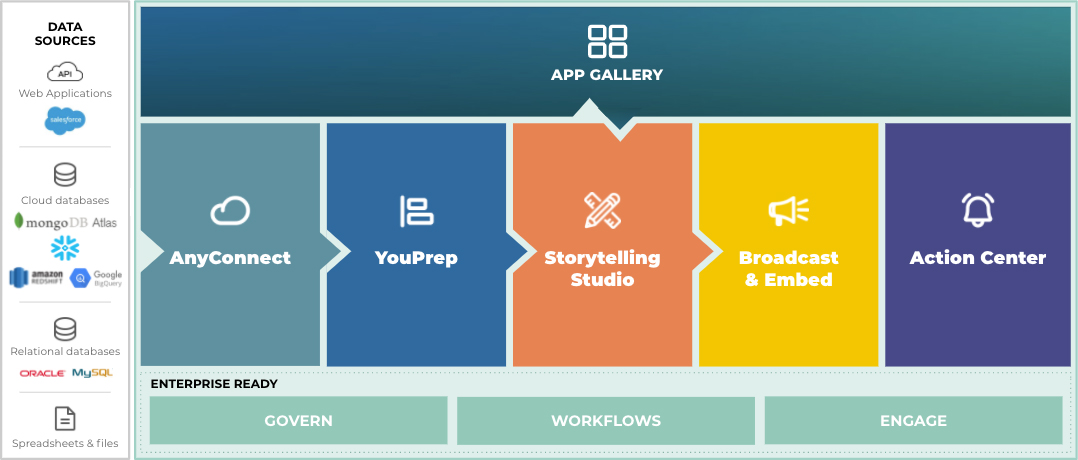   |