Microsoft BI is a business intelligence product used for data analysis and generating reports on server-based data. It features unlimited data analysis capacity with its reporting engine, SQL Server Reporting Services alongside ETL, master data management, and data cleansing.
$14
per month per user
CommUnity by Personify
Score 10.0 out of 10
N/A
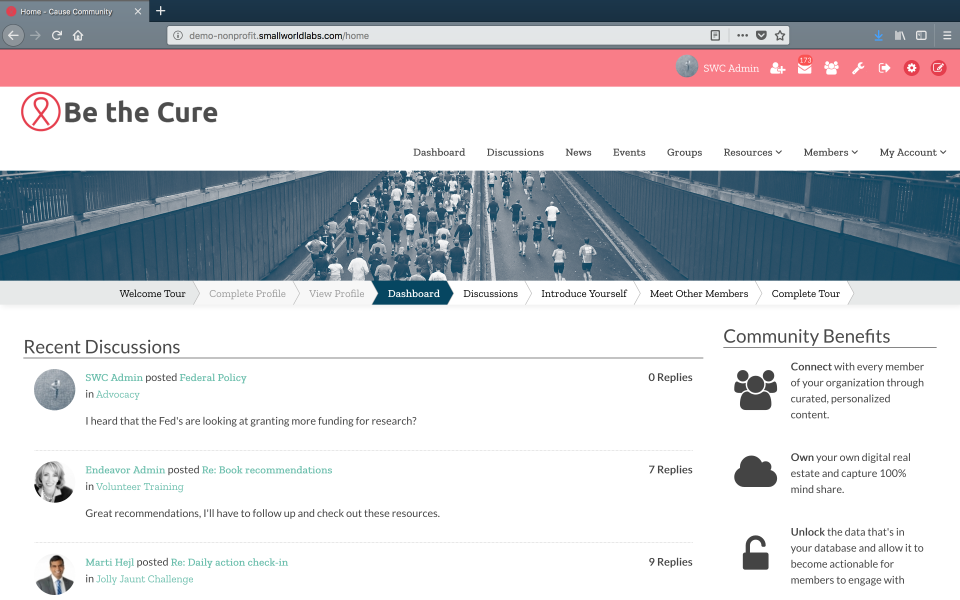
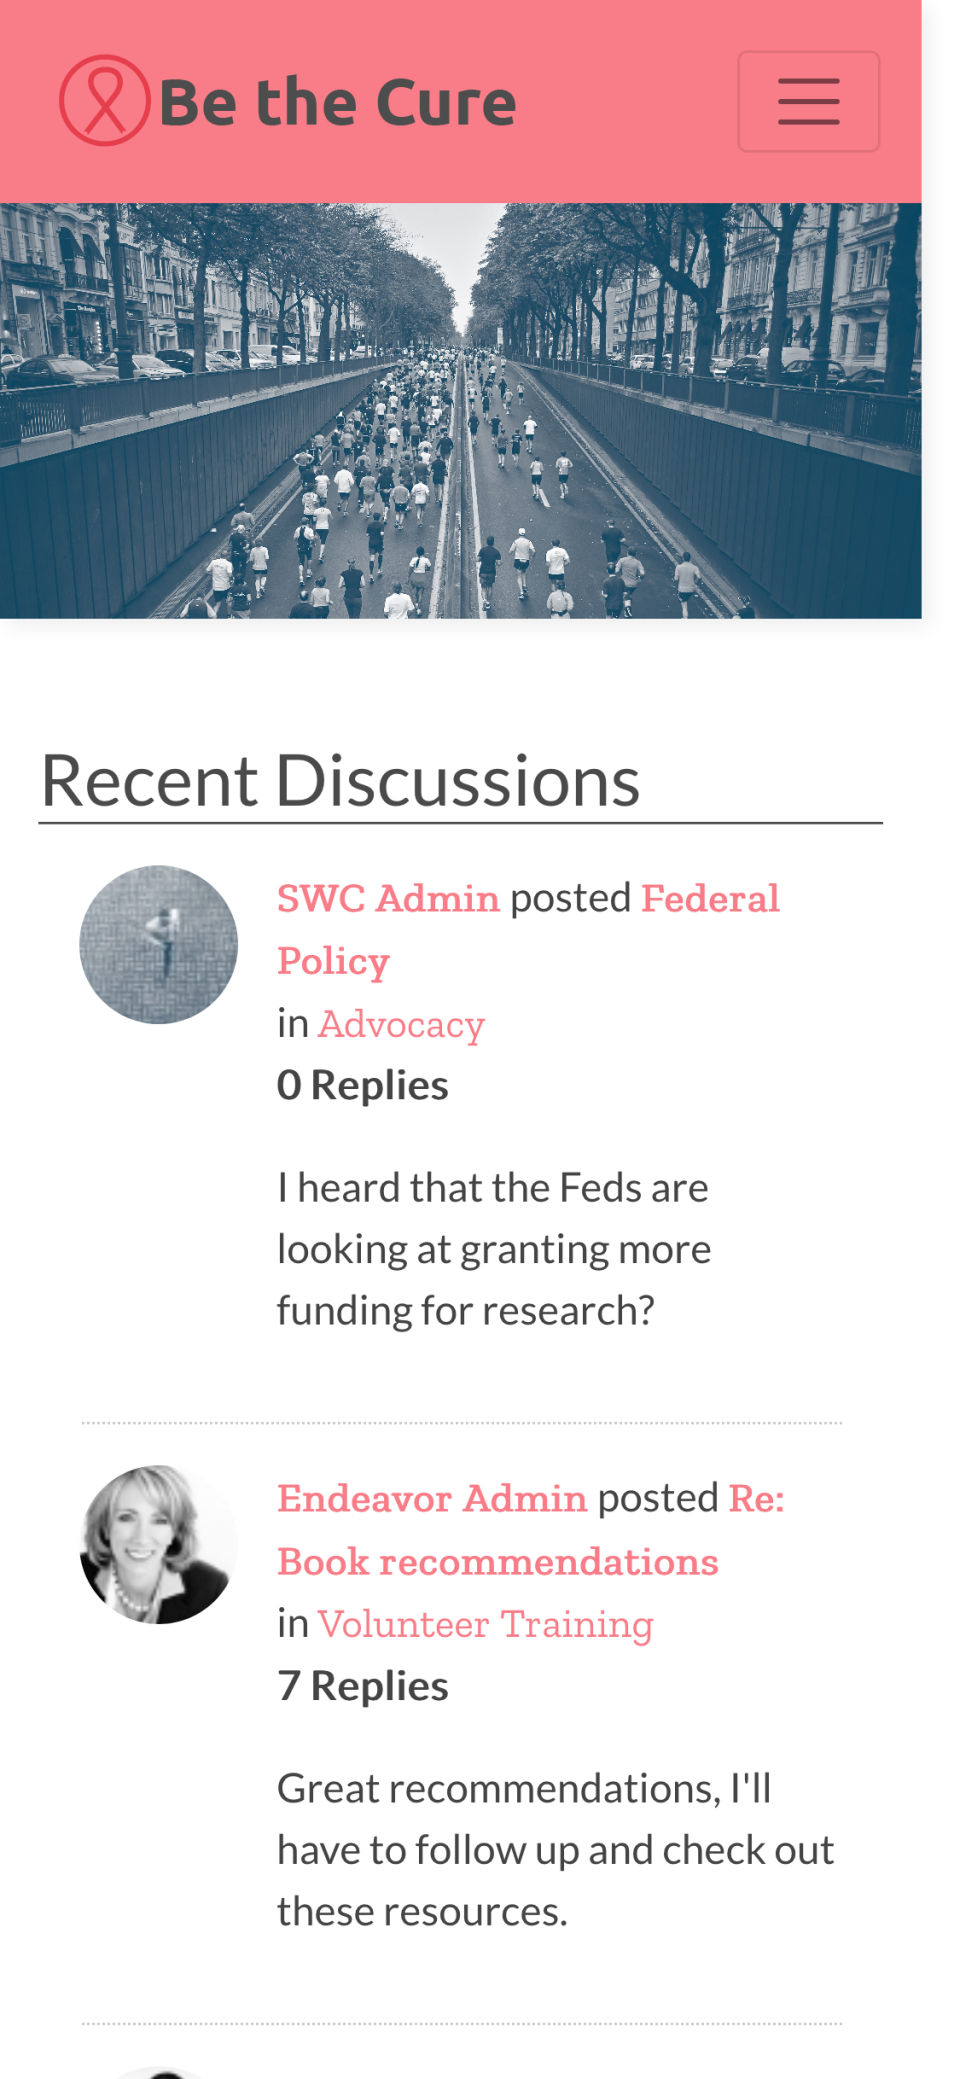
Small World Labs Community is a hosted collaboration and social networking platform with easy drag & drop modification capabilities. Small World Labs offers implementation and community engagement services, plus an open API for integration with other systems. Small World Labs has clients across industries, but a high concentration in the nonprofit area.
Small World Labs was acquired by Personify Corp in 2016.
N/A
QlikView
Score 8.1 out of 10
N/A
QlikView® is Qlik®’s original BI offering designed primarily for shared business intelligence reports and data visualizations. It offers guided exploration and discovery, collaborative analytics for sharing insight, and agile development and deployment.
N/A
Pricing
Microsoft BI (MSBI)
CommUnity by Personify
QlikView
Editions & Modules
Power BI Pro
$14
per month per user
Power BI Premium
$24
per month per user
No answers on this topic
QlikView
Custom
per user
Offerings
Pricing Offerings
Microsoft BI (MSBI)
CommUnity by Personify
QlikView
Free Trial
No
No
Yes
Free/Freemium Version
Yes
No
No
Premium Consulting/Integration Services
No
No
Yes
Entry-level Setup Fee
No setup fee
No setup fee
Optional
Additional Details
—
—
On an perpetual license basis, based on server plus number of users.
Contact vendor for pricing.
Specific data displays are some of the strongest aspects of Microsoft BI when compared to alternate programs. It also does a superior job in compatibility with many programs, especially those from Microsoft. Since my company primarily uses Office 365 and other Microsoft …
The software stacks [well] because it has more graphics resolution and the colors are fresh and actualized. On the other hand, there is the Microsoft family software and this is an advantage. Microsoft has a lot of users around the world and it's like everyone knows how to do …
One of the main reasons Microsoft BI was chosen by our company is because it is a reliable program. We tried different programs in the past (and currently also use other ones for certain reporting and analysis needs) but Microsoft BI was the least buggy out of our top choices.
I was forced into QV by QuickBooks -- I did not have the opportunity to evaluate it specifically against other packages. I have, however, seen Microsoft BI and BIRST --- both of which seem much more expensive (and perhaps complex) than QlikView. But I'm conjecturing a bit here.
Microsoft BI is well suited for Stream analytics, easy data integration, report creation and UI/UX designs (limited but what all available are great ones) Microsoft BI may be less appropriate for handling huge number of datasets and difficult queries. It may also be difficult for a company with heavy data.
You can tell from the CEO and all staff that this is a very competent company that wants you to succeed with integrity. There is a strong support and services team that works collaboratively with us to make sure we are always getting what we need. They provide 24x7 emergency support, online ticket support, email support, a client community, and the ability to call and talk to the same account manager or community consultant every time (I even have Mariano's skype and he replies on weekends!). They recently launched a client community - so they are now even practicing what they preach. Our questions in the client community are always answered quickly.
Sales data validations have helped manage our justifications in the past, especially with regard to new product development and new business introduction. It has also been helpful in identifying trends with business impact and direction specific to quarter and monthly sales from ERP data as well as decisions to purchase equipment of staffing based on run rates and product demand.
One thing that can get out of hand is data output - if you aren't careful in your query, you may be overloaded with data dumps and drown in the amount of info you have to filter through. This is a user caution, not a comment on the software itself.
It's easy to use. The admin panel has a number of drag and drop options to modify the experience
Flexibility. There are a large number of standard block features that can be added to areas. In addition, each dynamic block as a number of settings that allow you to tailor the experience you want to create. You can do this without being a programmer.
Personalization. There are good tools that allow you to personalize the experience based on whether users are logged in or not, whether they are in particular segments (which we can create) or recommendations based on information the user has provided about themselves.
Mobile. Small World Labs has a really great way of doing mobile. They give you a drag and drop interface for designing the mobile environment so there is a lot of flexibility with this. We are currently turning this module on.
The race to perfect gathering of Non-Traditional datasets is on-going; with Microsoft arguably not the leader of the pack in this category.
Licensing options for PowerBI visualizations may be a factor. I.e. if you need to implement B2C PowerBI visualizations, the cost is considerably high especially for startups.
Some clients are still resistant putting their data on the cloud, which restricts lots of functionality to Power BI.
Integration with our Association Management System (AMS) didn't go as smoothly as I had wished. Having said that all of the issues with that integration have been addressed.
Because the platform is updated so frequently you need to stay on top of what is available to you and your end users or you may miss out on key functionality releases.
We found that QlikView can be a bit slow in supporting some forms of encryption. It is web-based and we needed to upgrade all of our server to not support the older SSL and TLS 1 protocols, only support TLS 1.2 and TLS 1.3. However, QlikView could not run with TLS 1.2 and TLS 1.3. We had to wait over six months to get a version that would handle the newer TLS versions.
There are so many options with QlikView that you can get lost when developing a visualization. There are still items I have not yet figured out, such as labeling a graph with the name of a selected detail item.
QlikView works by pulling the data it is going to use for visualization into its database. I am a security reviewer and I need to make certain that PII and PHI is not pulled by QlikView for a visualization, otherwise this could become a reportable indecent.
Microsoft BI is fundamental to our suite of BI applications. That being said, Northcraft Analytics is focused on delighting our customers, so if the underlying factors of our decision change, we would choose to re-write our BI applications on a different stack. Luckily, mathematics are the fundamental IP of our technology... and is portable across all BI platforms for the foreseeable future.
From the first conversation and beyond, it has been a pleasure working with Small World Labs. Their staff are genuinely interested in understanding our business and our goals, and actively make recommendation on continued improvement and long-term strategy. All of their staff demonstrate a clear understanding of the product and when to expect new features. Furthermore, their CEO, Michael Wilson, is more than competent and has proven to be an industry expert. He understands both the technical side and the community strategy side of the business. In fact, we have already initiated a project to build a second community with Small World Labs for a separate business unit
Ease of use, ability to load from pretty much any data source. today I created an application that loaded time sheets from excel that are not in a table format. With Qlik's "enable transformation steps" I was able to automate loads of multiple spreadsheets and multiple tabs easily. Could not do that with any other tool.
The Microsoft BI tools have great usability for both developers and end users alike. For developers familiar with Visual Studio, there is little learning curve. For those not, the single Visual Studio IDE means not having to learn separate tools for each component. For end-users, the web interface for SSRS is simple to navigate with intuitive controls. For ad-hoc analysis, Excel can connect directly to SSAS and provide a pivot table like experience which is familiar to many users. For database development, there is beginning to be some confusion, as there are now three tool choices (VS, SSMS, Azure Data Studio) for developers. I would like to see Azure Data Studio become the superset of SSMS and eventually supplant it.
QlikView is very easy to implement. The installation is very straight forward. QlikView has several different data connectors that can connect to different data sources very smoothly. The user interface to build the reports is very easy to understand. This helps to have a smaller learning curve. Something very helpful is that QlikView is a browser application for the end users. So, you don't need to install any applications on the user's computer.
SQL Server Reporting Services (SSRS) can drag at times. We created two report servers and placed them under an F5 load balancer. This configuration has worked well. We have seen sluggish performance at times due to the Windows Firewall.
While support from Microsoft isn't necessarily always best of breed, you're also not paying the price for premium support that you would on other platforms. The strength of the stack is in the ecosystem that surrounds it. In contrast to other products, there are hundreds, even thousands of bloggers that post daily as well as vibrant user communities that surround the tool. I've had much better luck finding help with SQL Server related issues than I have with any other product, but that help doesn't always come directly from Microsoft.
The people at Small World Labs are very accessible. I can email, open a ticket, or call and they are there. I'd also point out that senior management is quite available too. We frequently have talks about potential strategies and new things we might be doing, which is great. I think the whole organization genuinely likes what they do and likes helping us succeed.
My experience with the Qlik support team has been somewhat limited, but every interaction I have had with them has been very professional and I received a response quickly. Typically if there is a technical issue, our IT team will follow up. My inquiries are specific to product functionality, and Qlik has been very helpful in clarifying any questions I might have.
In-person training is more ad-hoc based on if they are traveling to you or you are going to visit them. I imagine that if I paid for in-person training that it would be set up as well, but I've just used the standard training that comes with the initial set up and ongoing support.
My team attended, but I cannot myself rate, but I think it was good as they've successfully launched a training program at our company themselves for users. It was 3-4 day training.
I have used on-line training from Microsoft and from Pragmatic Works. I would recommend Pragmatic Works as the best way to get up to speed quickly, and then use the Microsoft on-line training to deep dive into specific features that you need to get depth with.
Training was as expected. The demo environments tend to be more fully featured that our own environment, but the training was clear and well delivered.
We are a consulting firm and as such our best resources are always billing on client projects. Our internal implementation has weaknesses, but that's true for any company like ours. My rating is based on the product's ease of implementation.
We had staff turnover at our own organization during the implementation. We were able to get the community up and live in a good timeframe even though that happened and we had to switch some people around for managing the project on our side.
"Implementation" can mean a few things... so I'm not sure that this is the answer you want.... but here it goes: To me, implementation means: "Is the user interface intuitive and can I produce meaningful reports with ease?" On that score, I'd say YES. The amount of training required was minimal and the results were powerful. The desktop implementation is a simple, "blank" interface just waiting for your creativity. The pre-populated templates give you a reasonable start to any project -- and a good set of objects to "play around with" if you're just getting started. Finally, note that the "implementation" I used was baked into QuickBooks 2016 Enterprise -- called "Advanced Reporting"..... That integration makes it ultra useful and simple.
We have used the built in ConnectWise Manager reports and custom reports. The reports provide static data. PowerBI shows us live data we can drill down into and easily adjust parameters. It's much more useful than a static PDF report.
We evaluated a few different community platform vendors over the course of a couple of months. I believe we also evaluated Jive, Lithium, KickApps, and Powered.
The only other vendor product that I have worked with that provides a similar experience to Qlikview is Tableau. I would recommend Tableau if your use case is to build a fixed dashboard. You can share reports for free without needing to buy additional licenses. I would recommend Qlikview if your users are looking for a more interactive experience. They can create new objects to represent the data which can't be accomplished as easily in Tableau
As a SaaS provider we see being able to provide self-service BI to our client users as a competitive advantage. In fact the MSSQL enabled BI is a contributing factor to many winning RFPs we have done for prospective client organisations.
However MSSQL BI requires extensive knowledge and skills to design and develop data warehouses & data models as a foundation to support business analysts and users to interrogate data effectively and efficiently. Often times we find having strong in-house MSSQL expertise is a bless.
Our community has been very active since the re-launch of our site. Have seen some increases in member engagement.
Feedback from our membership has been nothing but positive since we transitioned off of our older Sharepoint community. Look and feel and ease of use have been real pluses for our members.
Having the Small World Labs community is allowing us to be more creative with the way we integrate our community into all aspects of our online presence, web-site, social media, etc.
You can use the free desktop version to do a lot of reporting and analysis work more quickly so the ROI is huge
QlikView is great at finding outliers such as data entry errors
QlikView is great at helping you quickly discover new insights about your business that can prompt you to take action that can immediately affect your cash flow.