Microsoft System Center Operations Manager (SCOM) vs. SolarWinds Database Performance Monitor

Overview
ProductRatingMost Used ByProduct SummaryStarting Price
Microsoft System Center Operations Manager (SCOM)
Score 7.3 out of 10
N/A
Microsoft's System Center Operations Manager (SCOM) is a monitoring and application performance management option, with the core datacenter and cloud-based systems monitoring.N/A
SolarWinds Database Performance Monitor
Score 8.9 out of 10
N/A
VividCortex, acquired by SolarWinds in December 2019, provides database performance monitoring designed to increase system performance, team efficiency, and infrastructure cost savings. The GDPR- and SOC 2-compliant platform offers visibility into major open-source databases—MySQL, PostgreSQL, Amazon Aurora, MongoDB, and Redis—for the engineering team at scale. Industry leaders like Etsy, GitHub, SendGrid, and Yelp rely on Database Performance Monitor for all-query monitoring and drill…N/A
Pricing
Microsoft System Center Operations Manager (SCOM)SolarWinds Database Performance Monitor
Editions & Modules
No answers on this topic
Offerings
Pricing Offerings
Microsoft System Center Operations Manager (SCOM)SolarWinds Database Performance Monitor
Free Trial
NoYes
Free/Freemium Version
NoNo
Premium Consulting/Integration Services
NoYes
Entry-level Setup FeeNo setup feeNo setup fee
Additional Details
More Pricing Information
Community Pulse
Microsoft System Center Operations Manager (SCOM)SolarWinds Database Performance Monitor
Top Pros
Top Cons
Features
Microsoft System Center Operations Manager (SCOM)SolarWinds Database Performance Monitor
Application Performance Management
Comparison of Application Performance Management features of Product A and Product B
Microsoft System Center Operations Manager (SCOM)
6.1
22 Ratings
22% below category average
SolarWinds Database Performance Monitor
-
Ratings
Application monitoring5.020 Ratings00 Ratings
Database monitoring9.022 Ratings00 Ratings
Threshold alerts10.022 Ratings00 Ratings
Predictive capabilities2.020 Ratings00 Ratings
Application performance management console3.019 Ratings00 Ratings
Collaboration tools6.017 Ratings00 Ratings
Out-of-the box templates to monitor applications4.020 Ratings00 Ratings
Application dependency mapping and thresholding4.018 Ratings00 Ratings
Virtualization monitoring7.020 Ratings00 Ratings
Server availability and performance monitoring10.021 Ratings00 Ratings
Server usage monitoring and capacity forecasting8.021 Ratings00 Ratings
IT Asset Discovery5.018 Ratings00 Ratings
Best Alternatives
Microsoft System Center Operations Manager (SCOM)SolarWinds Database Performance Monitor
Small Businesses
GitLab
GitLab
Score 8.9 out of 10

No answers on this topic

Medium-sized Companies
ManageEngine Site24x7
Score 9.3 out of 10
Redgate SQL Monitor
Redgate SQL Monitor
Score 8.2 out of 10
Enterprises
ManageEngine Site24x7
Score 9.3 out of 10
Redgate SQL Monitor
Redgate SQL Monitor
Score 8.2 out of 10
All AlternativesView all alternativesView all alternatives
User Ratings
Microsoft System Center Operations Manager (SCOM)SolarWinds Database Performance Monitor
Likelihood to Recommend
8.0
(25 ratings)
8.0
(1 ratings)
Support Rating
7.3
(8 ratings)
-
(0 ratings)
User Testimonials
Microsoft System Center Operations Manager (SCOM)SolarWinds Database Performance Monitor
Likelihood to Recommend
Microsoft
More appropriate for:
  • Pure Microsoft ecosystem environments (Windows Server and SQL server) and the most common Linux and UNIX platforms.
  • Environments where cost is less of a factor than settling on a single platform for monitoring
  • Environments where the administrators are familiar with the setup and installation of SCOM.
Less appropriate for:
  • Pure UNIX/Linux shops, especially versions not supported out of the box by SCOM.
  • Shops that cannot afford the engagement to setup/configure and maintain on a continuous basis.
  • Shops that cannot dedicate personnel to the care and feeding of SCOM, especially when supporting larger environments.
Read full review
SolarWinds
Computing resources consumed by the DB instance, DPA queries & wait time, deadlock conditions, virtual infrastructure resources. The addition of NPM & DPA integration as well as cross-correlation in the identification of issues with the network or server or DB is all stupid-proof. Monitoring is more than just health and resource consumption, it's also performance. DB performance analysis is key to maintaining healthy DB instances.
Read full review
Pros
Microsoft
  • Allows us to visualize our systems in a single interface and see the status of health as well as relevant performance metrics.
  • A flexible and powerful interface with active alerting covering domain controllers, SQL servers, etc...
  • Allows you to customize your views and workspaces for specific tasks and needs.
  • Reporting is powerful and flexible.
Read full review
SolarWinds
  • Simple to use and very easy to learn.
  • The execution engines run in parallel, can execute any syntax or query.
  • DPN can run all queries for both Oracle and SQL with no additional support.
Read full review
Cons
Microsoft
  • One of the biggest drawbacks to SCOM is the sheer scope and complexity of the system. This can be a pro and a con. The system is very customizable, what you put into it is what you'll get out of it. That said, the learning curve is fairly steep. An organization needs to be committed to putting time and resources into SCOM to get the most out of it. I've heard stories from colleagues of several different companies that invested in SCOM and then abandoned it due to the excessive time and care required.
  • SCOM is expensive. Not only is the enterprise licensing costly, SCOM requires it's own servers, operational and warehouse databases to be maintained.
  • The OOB SCOM reports are a bit clunky and feel outdated.
Read full review
SolarWinds
  • The Reporting feature currently doesn't allow customization.
Read full review
Support Rating
Microsoft
Hard to get support. The product is not being actively developed anymore, so it is hard to get new features for the product.
Read full review
SolarWinds
No answers on this topic
Alternatives Considered
Microsoft
We used Altiris and WSUS and in the beginning Altiris had the better admin interface than SCOM, but it is no longer the case as SCOM has refined their admin interface. Altiris still has better and more robust group assignments for management roles and those two other tools can better manage non Windows OS devices than SCOM but for a large enterprise Windows shop, if you can afford it, SCOM is the way to go.
Read full review
SolarWinds
DPM is less expensive and more feature-rich. Also, Oracle tech support is garbage, unless you can afford to spend a day getting assistance.
Read full review
Return on Investment
Microsoft
  • It has allowed us to provide an Enterprise Event/Alert management solution to the Global company
  • It has taken a long time to get it to provide valuable alerts and information, lots of user resources and investment.
  • It assists with 24/7 monitoring and out of hours support
Read full review
SolarWinds
  • What is the cost of a downed DB instance? That's your ROI. DPM lets you see issues before they become critical.
Read full review
ScreenShots

SolarWinds Database Performance Monitor Screenshots
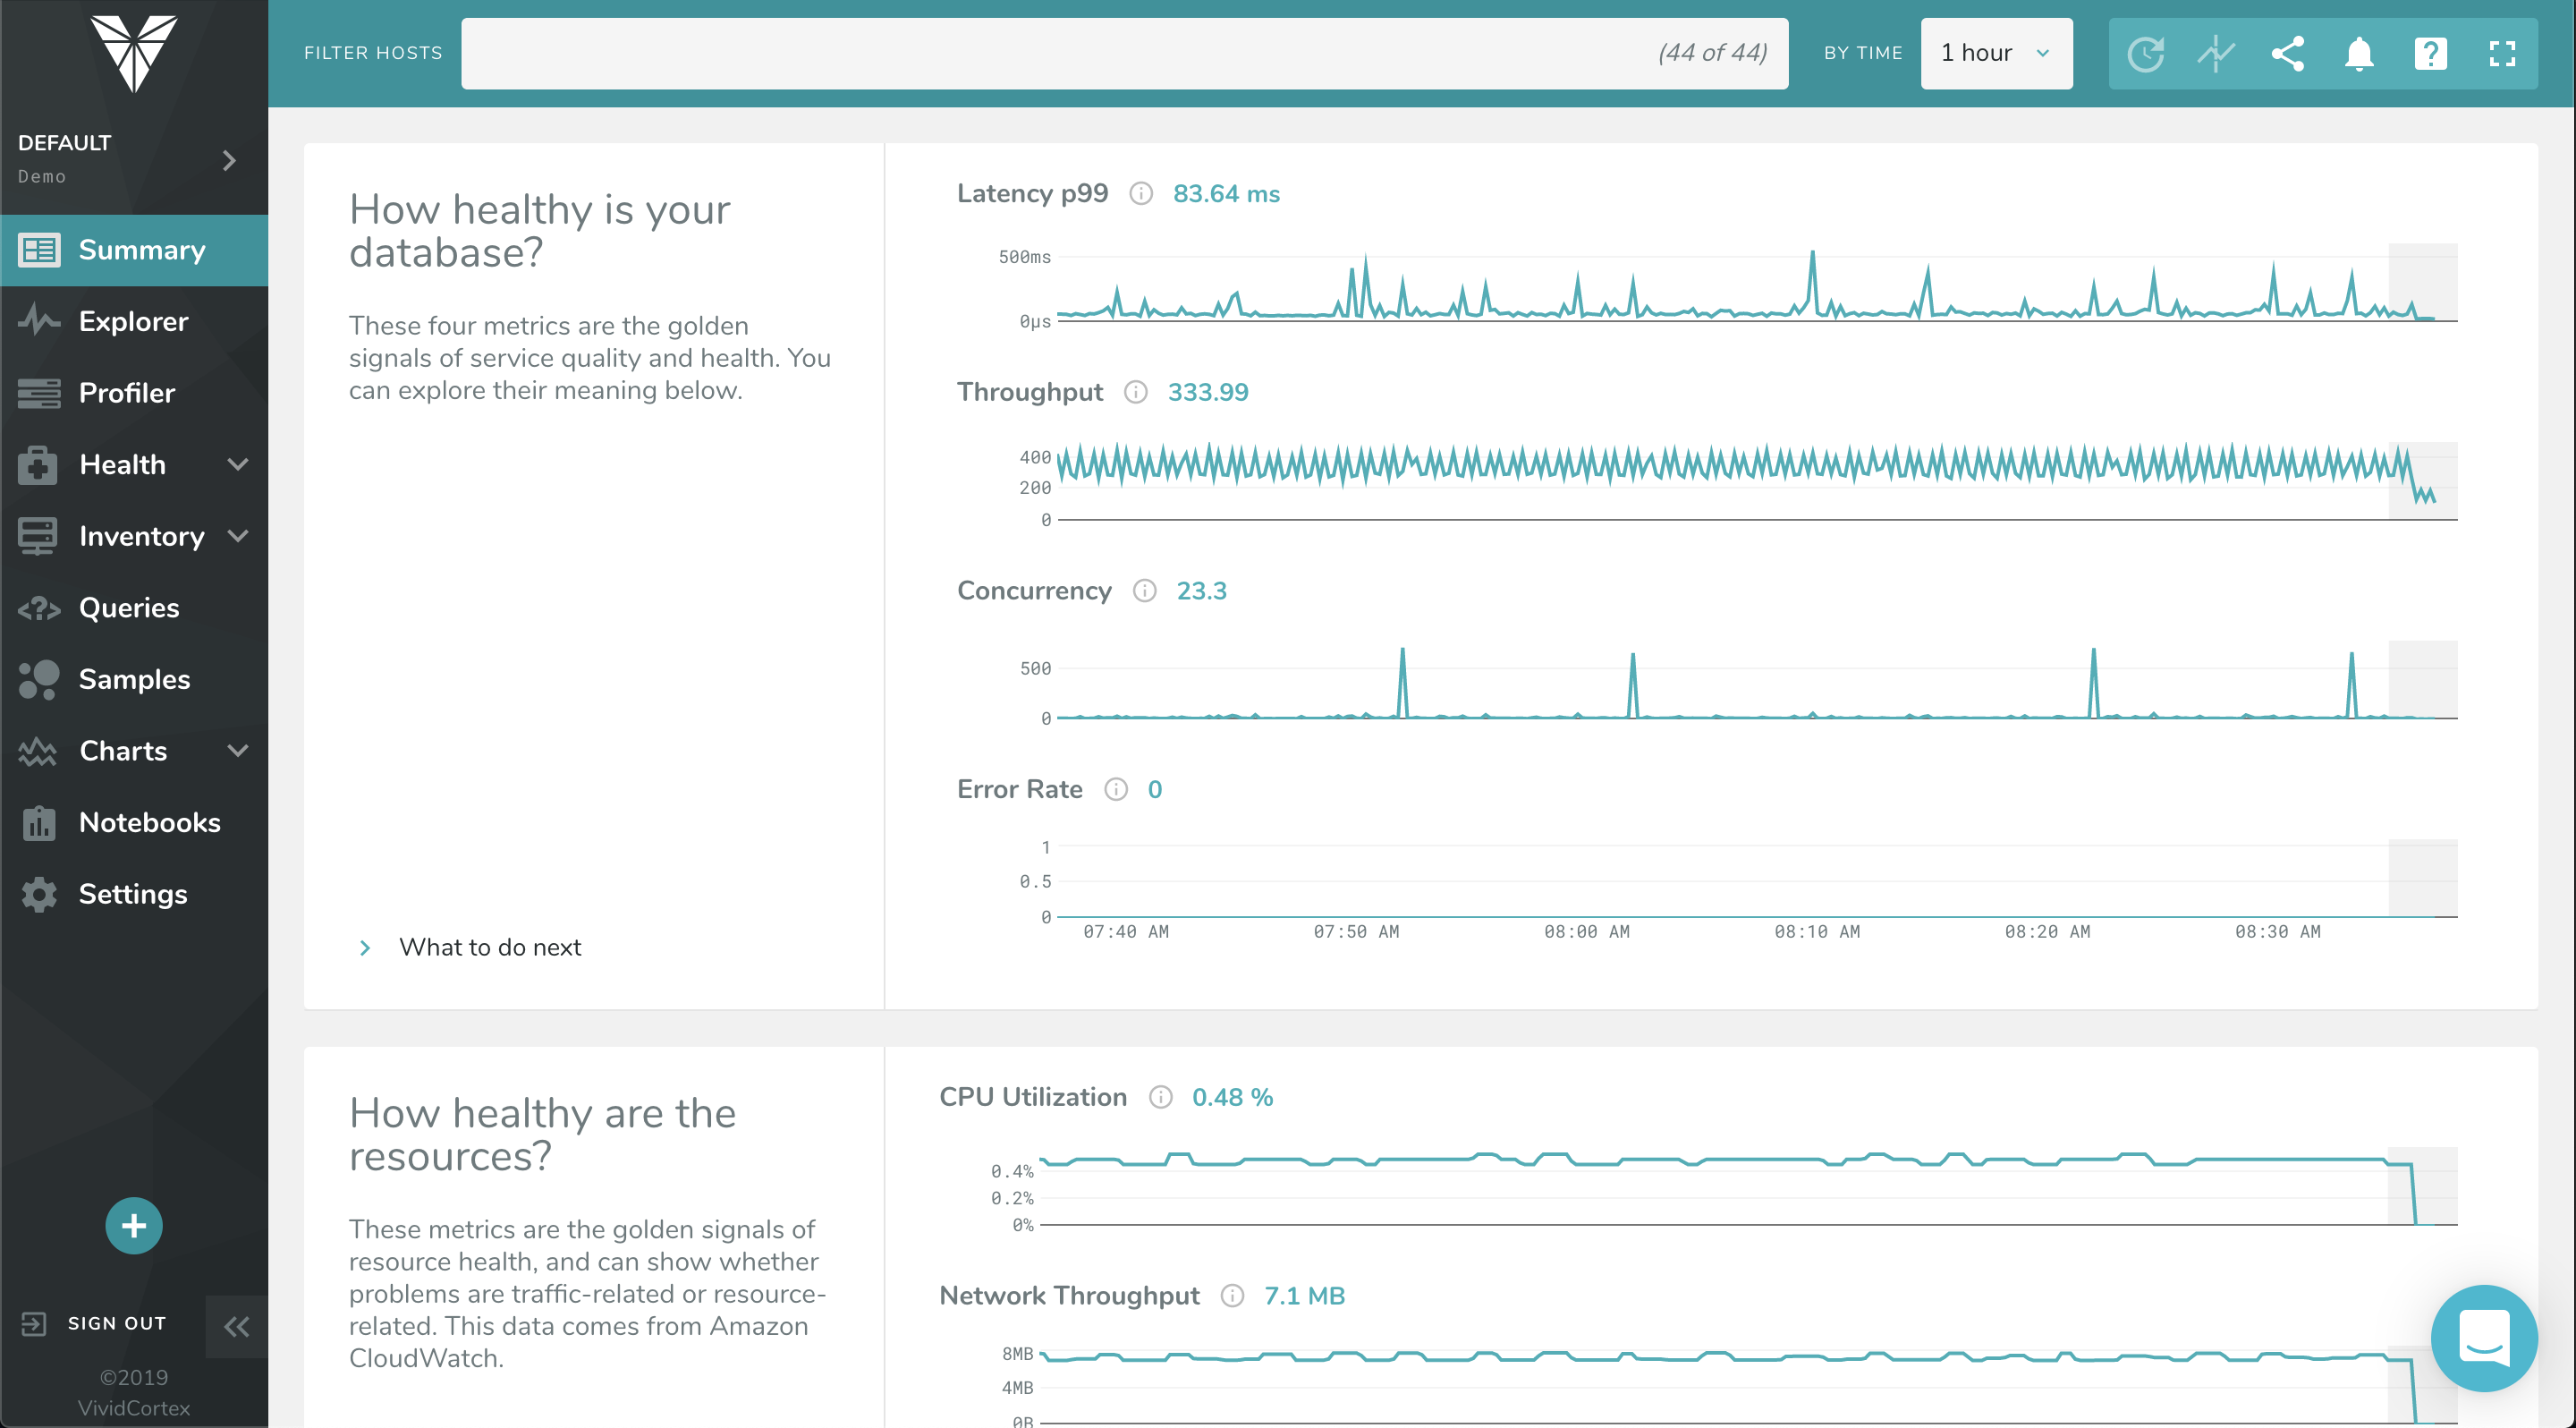
Screenshot of The Profiler Dashboard is a powerful, dynamic dashboard for ranking and filtering activity on your servers: It can instantly show you what needs attention and it provides a unified view of all your database types that VividCortex monitors. It enables you to view and understand your system by profiling it according to its most significant attributes—customized and selected by you.Screenshot of This dashboard displays a list of queries and allows you to filter them with powerful specificity. Filters can be set according to query text, host, and timeframe when the query was first seen / last active.Screenshot of VividCortex captures an enormous amount of data, and the Summary Dashboard helps users make sense of it, reducing their time-to-insight. It features widgets with automatic displays for Top 5 Queries by Total Time, Top 5 Queries by User CPU, Application Overview, Critical Events, and more.Screenshot of VividCortex monitors thousands of metrics in your system, and the Charts and Dashboard’s navigation pane allows you to toggle, customize, and enable various categories of generated charts. You can then easily navigate and examine the charts’ metrics with mouseover and zoom capabilities.