Nagios provides monitoring of all mission-critical infrastructure components. Multiple APIs and community-build add-ons enable integration and monitoring with in-house and third-party applications for optimized scaling.
N/A
Nagios XI
Score 8.5 out of 10
N/A
Nagios XI is an Enterprise Server and Network Monitoring Software, built on Nagios Core and designed to comprehensive application, service, and network monitoring in a central solution. Nagios XI is available in two different editions: Standard Edition and an Enterprise Edition. The Enterprise Edition provides users with additional functionality and includes features that are designed to aid in…
$1,995
Per Instance
Pandora FMS
Score 9.1 out of 10
Enterprise companies (1,001+ employees)
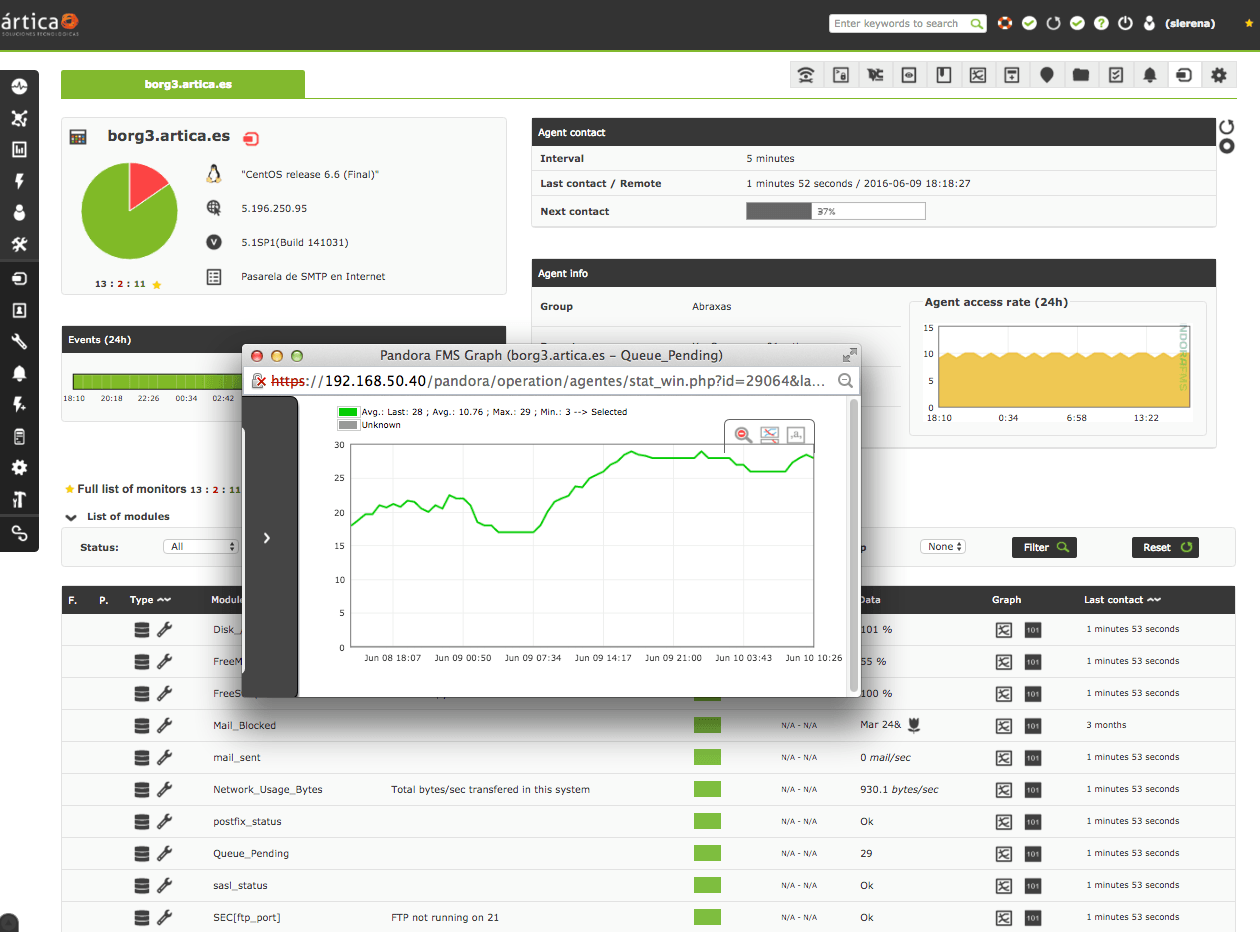
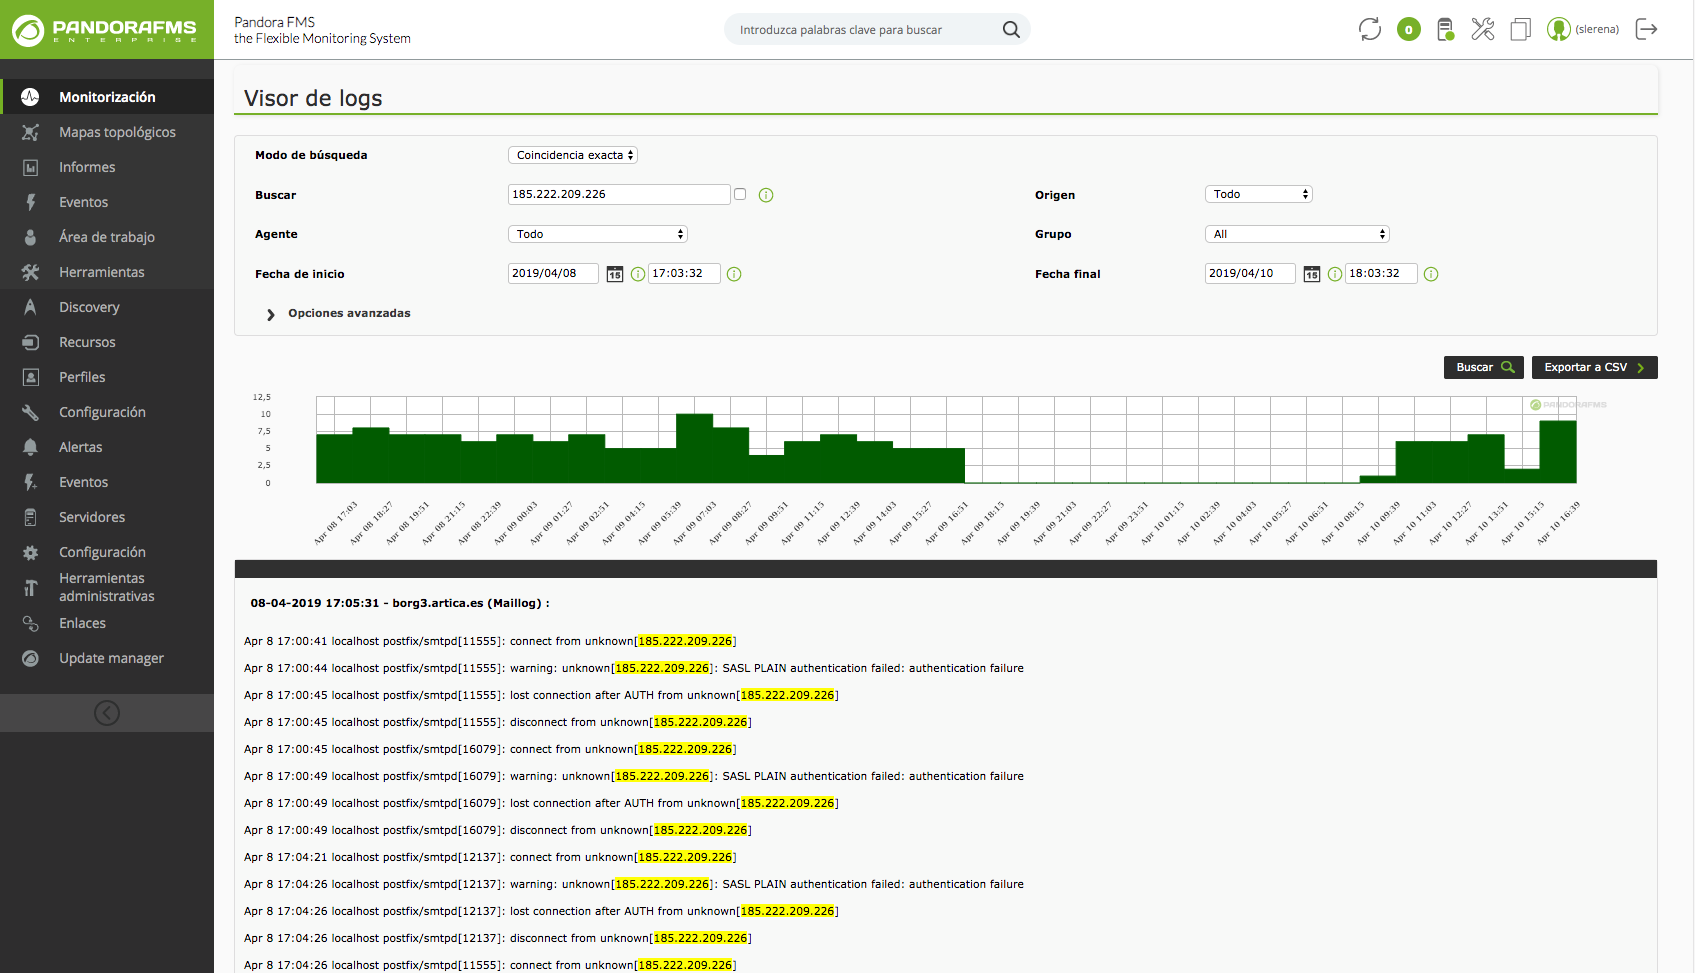
Pandora FMS is a flexible monitoring solution. It is presented as ideal for medium and big-sized environments with at least 100 devices. Users can monitor any device, infrastructure, application, IT as well as business processes and services. It allows business users to obtain information from their concerns in real time, visualizing the data in a direct way.
The solution boasts users among companies and organizations in more than 40 countries around the world, who according to the…
$2,990
100 nodes
Pricing
Nagios Core
Nagios XI
Pandora FMS
Editions & Modules
Single License
Free
Single License
Free
Standard
$1995
Per Instance
Enterprise
$3495
Per Instance
NMS Edition
$2,990
100 nodes
Enterprise Edition
$4,250
100 nodes
Offerings
Pricing Offerings
Nagios Core
Nagios XI
Pandora FMS
Free Trial
Yes
No
Yes
Free/Freemium Version
Yes
No
Yes
Premium Consulting/Integration Services
Yes
No
Yes
Entry-level Setup Fee
No setup fee
No setup fee
Required
Additional Details
—
—
Licensed for individual nodes (agents), starting from 100 nodes.
We considered Pandora FMS to be the solution that offered more features at a lower cost. We were particularly interested in the abundance of options available in Pandora FMS's free version and the ability to monitor practically anything in an extremely heterogeneous environment …
Nagios monitoring is well suited for any mission critical application that requires per/second (or minute) monitoring. This would probably include even a shuttle launch. As Nagios was built around Linux, most (85%) plugins are Linux based, therefore its more suitable for a Linux environment.
As Nagios (and dependent components) requires complex configurations & compilations, an experienced Linux engineer would be needed to install all relevant components.
Any company that has hundreds (or thousands) of servers & services to monitor would require a stable monitoring solution like Nagios. I have seen Nagios used in extremely mediocre ways, but the core power lies when its fully configured with all remaining open-source components (i.e. MySQL, Grafana, NRDP etc). Nagios in the hands of an experienced Linux engineer can transform the organizations monitoring by taking preventative measures before a disaster strikes.
If anyone looking for the monitoring system for the infrastructure this is the go-to tool which monitors all infrastructure related components from server health to Networking and update us with mails and can be easily integrated with multiple other tools as needed for example PagerDuty , Also this suits good both on premises and cloud environments as well. If we are managing complex environment this tool for monitoring is best one.
I believe Pandora FMS is a solution that adapts to any type of scenario; it's useful for small businesses as well as large organizations. It more than meets the need to have a comprehensive monitoring system capable of sending alerts instantly and consulting historical data, logs, and trends. Additionally, for small businesses, the free version will be more than sufficient in most cases. And for those who do not want to deploy the service on-premise, there is an option for MaaS (Monitoring as a Service).
Nagios could use core improvements in HA, though, Nagios itself recommends monitoring itself with just another Nagios installation, which has worked fine for us. Given its stability, and this work-around, a minor need.
Nagios could also use improvements, feature wise, to the web gui. There is a lot in Nagios XI which I felt were almost excluded intentionally from the core project. Given the core functionality, a minor need. We have moved admin facing alerts to appear as though they originate from a different service to make interacting with alerts more practical.
We're currently looking to combine a bunch of our network montioring solutions into a single platform. Running multiple unique solutions for monitoring, data collection, compliance reporting etc has become a lot to manage.
This tool has been has been of great use and learning , offering exceptional ease of use, scalability, and detailed reporting. It has a lot of customization options and proactive monitoring which have significantly improved our infrastructure management.It's UI & functions are good. Also has built in templates for various end points.It also provides graphical reports. With a Dashboard you can monitor easily
The Nagios UI is in need of a complete overhaul. Nice graphics and trendy fonts are easy on the eyes, but the menu system is dated, the lack of built in graphing support is confusing, and the learning curve for a new user is too steep.
We are using Nagios XI in our organization primarily for monitoring all our application servers and databases, this is helping us in addressing all the infrastructure issues in advance by alerting us when it any server hits the threshold as per the initial parameter setup also it has free tier which helps for small scale applications monitoring to save some expenses.
The solution is very complete, and even includes extras such as IPAM. Deployment can be a bit unintuitive at first, but once you become familiar with the solution and thanks to its automatic deployment options it ends up being easier than it seemed. The power and options of the solution are its greatest virtue.
I haven't had to use support very often, but when I have, it has been effective in helping to accomplish our goals. Since Nagios has been very popular for a long time, there is also a very large user base from which to learn from and help you get your questions answered.
I have been participated in the few implementations, and I would say its bit complex when its come to initial setup once its set post that its easy to manage
Because we get all we required in Nagios [Core] and for npm, we have to do lots of configuration as it is not as easy as Comair to Nagios [Core]. On npm UI, there is lots of data, so we are not able to track exact data for analysis, which is why we use Nagios [Core].
Cost efficiency is the main reason which we opted [for] Nagios as we were previously using IDERA tool with comprehensive database monitoring solutions, but the slow performance we are getting while monitoring the instance of the database.
Before using Pandora FMS, tests were carried out with all these tools:
Nagios
Zabbix
System Center Operations Manager (SCOM)
IBM Tivoli
PRTG
SolarWinds
Pandora FMS allows simple customization by making adjustments to text files, developing agent add-ons without the need to be a programmer, there is no scenario where we could not take data and save it in PandoraFMS, IoT, industrial products, and everything that any client needs to monitor.
We have installed Nagios XI for our monitoring system and with this we are managing around 600 servers in total and not seen any major issues with its scalability we can scale it as much as we require and also installed on various applications servers and working as expected
With it being a free tool, there is no cost associated with it, so it's very valuable to an organization to get something that is so great and widely used for free.
You can set up as many alerts as you want without incurring any fees.