Nagios XI is an Enterprise Server and Network Monitoring Software, built on Nagios Core and designed to comprehensive application, service, and network monitoring in a central solution. Nagios XI is available in two different editions: Standard Edition and an Enterprise Edition. The Enterprise Edition provides users with additional functionality and includes features that are designed to aid in…
$1,995
Per Instance
NetApp Cloud Insights
Score 9.2 out of 10
N/A
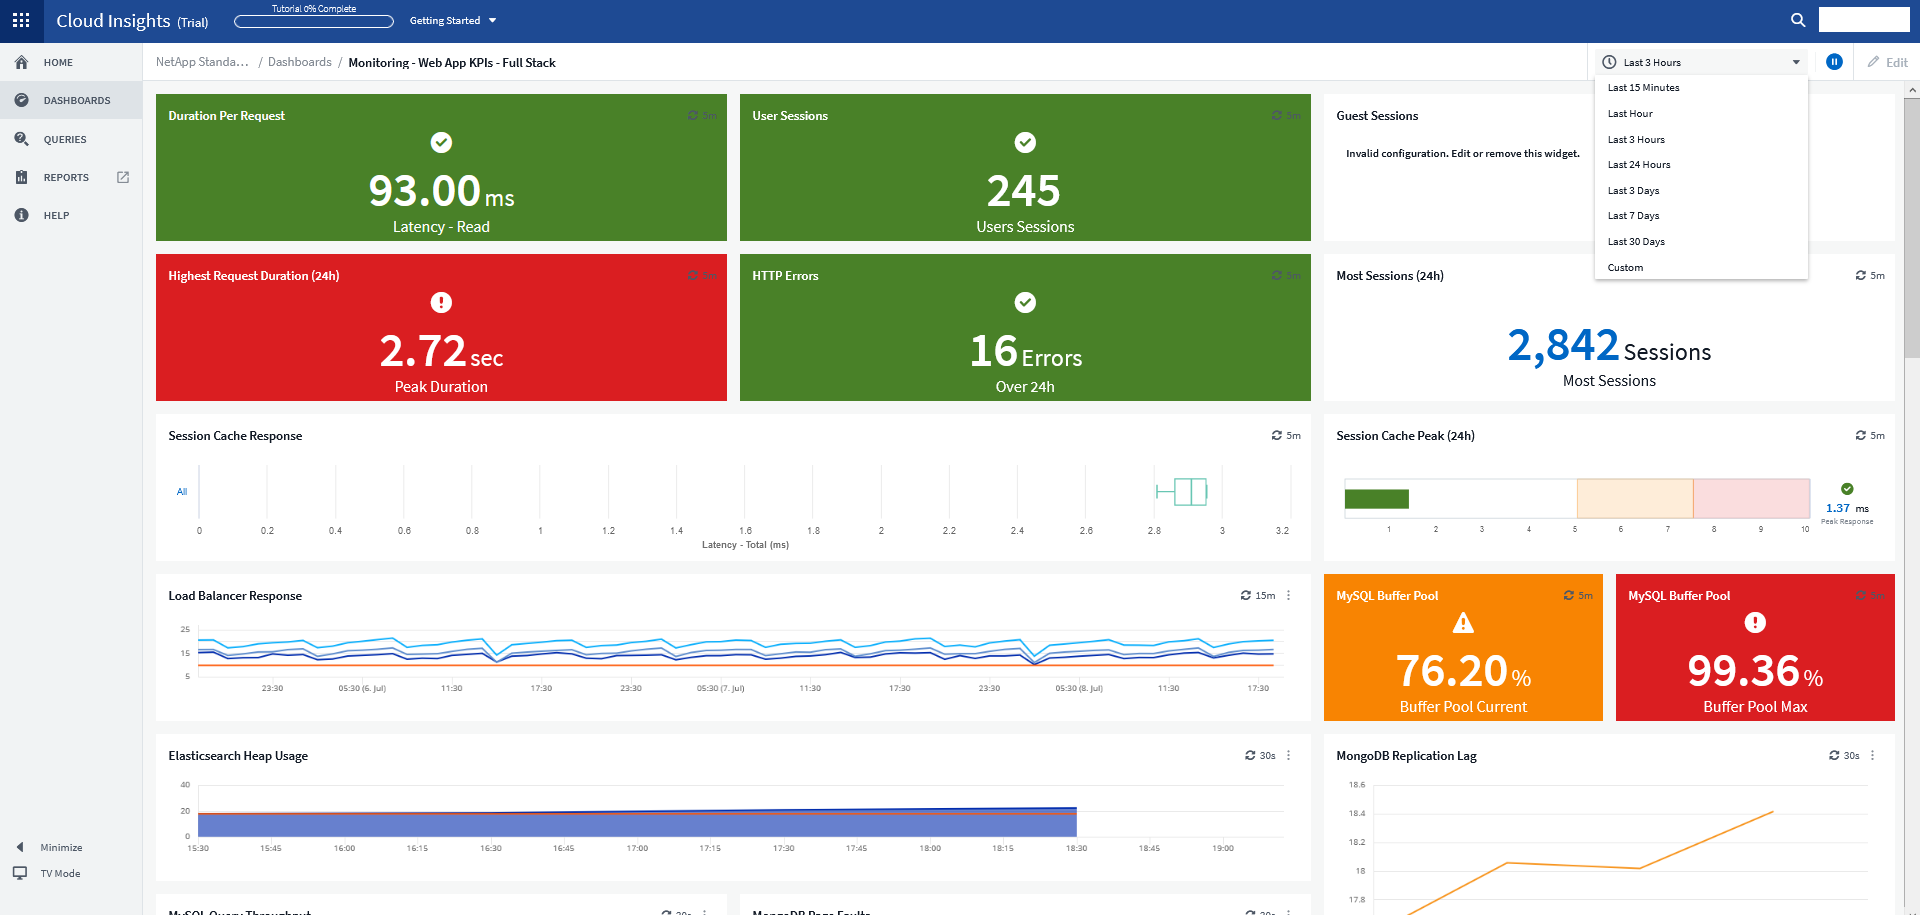
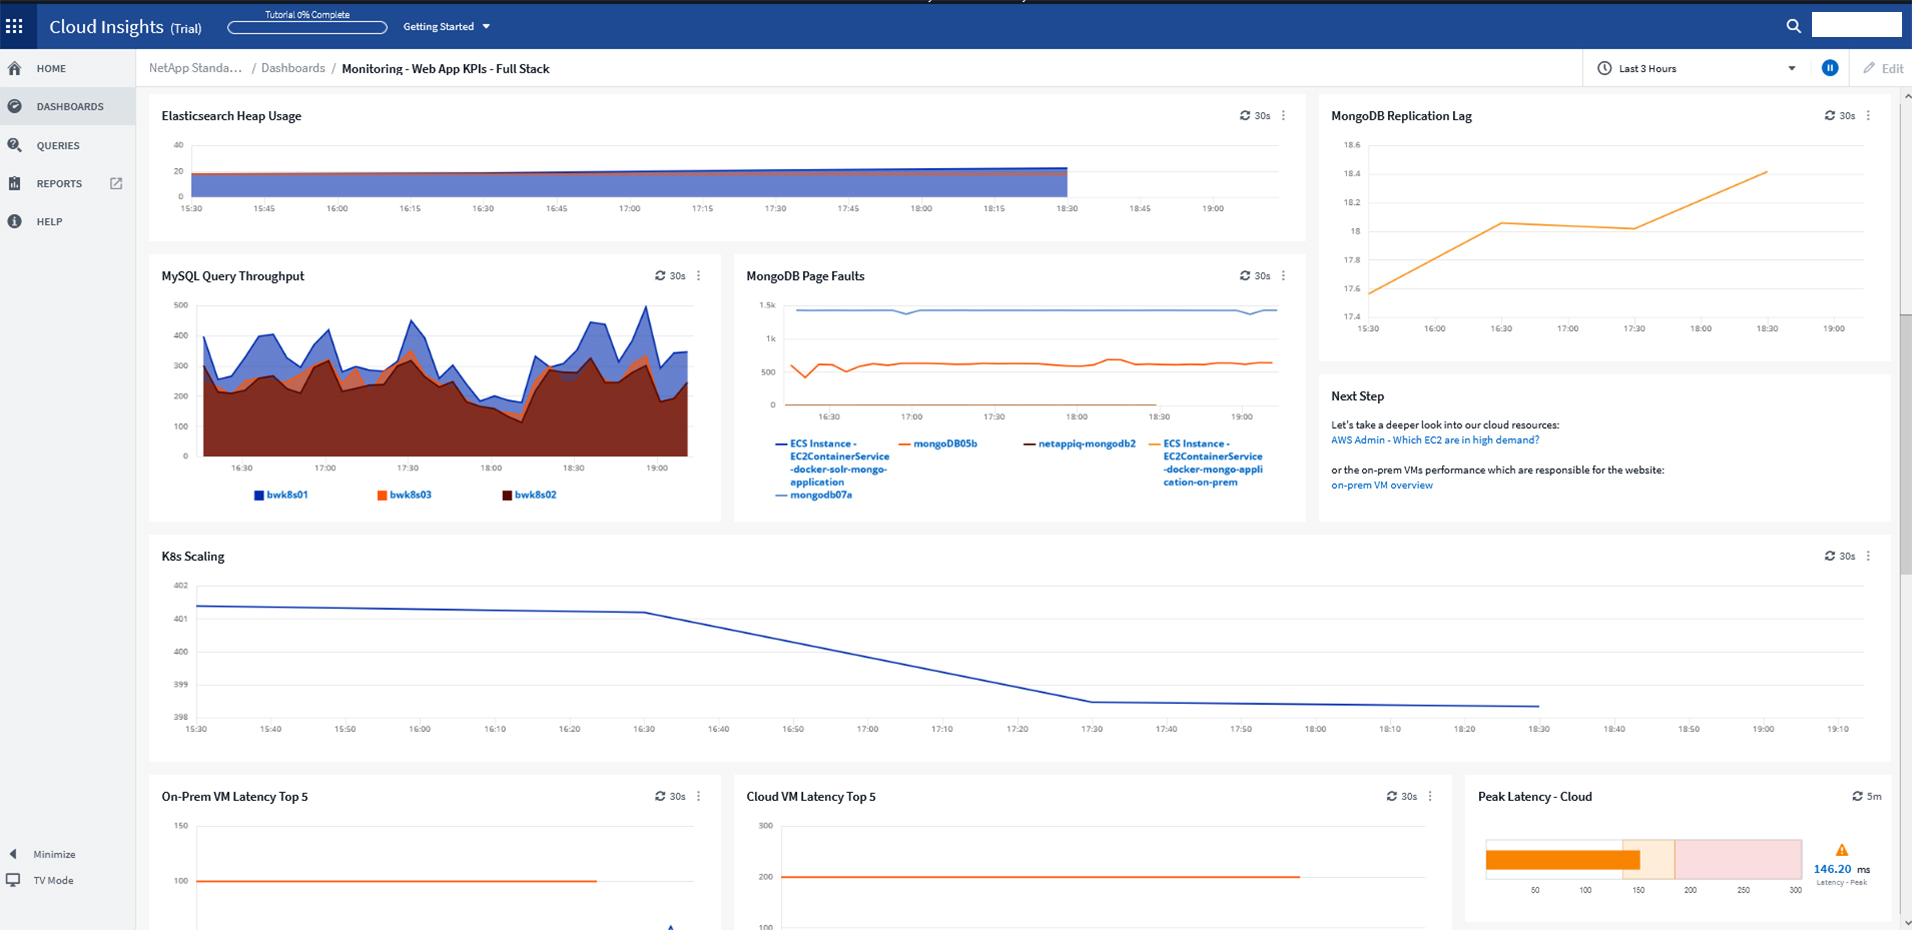
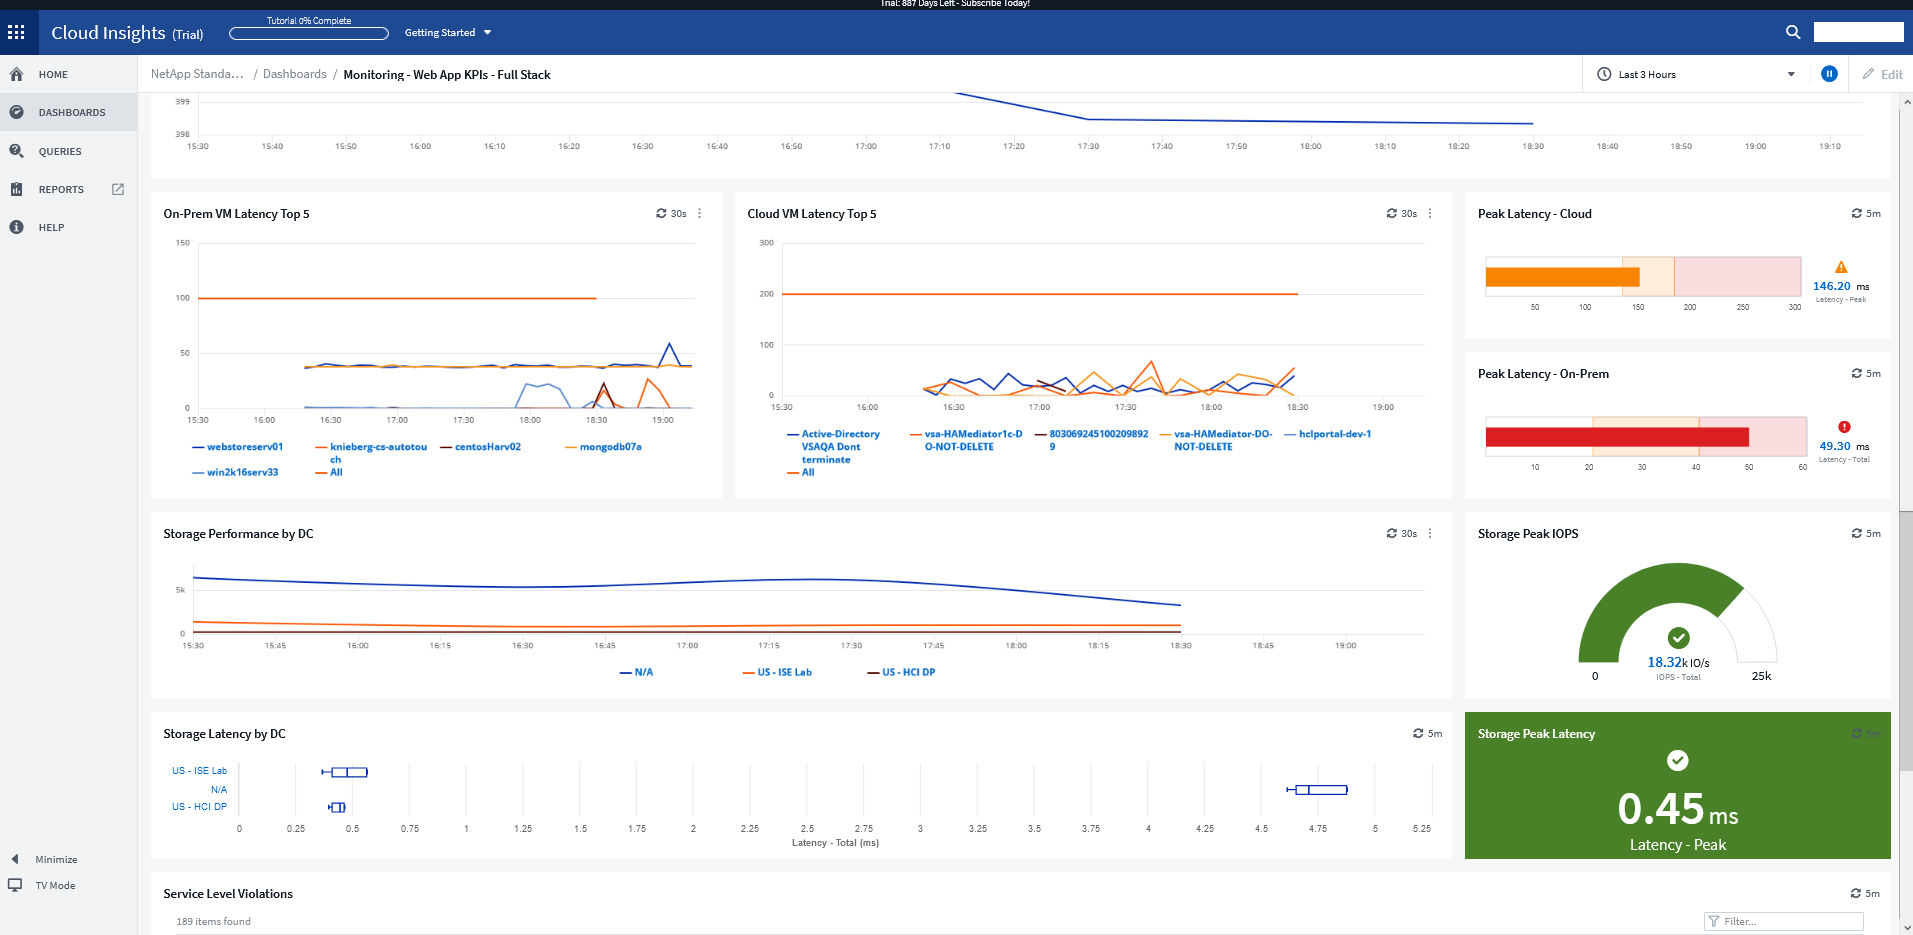
NetApp Cloud Insights is an infrastructure monitoring tool that gives
users visibility into their complete infrastructure. With Cloud Insights, users can monitor, troubleshoot and optimize all resources including
public clouds and private data centers.
If anyone looking for the monitoring system for the infrastructure this is the go-to tool which monitors all infrastructure related components from server health to Networking and update us with mails and can be easily integrated with multiple other tools as needed for example PagerDuty , Also this suits good both on premises and cloud environments as well. If we are managing complex environment this tool for monitoring is best one.
For example, we had an application slowdown. It looked like the slowdown was storage. However, it was a malformed SQL query that no one realized was pulling data from the storage location that also housed the application. Cloud Insights saved us hours of downtime and frustration. Cloud Insights pinpointed which system was hogging resources. What makes Cloud Insights special is the way it looks at the data collected from the data sources. The insights it provides into the flow of data; sheds new light on how things work in your environment.
This tool has been has been of great use and learning , offering exceptional ease of use, scalability, and detailed reporting. It has a lot of customization options and proactive monitoring which have significantly improved our infrastructure management.It's UI & functions are good. Also has built in templates for various end points.It also provides graphical reports. With a Dashboard you can monitor easily
We are using Nagios XI in our organization primarily for monitoring all our application servers and databases, this is helping us in addressing all the infrastructure issues in advance by alerting us when it any server hits the threshold as per the initial parameter setup also it has free tier which helps for small scale applications monitoring to save some expenses.
I have been extremely happy with its usability. You can take thins as they are out of the box and it is useful. You can carry it as far as you want to go and every step you take improves your ROI.
I have been participated in the few implementations, and I would say its bit complex when its come to initial setup once its set post that its easy to manage
Cost efficiency is the main reason which we opted [for] Nagios as we were previously using IDERA tool with comprehensive database monitoring solutions, but the slow performance we are getting while monitoring the instance of the database.
For a while, we were using Zabbix to monitor our Kubernetes applications and microservices on our infrastructure in more than one public cloud platform. Cloud Insights has much better visualized dashboards. In addition, despite such a large number of quality features, it's still priced competitively.
We have installed Nagios XI for our monitoring system and with this we are managing around 600 servers in total and not seen any major issues with its scalability we can scale it as much as we require and also installed on various applications servers and working as expected
Once you install the acquisition unit and start collecting data, you can immediately begin using it. It is very self-explanatory and helpful. I could have used Cloud Insights without working with the NetApp Cloud Insights support team. I am glad I engaged them though. They helped me carry Cloud Insights to a new level and it fast-tracked the process that would have taken me time to complete.