SolarWinds Database Performance Analyzer (DPA) enables deep visibility into database performance and expert advice for performance optimization and tuning. What can you monitor with DPA? Oracle Oracle Exadata Oracle EBS Microsoft SQL Server Azure SQL Database Azure SQL Database Managed Instance MySQL DB2 SAP ASE Aurora MariaDB DPA monitors physical, virtual,…
N/A
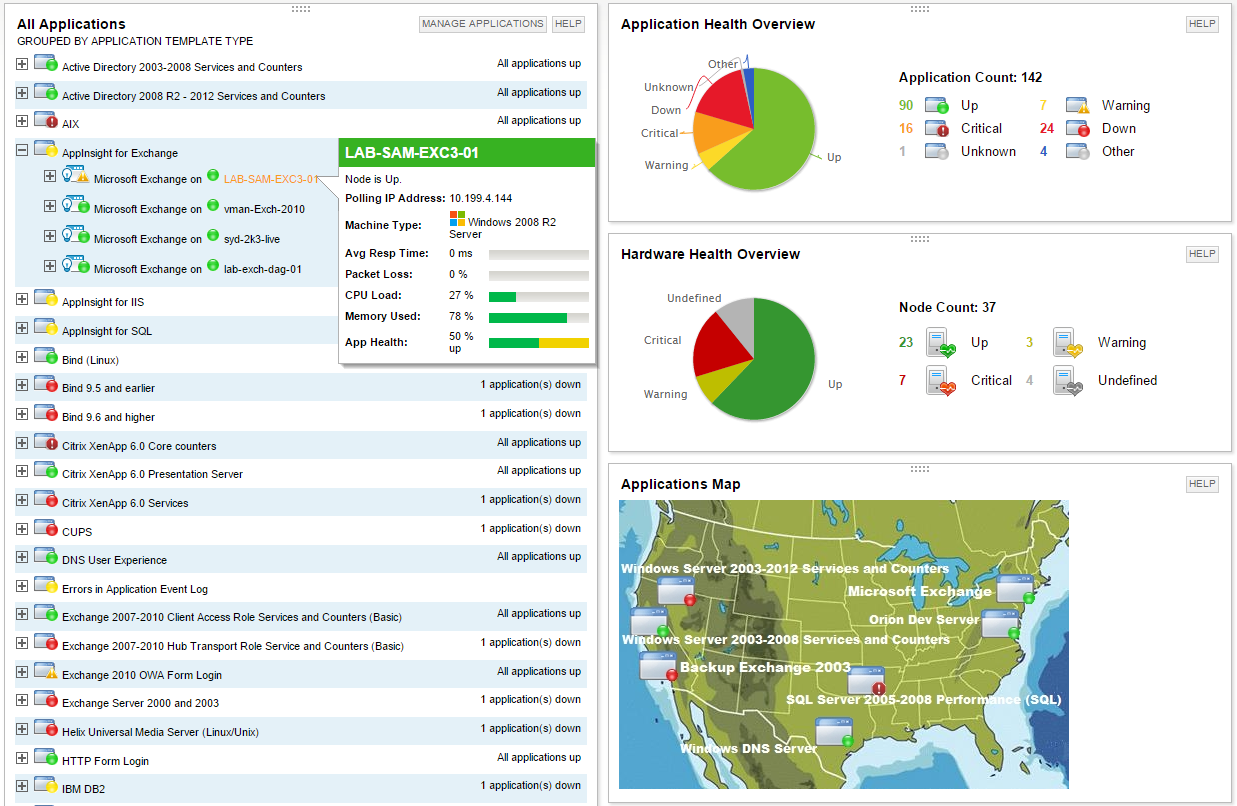
SolarWinds Server & Application Monitor
Score 7.7 out of 10
N/A
SolarWinds Server & Application Monitor (SAM) delivers application and server monitoring capabilities. SAM allows for self-service for easy setup, 1200+ monitoring templates, and customization options, as well as integrate with other SolarWinds products.
N/A
Pricing
SolarWinds Database Performance Analyzer
SolarWinds Server & Application Monitor
Editions & Modules
No answers on this topic
No answers on this topic
Offerings
Pricing Offerings
SolarWinds Database Performance Analyzer
SolarWinds Server & Application Monitor
Free Trial
Yes
Yes
Free/Freemium Version
No
No
Premium Consulting/Integration Services
No
No
Entry-level Setup Fee
Optional
No setup fee
Additional Details
—
SAM pricing starts at $2,995.
More Pricing Information
Community Pulse
SolarWinds Database Performance Analyzer
SolarWinds Server & Application Monitor
Considered Both Products
SolarWinds Database Performance Analyzer
Verified User
Manager
Chose SolarWinds Database Performance Analyzer
Over the period of ownership, we have seen the products slowly integrate with each other to help create a single pane of glass for all team members to use. With this consolidation, it has helped create a single concise picture across the team, across all layers of IT.
Idera looks like they are headed to a similar end product. However, their product is not as mature. Solarwinds Database Performance Monitor is an acquisition of an already mature product upon which they added value by integrating it with their extensive software base and …
At the time we evaluated Database Performance Analyzer, we were already using other Solarwinds products and we were looking for that continued ease of use and integration so we didn't really evaluate any other products.
I haven't seen a better tool for analyzing and tuning queries based upon wait times. However, for operational monitoring, finding current blocking, and at times slow queries that aren't run frequently, it lacks true benefit. Best use is for long term production query tuning and …
We did not test any others as we already had SolarWinds Network Performance Monitor and the Server & Application monitor integrates with the Network Performance monitor. They both run on the same server as well saving on costs.
PRTG was a consideration as it provides a expansive platform for any monitoring system. However, SAM is part of a larger Solarwinds environment that few companies can match for community and support. SAM's value keeps increasing with each other product purchased as the …
SAM provides far more details than either of the products listed above and allows us to add custom services along with the built-in performance parameters. SAM also provides a more useful user interface that allows an overall view for quick problem identification and the …
We selected SolarWinds due to its ability to provide a holistic view of all of our infrastructure in the same place. We link SAM with Solar Wind's network monitor and database performance analyzer. This allows us to track and view performance implications of any change anywhere …
This is an easy 10 because I actually have recommended this product to multiple clients and colleagues! Any shop that writes its own SQL queries will benefit from the insight provided by SolarWinds Database Performance Analyzer, so they know which of their queries is causing a bottleneck. Small shops or databases with only a few tables likely will see far fewer opportunities for optimization.
It is a well-suited software for monitoring and surveillance of your deployed nodes. The error-readability and filter options for filtering out logs and errors could be improved. But overall, it has a good UI design, is user-friendly, and is very easy to learn and access for new users.
Alerts seem to be lacking in DPA compared to competitor's tools. They can be setup but are not quite as easy or as helpful as some other tools I have used.
Grooming/pruning the repository database isn't very easy. We don't manage a lot of instances but our repo DB has grown pretty significantly.
At times when I am drilled-down to a chart, it can be difficult to navigate around from that point to another time range/query/metric.
We have relied on this product for a very long time and it continues to exceed expectations. The product is a vital part of our organization at this point, it would not be very ideal for us to abandon it. We use it almost every day and depend on its alerts for critical parts of our business
We are heavily invested in Solarwinds products for a reason. They are generally easy to setup and run with, requiring only some interfacing with support or help articles on rare occasions. They do what we bought them to do and we can't ask for more.
I don't want to think about managing clusters of SQL servers in the future without this tool. We have demoed other tools and SolarWinds Database Performance Analyzer is the gold standard for usability and insight into what your servers are doing. The UI is a bit dated, but everything is laid out in a logical manner and drilling down into queries or timeslices is extremely intuitive.
SolarWinds Server & Application Monitor is quite easy to use and super versatile. It allows you to do just about anything you can through premade templates or through scripting. You can use an agent on the servers if you want to, or you can monitor through WMI or SNMP credentials. You can customize thresholds for alerting quickly, and you can configure alerts to be as complex or as simple as you want.
The graphical interface and the performance of the database leave a little to be desired, they could be better explored.Some functionality and screens do not work well depending on the browser used. The integrations never had any problems or caused crashes in other systems.
I have had to use their support on a few occasions, for reasons that I am not clear about until recently I have always had problems upgrading the software (although the last 2 updates have gone without issue which I am very pleased to say). On those unfortunate occasions, the support has been brilliant with either excellently documented guides on how to resolve the issue by myself or have been hands-on with calls and screen sharing to remotely fix the issue. Every time the problem was sorted and more importantly, nothing was lost (apart from a bit of time). And as I stated above whatever the problem was that was causing my upgrade issues appears to have been resolved in the last 2 updates.
I think there was only a couple times I had to open a support case for SAM and one time they got multiple engineers on the phone to get a better idea what I was trying to monitor and was able to point me in the best direction to monitor that system.
Follow the guidelines for the capacity of the servers. We found that the DPA databases were getting rather large and also that there are ways to reduce their size built into some of the options.
At the time, we found SolarWinds Database Performance Analyzer to be easier to setup and to have a richer feature set than Redgate SQL Monitor, plus, from what I remember, the DPA pricing worked better for us over the course of a year. We're very happy with all the features DPA has to offer.
Nagios requires far more manual work to configure than SolarWinds does, though that also encourages customization and perfect-fit solutions. Nagios also requires far, far fewer resources to run than SolarWinds: SolarWinds wants great gobs of memory and disk, while Nagios is refreshingly humble. Nagios starts working from the first minute, too, whereas SolarWinds needs lots of set-up time.