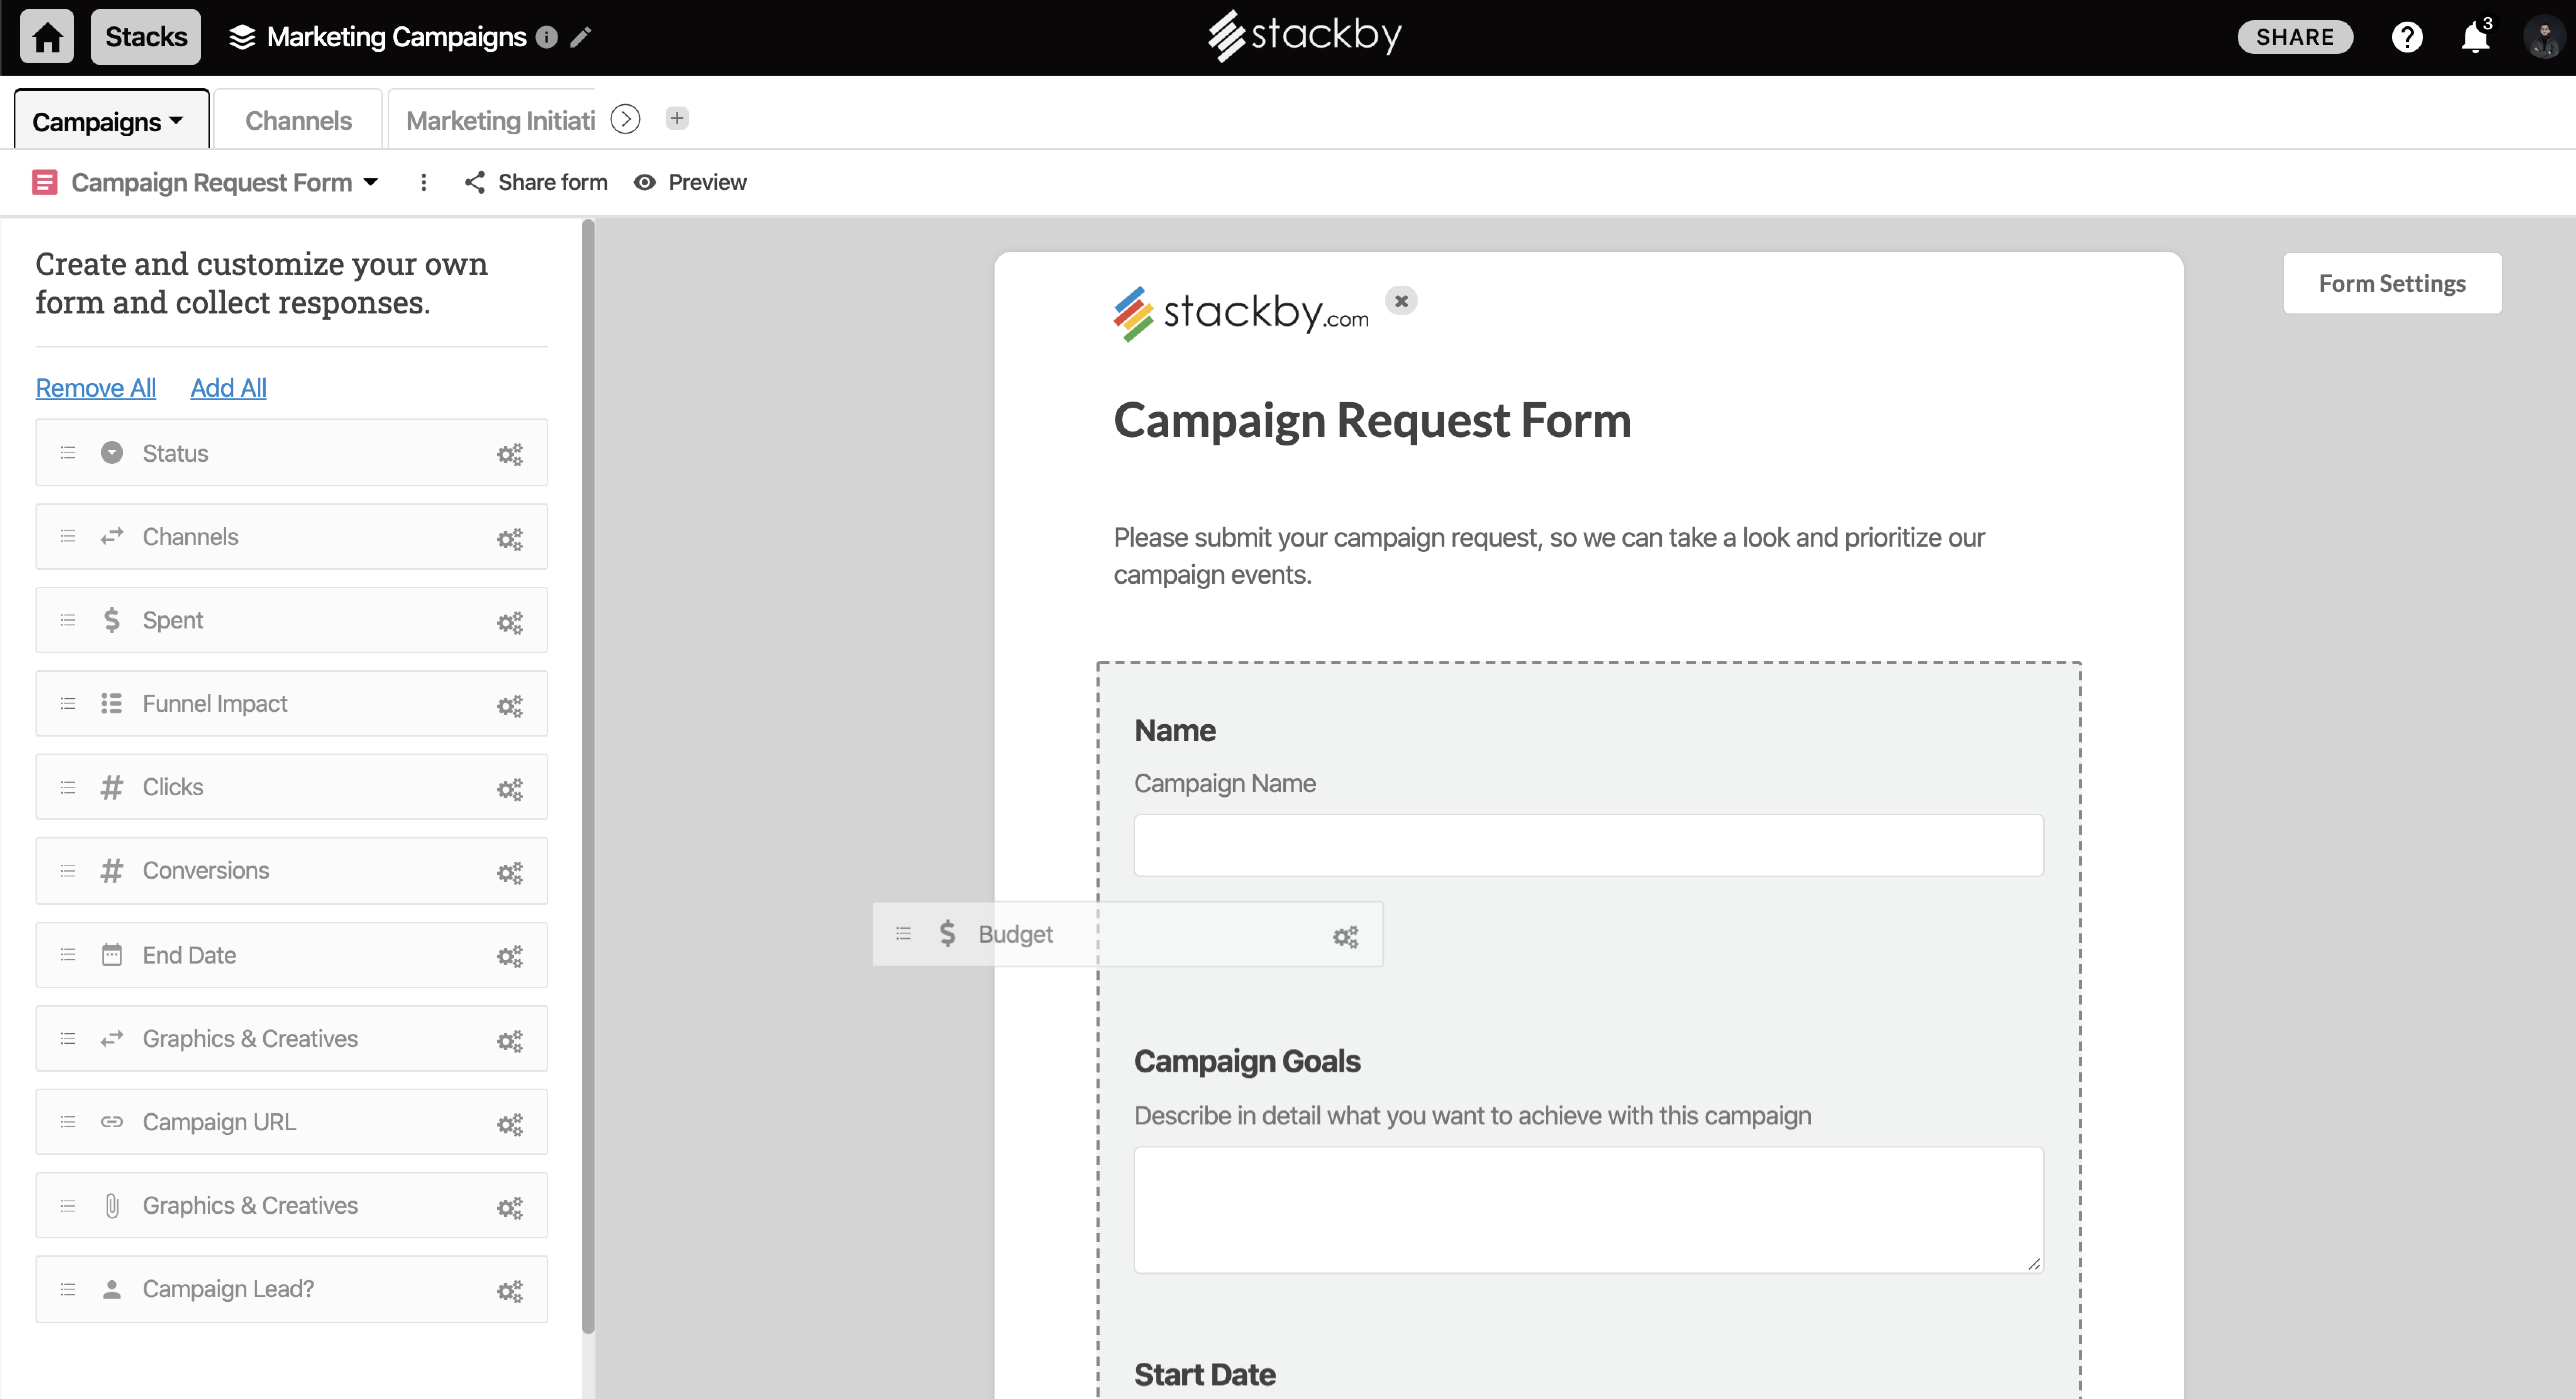
Stackby is designed to bring together the simplicity of spreadsheets, the functionality of databases and integrations with best business APIs to let anyone build their own tools, the way they want. No coding needed. Users can build a database from scratch, import data from pre-existing sources like spreadsheets or Google Sheets, or choose from over 100 pre-built templates across multiple categories. Stackby offers over 25 unique column types like text,…
$5
per month per user
Tableau Public
Score9.9 out of 10
N/A
Tableau Public is a free edition of the Desktop product. With this edition, data can only be published to the Tableau public website and does not allow work to be saved or exported locally.
Based on my experience, I can provide specific scenarios where Stackby is well suited and others where it may be less appropriate: Project Management: Stackby is an excellent choice for project management scenarios. Its ability to create custom databases, track tasks, assign responsibilities, and collaborate in real-time makes it highly effective for managing and monitoring project progress. CRM and Sales: Stackby is well suited for managing customer relationships and sales processes. Its customizable database structure allows for organizing customer information, tracking leads, managing deals, and generating reports. The ability to integrate with other tools further enhances its usefulness in CRM and sales workflows. Content Planning: Stackby is a great fit for content planning scenarios. Users can create databases to manage editorial calendars, track content ideas, assign tasks to team members, and monitor content performance. Collaboration features facilitate seamless content collaboration and ensure timely publishing.
Tableau public is the best platform to build dashboards for your personal profile and share with recruiters. It's always good to keep ourselves updated on the latest features, create sample dashboards and save them to a personal profile. Tableau public is free and doesn't need any subscription. anyone can create an account and start building reports.
Data visualization: lots of different options, including bar, scatter, pie, waterfall charts to explore relationships between variables, and to present findings/trends to different teams
Integrates readily with limited, though different data sources: TXT, CSV, TDE, Access
Exports reports for review of different dashboards: client-ready/team-ready, with a clean and tidy presentation in PDF format (or hardcopy)
A de minimis incentive was given to thank the reviewer for their time. The incentive was not used to bias or drive a particular response, nor was the incentive contingent on a positive endorsement. More Info
Implement the same views available on desktop into the mobile app
Internal automations (like Airtable)
Ability to implement and display info as a dashboard (like Airtable)
Polish up the formatting of formulas, inputting them causes user frustration due to the formula input cursor jumping around
Better intelligence and ease of inputting data in bulk i.e have the fields automatically identify what data is being input and format appropriately (like Airtable does)
Tableau Public (both Desktop and Server) like their "for a fee" counterparts offer very easy to learn and use tools to transform data into pictures and gain insights into your data. Most organizations report a reduction in development time of 10x vs. other similar tools, due to the intuitive user interface. That said, with Tableau Public, published workbooks are "disconnected" from the underlying data sources and require periodic updates when the data changes. Users are limited to 1 Gb of storage space per user ID and password as well.
I would like to see better options for public sharing of visualizations and data from within the "for a fee" products as more and more organizations are moving in the direction of data sharing with partners and their communities.
A de minimis incentive was given to thank the reviewer for their time. The incentive was not used to bias or drive a particular response, nor was the incentive contingent on a positive endorsement. More Info
It's free, right? I'll keep using the free version. So the real question to ask is this? Will I pay $999 for the Personal version or $1,999 for the Professional? Yikes! That is a big stretch. I'm not sure about that. The product comparison chart is at: http://www.tableausoftware.com/public/comparison
Stackby is overall pretty easy to use, especially if you're used to something like Airtable or SmartSuite. Some of the pages seem like near exact clones (though they put their own creative spin on things). I'd prefer a slighty fresher interface (like SmartSuite), but I'm willing to sacrifice that for the better price and great customer service.
Tableau public is a great training tool to understand the basics of Tableau before buying it. A great tool to extend Excel's visualization and to publish data for others. Not useful for anything you need secure. No ability to access databases. Static information only.
A de minimis incentive was given to thank the reviewer for their time. The incentive was not used to bias or drive a particular response, nor was the incentive contingent on a positive endorsement. More Info
Start at the end and work backward. Identify the business case / issue and questions the end users have, then identify the data needed, and where to get it.
A de minimis incentive was given to thank the reviewer for their time. The incentive was not used to bias or drive a particular response, nor was the incentive contingent on a positive endorsement. More Info
I have also tried Ora.Pm. Infinity has better graphical interface, but nowhere near as many features and the UI isn't as effective (i.e, moving around with keys). Grist has a much more technical interface and it comes from being more of a database/interactive spreadsheet vs Stackby. Grist has much more functionality in terms of formulas, but is much harder to learn to use and less other functionalities. Ora.PM is more of a test at a task management app, and doesn't compare - Stackby is much better.
Google Charts/Drive is sufficient for simpler data sets, but it does not integrate with other web platforms and the visualization does not look as professional. I'm not aware of any other competitors that offer the same package as Microsoft.
A de minimis incentive was given to thank the reviewer for their time. The incentive was not used to bias or drive a particular response, nor was the incentive contingent on a positive endorsement. More Info
A de minimis incentive was given to thank the reviewer for their time. The incentive was not used to bias or drive a particular response, nor was the incentive contingent on a positive endorsement. More Info